
The S&P 500’s CAPE ratio has climbed into the low 40s, putting it within striking distance of the all-time record of 44.19 reached in December 1999. Financial media coverage of this development tends to carry an unmistakable subtext: that figure was the high-water mark of the dot-com era, and the bubble burst roughly three months later.
That framing treats the CAPE ratio as a countdown clock. It was never designed to be one. The metric was built by Nobel Prize-winning economist Robert Shiller, in collaboration with John Campbell, to do one specific job: forecast long-horizon equity returns over a decade. Predicting crashes was never part of the brief. Investors who have treated it as a crash alarm and acted accordingly have historically paid a steep opportunity cost.
Here is what the CAPE ratio can and cannot tell you, so the next alarming headline does not push you into a decision the metric was never built to support.
What the CAPE ratio actually measures, and what it does not
When you see a CAPE reading in the 40s, you are looking at a single number that compresses a decade of economic history into one ratio. Understanding how that number is constructed is the first step to understanding why it gets misused.
CAPE, the Cyclically Adjusted Price-to-Earnings ratio, is built from three components:
CAPE is one entry in a broader family of stock valuation metrics, and many of the structural limitations it carries, including sensitivity to accounting conventions and the distortion introduced by one-off earnings events, apply in different forms to the P/E ratio and its derivatives as well.
- The current S&P 500 index price
- The average of inflation-adjusted earnings over the prior ten years
- The resulting ratio of price divided by that smoothed earnings figure
The ten-year window is deliberate. It smooths out the distortions of any single business cycle, giving you a cleaner read on how expensive equities are relative to their underlying earnings power across a full economic cycle.
CAPE was designed to forecast long-horizon returns, not to time market peaks.
That distinction is foundational. Campbell and Shiller demonstrated a strong negative correlation (approximately -0.57) between CAPE and subsequent 10-year real equity returns. When CAPE is high, the next decade of real returns has historically tended to be lower than average. When CAPE is low, the next decade has tended to be stronger.
The long-run CAPE median sits at roughly 16-18 since the mid-1920s. Today’s reading in the low 40s, approximately 41-42 as of mid-to-late August 2026, places the ratio in the 98th-99th percentile of all historical readings.
What that tells you is straightforward: decade-ahead real equity returns from this starting valuation have historically been lower than average. What it does not tell you is when, or whether, a crash is coming.
When big ASX news breaks, our subscribers know first
Three structural flaws that disqualify CAPE as a crash predictor
The case against CAPE as a market-timing tool is not a matter of one weakness. Three structural flaws, baked into the metric’s architecture, compound to make it unreliable for the purpose most headlines assign it. Each one matters individually. Together, they are disqualifying.
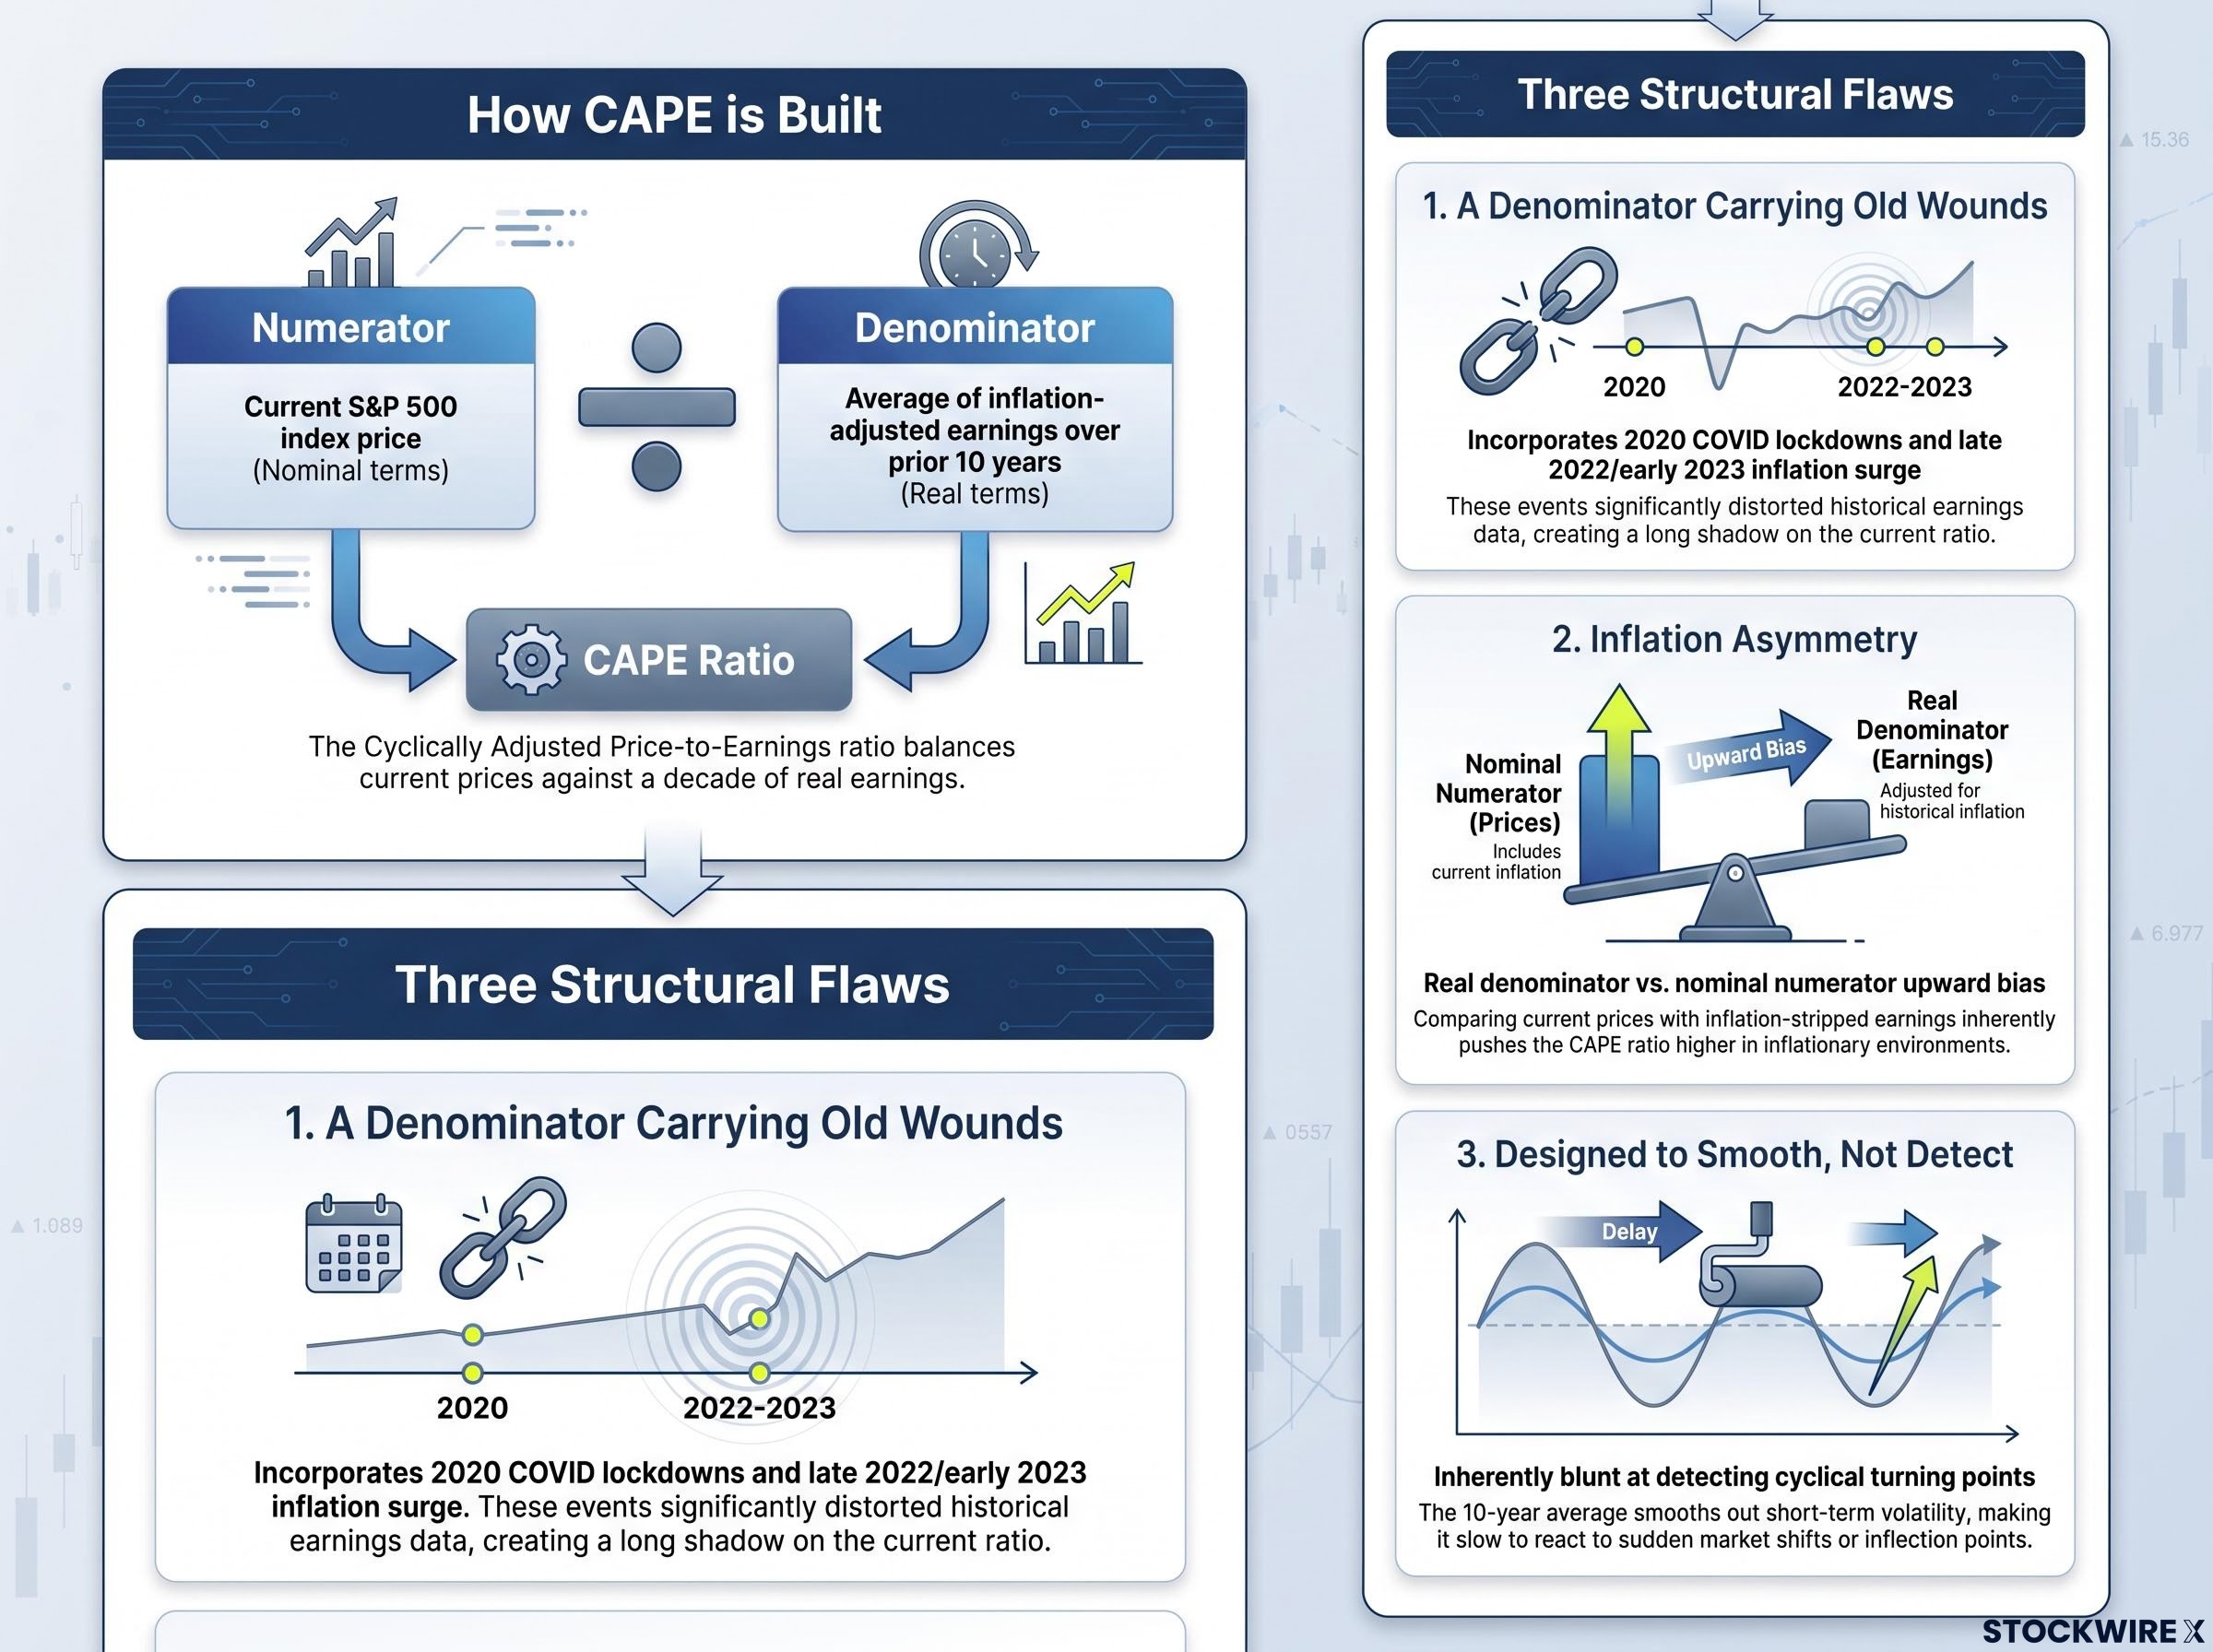
A denominator carrying old wounds
CAPE’s ten-year earnings window was designed to span a typical business cycle. The problem is that the current window happens to include two unusually severe earnings distortions that no longer reflect economic reality.
The earnings collapse triggered by 2020‘s COVID lockdowns remains embedded in the denominator, as does the profit weakness that followed the inflation surge of late 2022 and early 2023. Those episodes have ended and their underlying causes have long since faded, yet CAPE’s rearward-looking construction continues to incorporate them, dragging the denominator lower and inflating the ratio beyond what a present-focused valuation would show. Equity markets, by contrast, price in anticipated earnings over a 3-to-30-month horizon, so figures from a decade ago carry virtually no weight in today’s pricing.
Inflation asymmetry
CAPE adjusts historical earnings for inflation. It does not adjust the current index price. This is a design choice, not an error; the real-earnings framework deliberately filters out inflation noise across the decade. But the asymmetry introduces a systematic upward bias.
The denominator is stated in real terms. The numerator is stated in nominal terms. The result is a ratio that makes equities appear more expensive than a fully consistent real-versus-real comparison would suggest.
Designed to smooth, not to detect
This is the structural flaw that matters most. CAPE was engineered to smooth earnings cycles. Because it is built to smooth, it is inherently blunt at detecting cyclical turning points. You cannot build a tool whose purpose is averaging out the bumps and then repurpose it for identifying the precise moment the road drops away.
If the denominator is being held down by earnings from crises that are now resolved, the ratio reads artificially high. The alarm bells triggered by today’s CAPE may be partly an artefact of how the metric is constructed, not a pure reflection of current market conditions.
What a century of bear markets actually shows about CAPE
The theoretical case against CAPE as a crash predictor is strong. The historical data makes it conclusive.
Looking back across more than a century of market history, no single CAPE level has reliably or consistently marked the start of a bear market, nor has any reading been a dependable guide to how severe the subsequent decline would be. Downturns in 1946, 1980, 1987, and 1990 all got underway while CAPE was tracking below its long-run median, undermining any claim that an elevated reading is even a necessary condition for a bear market to begin.
Among bear markets that did begin above the median, the dispersion of CAPE readings at onset is wide enough to make the metric useless as a trigger signal. The three highest readings at bear market onset were 43.53 (March 2000), 36.94 (January 2022), and 32.56 (September 1929).
| Bear market start | CAPE at onset | Vs. long-run median | Peak-to-trough decline | Primary cause |
|---|---|---|---|---|
| March 1937 | 22.04 | Above | ~60% over five years | Fiscal tightening, recession |
| October 1987 | Below median | Below | ~34% | Portfolio insurance, programme trading |
| July 1990 | Below median | Below | ~20% | Iraq invasion of Kuwait, oil shock |
| March 2000 | 43.53 | Above | ~49% | Dot-com bubble burst |
| February 2020 | Above median | Above | ~34% | COVID-19 shutdowns |
| January 2022 | 36.94 | Above | ~25% | Rate hikes, speculative excess (SPACs) |
The 1937 bear market is particularly instructive. CAPE stood at a comparatively modest 22.04, yet equities declined approximately 60% over the subsequent five years. CAPE level and decline severity are not reliably correlated.
CAPE surpassed its 1929 peak level in early 2018, per Multpl.com, yet the 2010s produced strong equity returns overall.
Recent bear markets reinforce the disconnect. The 2018 decline was driven by forced liquidations from hedge funds facing redemptions; valuation appears to have played little direct role. The 2020 bear market resulted from COVID shutdowns. The 2022 downturn involved speculative excess concentrated in SPACs and niche segments that would not have been visible through S&P 500 CAPE readings.
The pattern across more than a century of data tells you that a high CAPE number, taken alone, gives you no reliable information about whether or when a bear market will arrive, or how severe it will be.
Composite valuation models that blend CAPE with household equity exposure, savings rates, and credit conditions have historically captured more of the bear market signal than any single ratio, and BCA Research’s MacroQuant framework is a current example of that multi-factor approach approaching a meaningful threshold.
The Greenspan warning that cost investors three years of gains
Theory and data make the case. The Greenspan episode makes it personal.
On 5 December 1996, Fed Chairman Alan Greenspan gave his now-celebrated address questioning whether investor “irrational exuberance” had driven asset values beyond what fundamentals justified. According to Robert Shiller’s account in Irrational Exuberance (Princeton Press, 2000), Shiller had briefed Greenspan on CAPE just two days earlier, in November 1996, making the valuation framework a clear influence on the speech.
This was not a fringe warning. It came from the most powerful central banker in the world, armed with the analytical framework that would later win its creator a Nobel Prize. Markets reacted immediately.
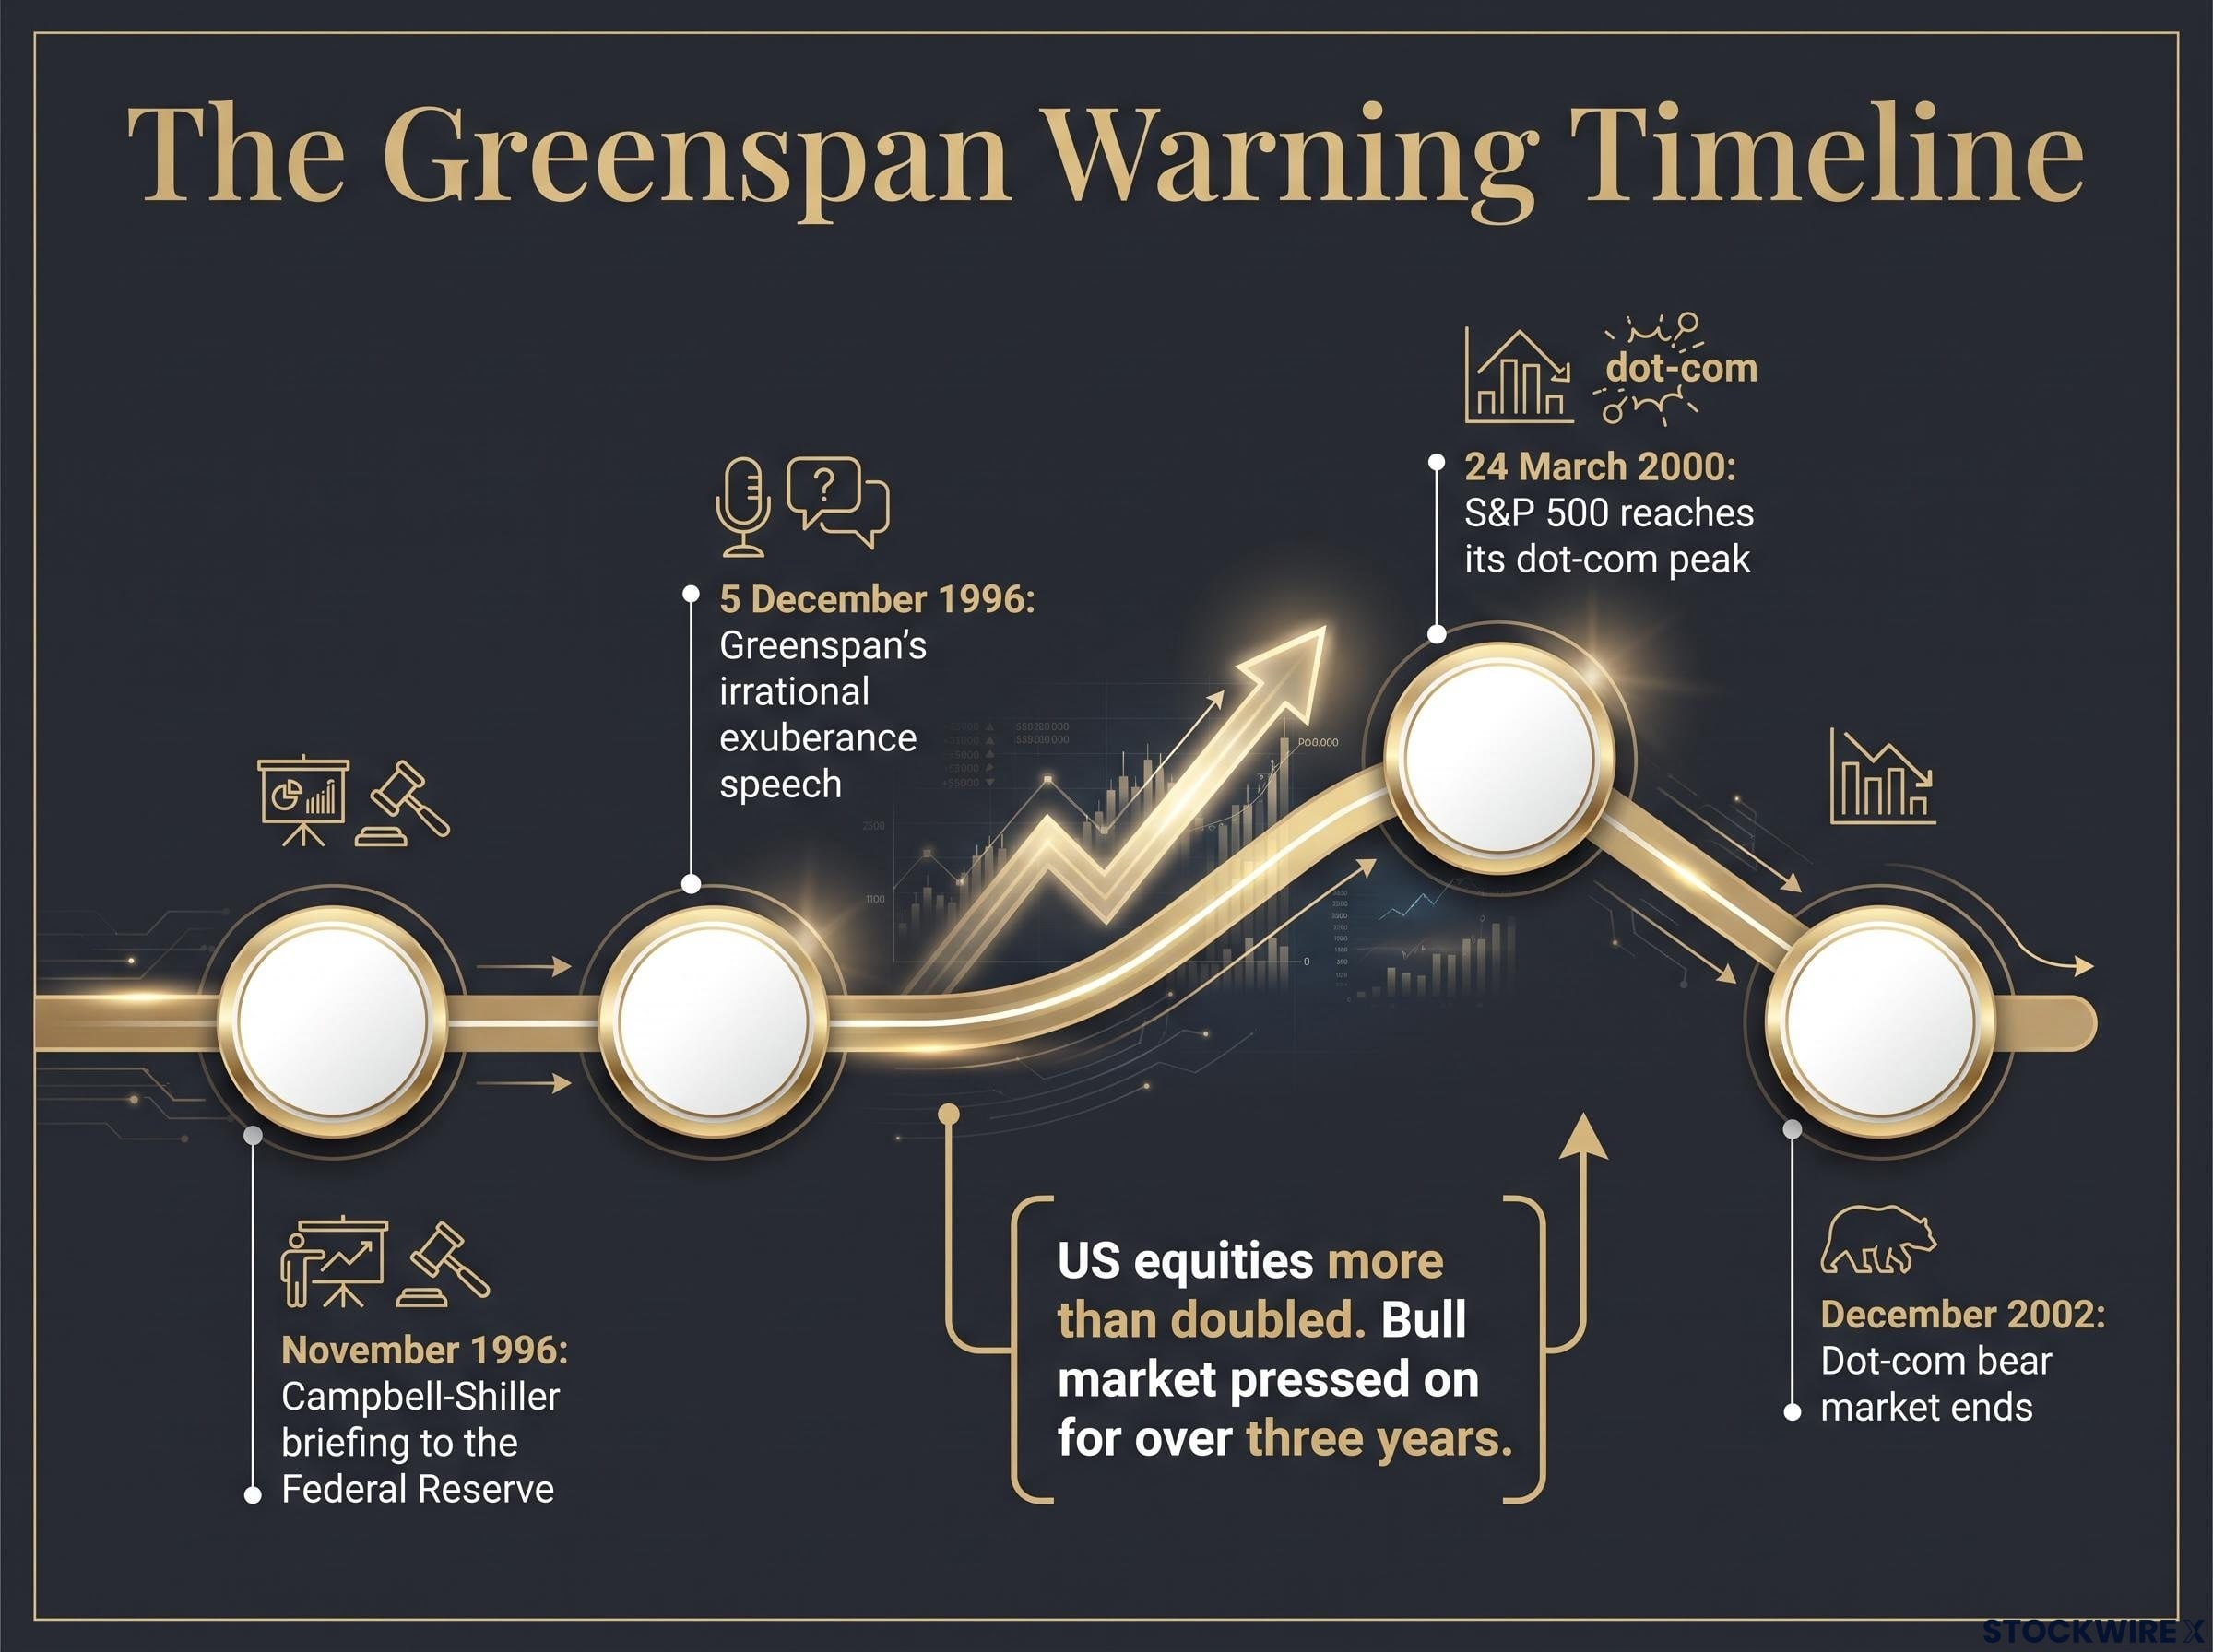
- November 1996: Campbell-Shiller briefing to the Federal Reserve
- 5 December 1996: Greenspan’s “irrational exuberance” speech
- 24 March 2000: S&P 500 reaches its dot-com peak
- December 2002: Dot-com bear market ends
Between Greenspan’s speech on 5 December 1996 and the S&P 500’s eventual peak on 24 March 2000, US equities more than doubled in value, per FactSet, with the bull market pressing on for well over three further years before finally turning.
More than three years of bull market gains remained after the most credible valuation warning of the twentieth century.
Investors who exited equities in response to Greenspan’s remarks missed that entire run. The signal was real in a long-horizon sense; CAPE was genuinely elevated. But acting on it as a crash alarm cost investors dearly, because CAPE has no demonstrated ability to time the endpoint of a bull market.
If even the Federal Reserve chairman, armed with the framework’s own creators, could not translate an elevated CAPE reading into a usable market-exit signal, you should treat any current CAPE-based crash warning with the same scepticism.
What CAPE legitimately tells you about returns, and how to use it
CAPE is not a broken tool. It is a misapplied one. Used for the job it was designed to do, it remains a legitimate and well-supported input to long-term financial planning.
The Campbell-Shiller framework identifies a strong negative correlation (approximately -0.57) between CAPE and subsequent 10-year real equity returns. That signal is real, well-documented, and worth incorporating into your planning. Today’s elevated reading in the low 40s implies that decade-ahead real returns are likely to be somewhat lower than the long-run historical average. The dot-com era is the clearest historical example where extremely elevated CAPE correctly signalled poor subsequent long-run returns, and that directional signal is meaningful.
Research on CAPE near 40 and decade-ahead returns points to below-average real equity performance over the following ten years, with profit margin normalisation adding a second layer of downside risk on top of the valuation signal alone.
The distinction lies in what you do with it. Two uses of CAPE are supported by the evidence, and two are not.
- What CAPE can do:
- Calibrate your long-term return assumptions, for example, whether to plan around 5-6% versus 8-9% real equity returns over the next decade
- Manage your expectations about future performance relative to the recent past
- What CAPE should not do:
- Drive market-exit decisions or wholesale shifts in equity exposure based on a single elevated reading
- Inform tactical asset allocation changes or short-term positioning
For a long-horizon investor, today’s elevated CAPE is most usefully read as a reason to temper your 10-year return expectations and stress-test your financial plan against lower-return scenarios. It is not a reason to move to cash.
What today’s elevated reading actually warrants from investors
If you are encountering CAPE-in-the-40s warnings in financial media, the most evidence-supported inference is not “a crash is imminent.” It is “long-term equity returns from here may be lower than they have been historically.”
That is a meaningful difference, and it calls for a proportionate response.
CAPE at its current reading does carry a directional signal about decade-ahead returns, and that signal is worth incorporating into your financial planning. Sentiment in certain corners of US equity markets has grown notably warm, and the present bull market appears to be in its more mature phase. That said, a bull market’s mature phase can run far longer than most observers expect, and CAPE offers no dependable guidance on when the cycle will turn.
The proportionate response involves three actions:
- Temper your long-run return assumptions. If your financial plan assumes 8-9% real equity returns indefinitely, stress-test it against 5-6%.
- Maintain disciplined diversification. A high CAPE reading does not tell you when to exit equities; it tells you that broad diversification matters more when starting valuations are elevated.
- Stress-test your financial plan against a lower-return environment. If your retirement or accumulation plan still works with decade-ahead returns below historical averages, you are positioned appropriately.
An elevated CAPE in the 40s warrants adjusting your return expectations, not abandoning your equity allocation.
Your time horizon determines what CAPE means for you. If you are investing for the next ten-plus years, it is a reason to adjust your assumptions, not your allocation. If you are speculating on short-term moves, CAPE provides no useful guidance at all.
For investors wanting to understand what the evidence-backed alternative to CAPE-based market timing actually looks like in practice, our dedicated guide to CAPE timing versus rebalancing examines more than a century of backtested data showing how tolerance-band rebalancing consistently outperforms valuation-trigger strategies.
This article is for informational purposes only and should not be considered financial advice. Investors should conduct their own research and consult with financial professionals before making investment decisions. Past performance does not guarantee future results. Financial projections are subject to market conditions and various risk factors.