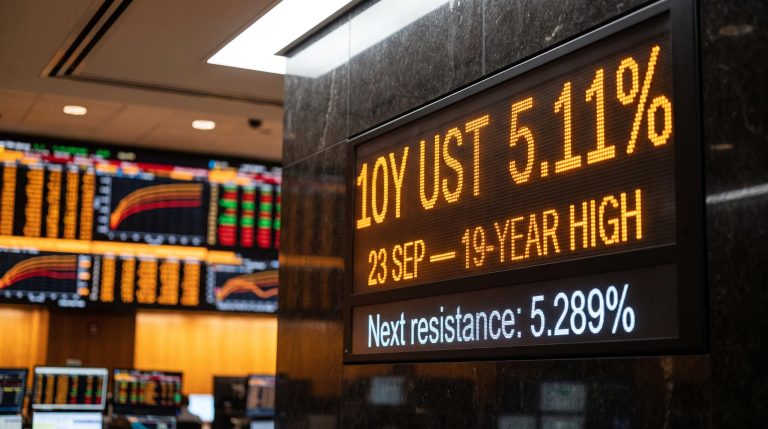
Market expectations of an imminent pause in global monetary policy have collided with reality. Long-dated US Treasury yields have breached levels last seen more than two decades ago, and the pause that so many portfolios were built around is nowhere in sight.
Central bankers in Washington and London are doing something the consensus did not price for. Both are explicitly leaving the door open to further tightening before the end of 2026, and they are doing it at the same time. That coordination matters, because it drains global liquidity from two directions at once.
The result is a discount rate environment that quietly reprices everything: equities, credit, and the assumptions underneath both. When the Fed and Bank of England rate hikes stay live simultaneously, the higher-for-longer regime stops being a US story and becomes a transatlantic one.
This analysis lays out a framework for reading that shift. After it, you will know how synchronised tightening alters the way future cash flows are valued, and where the hidden vulnerabilities sit in equity and credit allocations that most investors are still treating as safe.
Coordinated hawkishness across the Atlantic
The signals arrived within days of each other, and that is what makes them dangerous to ignore.
On 24 September 2026, New York Fed President John Williams told markets that another increase before year-end was firmly on the table. He noted that investors were already pricing that outcome and described their read as reasonable, while stressing that the Fed would follow incoming data rather than lock into forward guidance.
“It’s reasonable to expect another rate hike by the end of the year,” said John Williams, President of the Federal Reserve Bank of New York.
That comment did not land in isolation. The federal funds target range already sits at 3.75% to 4.00%, raised the week before Williams spoke, and futures markets are now pricing roughly a 75% to 77.5% probability of a further hike in October. This is not a central bank winding down. It is one leaving itself room to push further.
The Fed’s September 2026 unanimously-voted hike to 3.75%-4.00% also introduced a monetarist policy framework that tracks Divisia M4 money supply growth alongside rate signals, a shift in analytical lens that changes which leading indicators investors should prioritise when reading Fed intent.
Across the Atlantic, the Bank of England delivered the same message through a different mechanism. At its meeting ending 16 September 2026, the Monetary Policy Committee held Bank Rate at 3.75%, but the vote split 6 to 3. Three members, external voices Megan Greene and Catherine Mann alongside chief economist Huw Pill, wanted an immediate hike to 4.00%.
A divided vote like that is a signal in itself. Deputy Governor Clare Lombardelli voted to hold but warned that the case for raising rates was building the longer inflation risks persisted without resolution.
| Institution | Current Rate | Near-Term Forward Guidance |
|---|---|---|
| US Federal Reserve | 3.75% to 4.00% | Williams calls a further year-end hike “reasonable”; markets price ~75-77.5% odds of an October move |
| Bank of England | 3.75% | Held on a 6-3 vote; hawkish minority pushing for an immediate hike to 4.00% |
Read separately, each is a domestic policy decision. Read together, they are a dual engine of tightening. The coordinated nature of these signals tells you that global liquidity will contract faster than any single-country view would suggest, and it means you have to evaluate your portfolio against one unified higher-for-longer regime, not two national ones running on their own clocks.
When big ASX news breaks, our subscribers know first
The underlying mechanics of the multi-decade yield surge
Here is the part that confuses most investors: headline inflation has been cooling, yet long-dated yields keep climbing. On 24 September 2026, the 10-year US Treasury yield traded around 5.12% to 5.18%, and the 30-year pushed to 5.41% to 5.45%, the highest levels since 2004.
If inflation is falling, why are bonds selling off? Because two separate forces drive long-dated yields, and only one of them is about inflation.
The first is policy rate expectations. When markets believe the Fed and BoE will keep rates higher for longer, the expected path of short rates rises, and long yields rise with it. That part is straightforward.
The second is the term premium, and this is where the real story sits. The term premium is the extra compensation investors demand for holding a long-dated bond rather than rolling short ones, to cover the risk that rates or inflation move unexpectedly over that longer horizon.
According to research from the Bank for International Settlements (BIS) and analysis in the IMF’s Global Financial Stability Reports, that premium is normalising upward from the abnormally compressed levels of the quantitative easing era, the period when central banks bought bonds in bulk to hold yields down. Several structural drivers are lifting it:
- Heavy sovereign debt supply, as large fiscal deficits flood the market with new Treasuries that need buyers
- Reduced central bank buying, as quantitative tightening removes the largest price-insensitive purchaser from the market
- Heightened macroeconomic uncertainty, which raises the compensation investors demand for locking up capital in duration
That distinction is not academic. If yields were rising purely on inflation fears, a cooling inflation print would bring relief. But a structural term premium does not respond to a single soft data release.
This is the point you need to sit with. Long-term yields can stay elevated on term premium alone, even as headline inflation falls, which means the relief your bond allocations are waiting for may simply not arrive on the schedule the consensus assumes.
The ACM model estimates the US 10-year term premium at 70-80 basis points in mid-to-late 2026, a structural swing of roughly 220-230 basis points from negative 150 basis points in March 2020, and term premium dynamics of that magnitude have historically persisted well beyond the rate cycle that triggered them.
How tightening transmission fractures risk assets
Higher government yields do not stay in the bond market. They travel, and where they land is corporate valuations and credit.
The transmission runs through three main channels:
- Higher discount rates compress equity multiples, because future earnings are worth less in present terms when the risk-free rate climbs. Long-duration growth stocks feel this most.
- Tighter financial conditions widen credit spreads, forcing leveraged borrowers to refinance at materially higher coupons and lifting default risk across weaker balance sheets.
- Cross-border capital flows tighten simultaneously, because when both the Fed and BoE are hawkish, dollar and sterling funding conditions squeeze at the same time.
That third channel is the one a single-country analysis misses entirely. The IMF’s Global Financial Stability Report has warned that non-bank financial intermediaries, such as open-ended funds and leveraged investors, are exposed to margin calls and funding stress when prices adjust abruptly. Coordinated tightening amplifies exactly that risk.
Now look at what the equity market is actually telling you. On 24 September 2026, the cap-weighted S&P 500 closed essentially flat at -0.02%. The equal-weighted version, which strips out the dominance of the largest names, fell 0.50%.
Global equity fund outflows of approximately $23 billion in the single week to 16 September 2026, the largest over a nine-month period, confirm that institutional capital is already repositioning rather than waiting for the discount rate environment to deteriorate further.
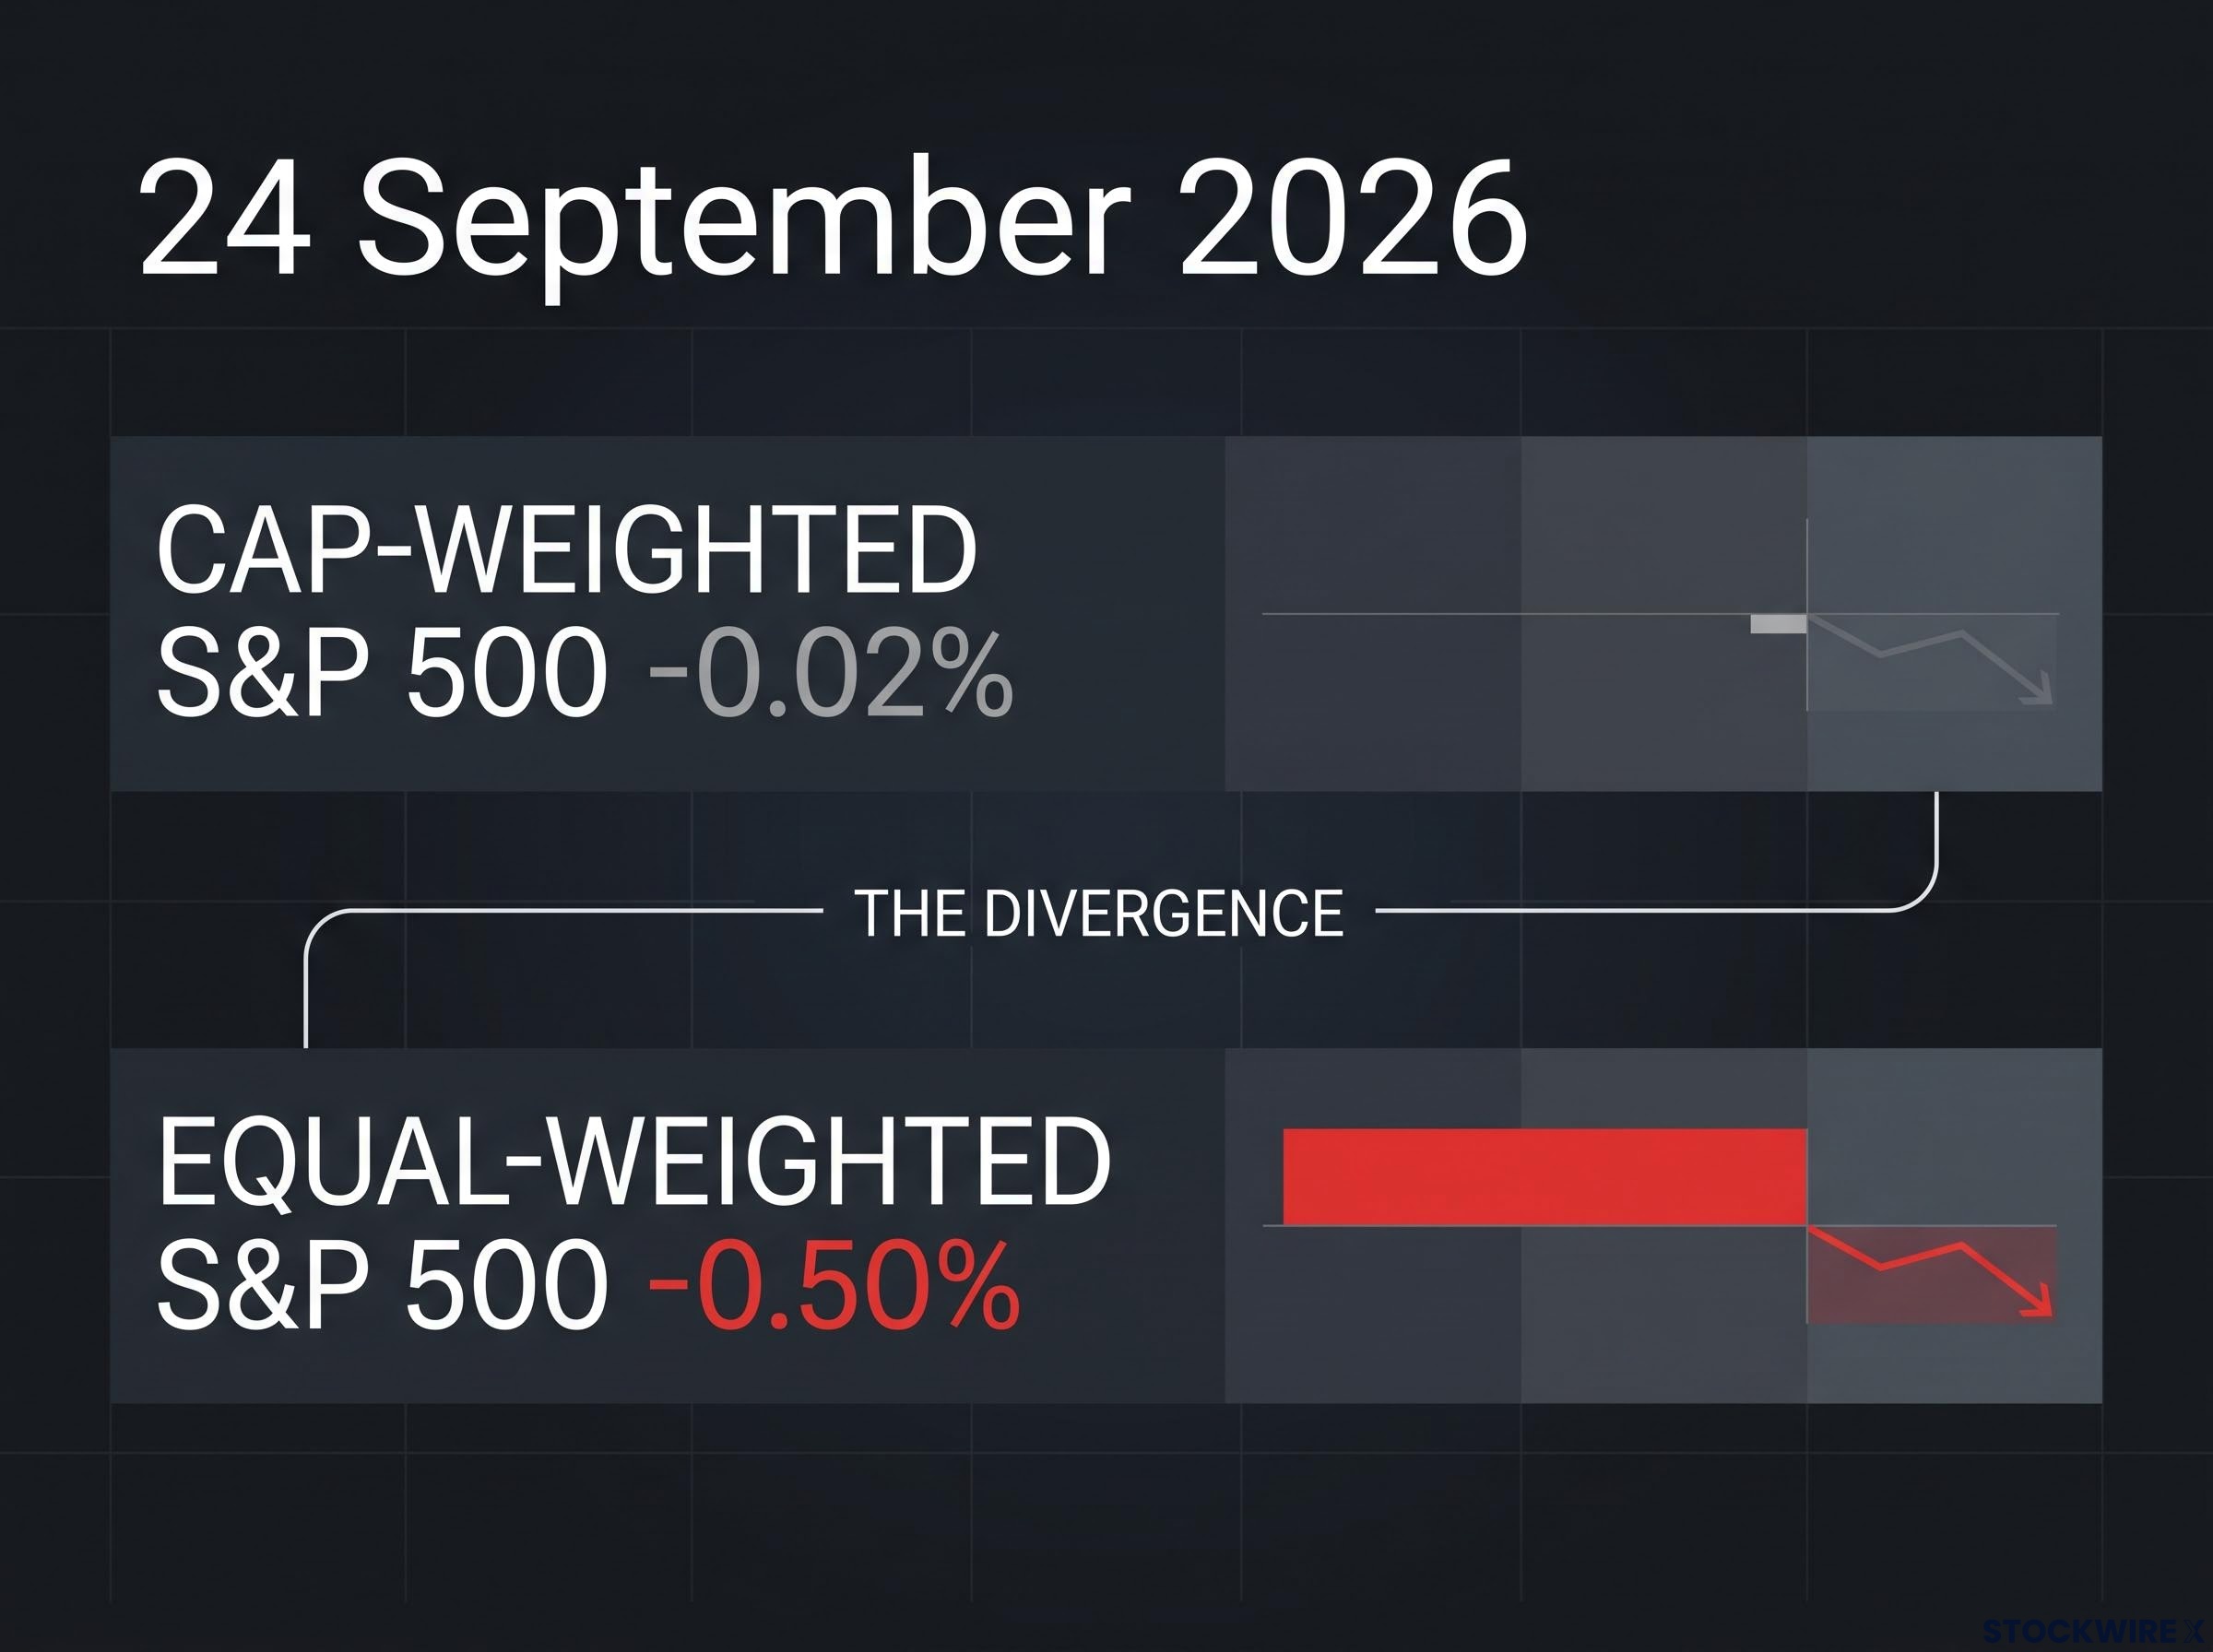
That gap is the whole story. A handful of mega-cap stocks are holding the headline index up while the broader market weakens beneath it.
The divergence between cap-weighted and equal-weighted performance signals that surface-level equity resilience is a mirage. It means you cannot take a flat index as reassurance. You have to look through it, into the specific refinancing risks and duration exposure of your individual holdings, because the average stock is already feeling the squeeze the headline number hides.
The geopolitical counterweight
One factor is currently softening the blow, and it is worth understanding precisely because it is temporary.
Reports of phased diplomatic discussions between the US and Iran, aimed at reopening the Strait of Hormuz, were cited during the same 24 September session as a mitigating factor against a more severe bond-driven equity rout. Easing energy supply fears provide technical support for equities, offsetting some of the pressure from rising yields.
But this is external support, not internal strength. A diplomatic development can reverse in a single headline, and when it does, the cushion it provides disappears with it, leaving the underlying yield pressure fully exposed.
Applying historical stress tests to modern portfolios
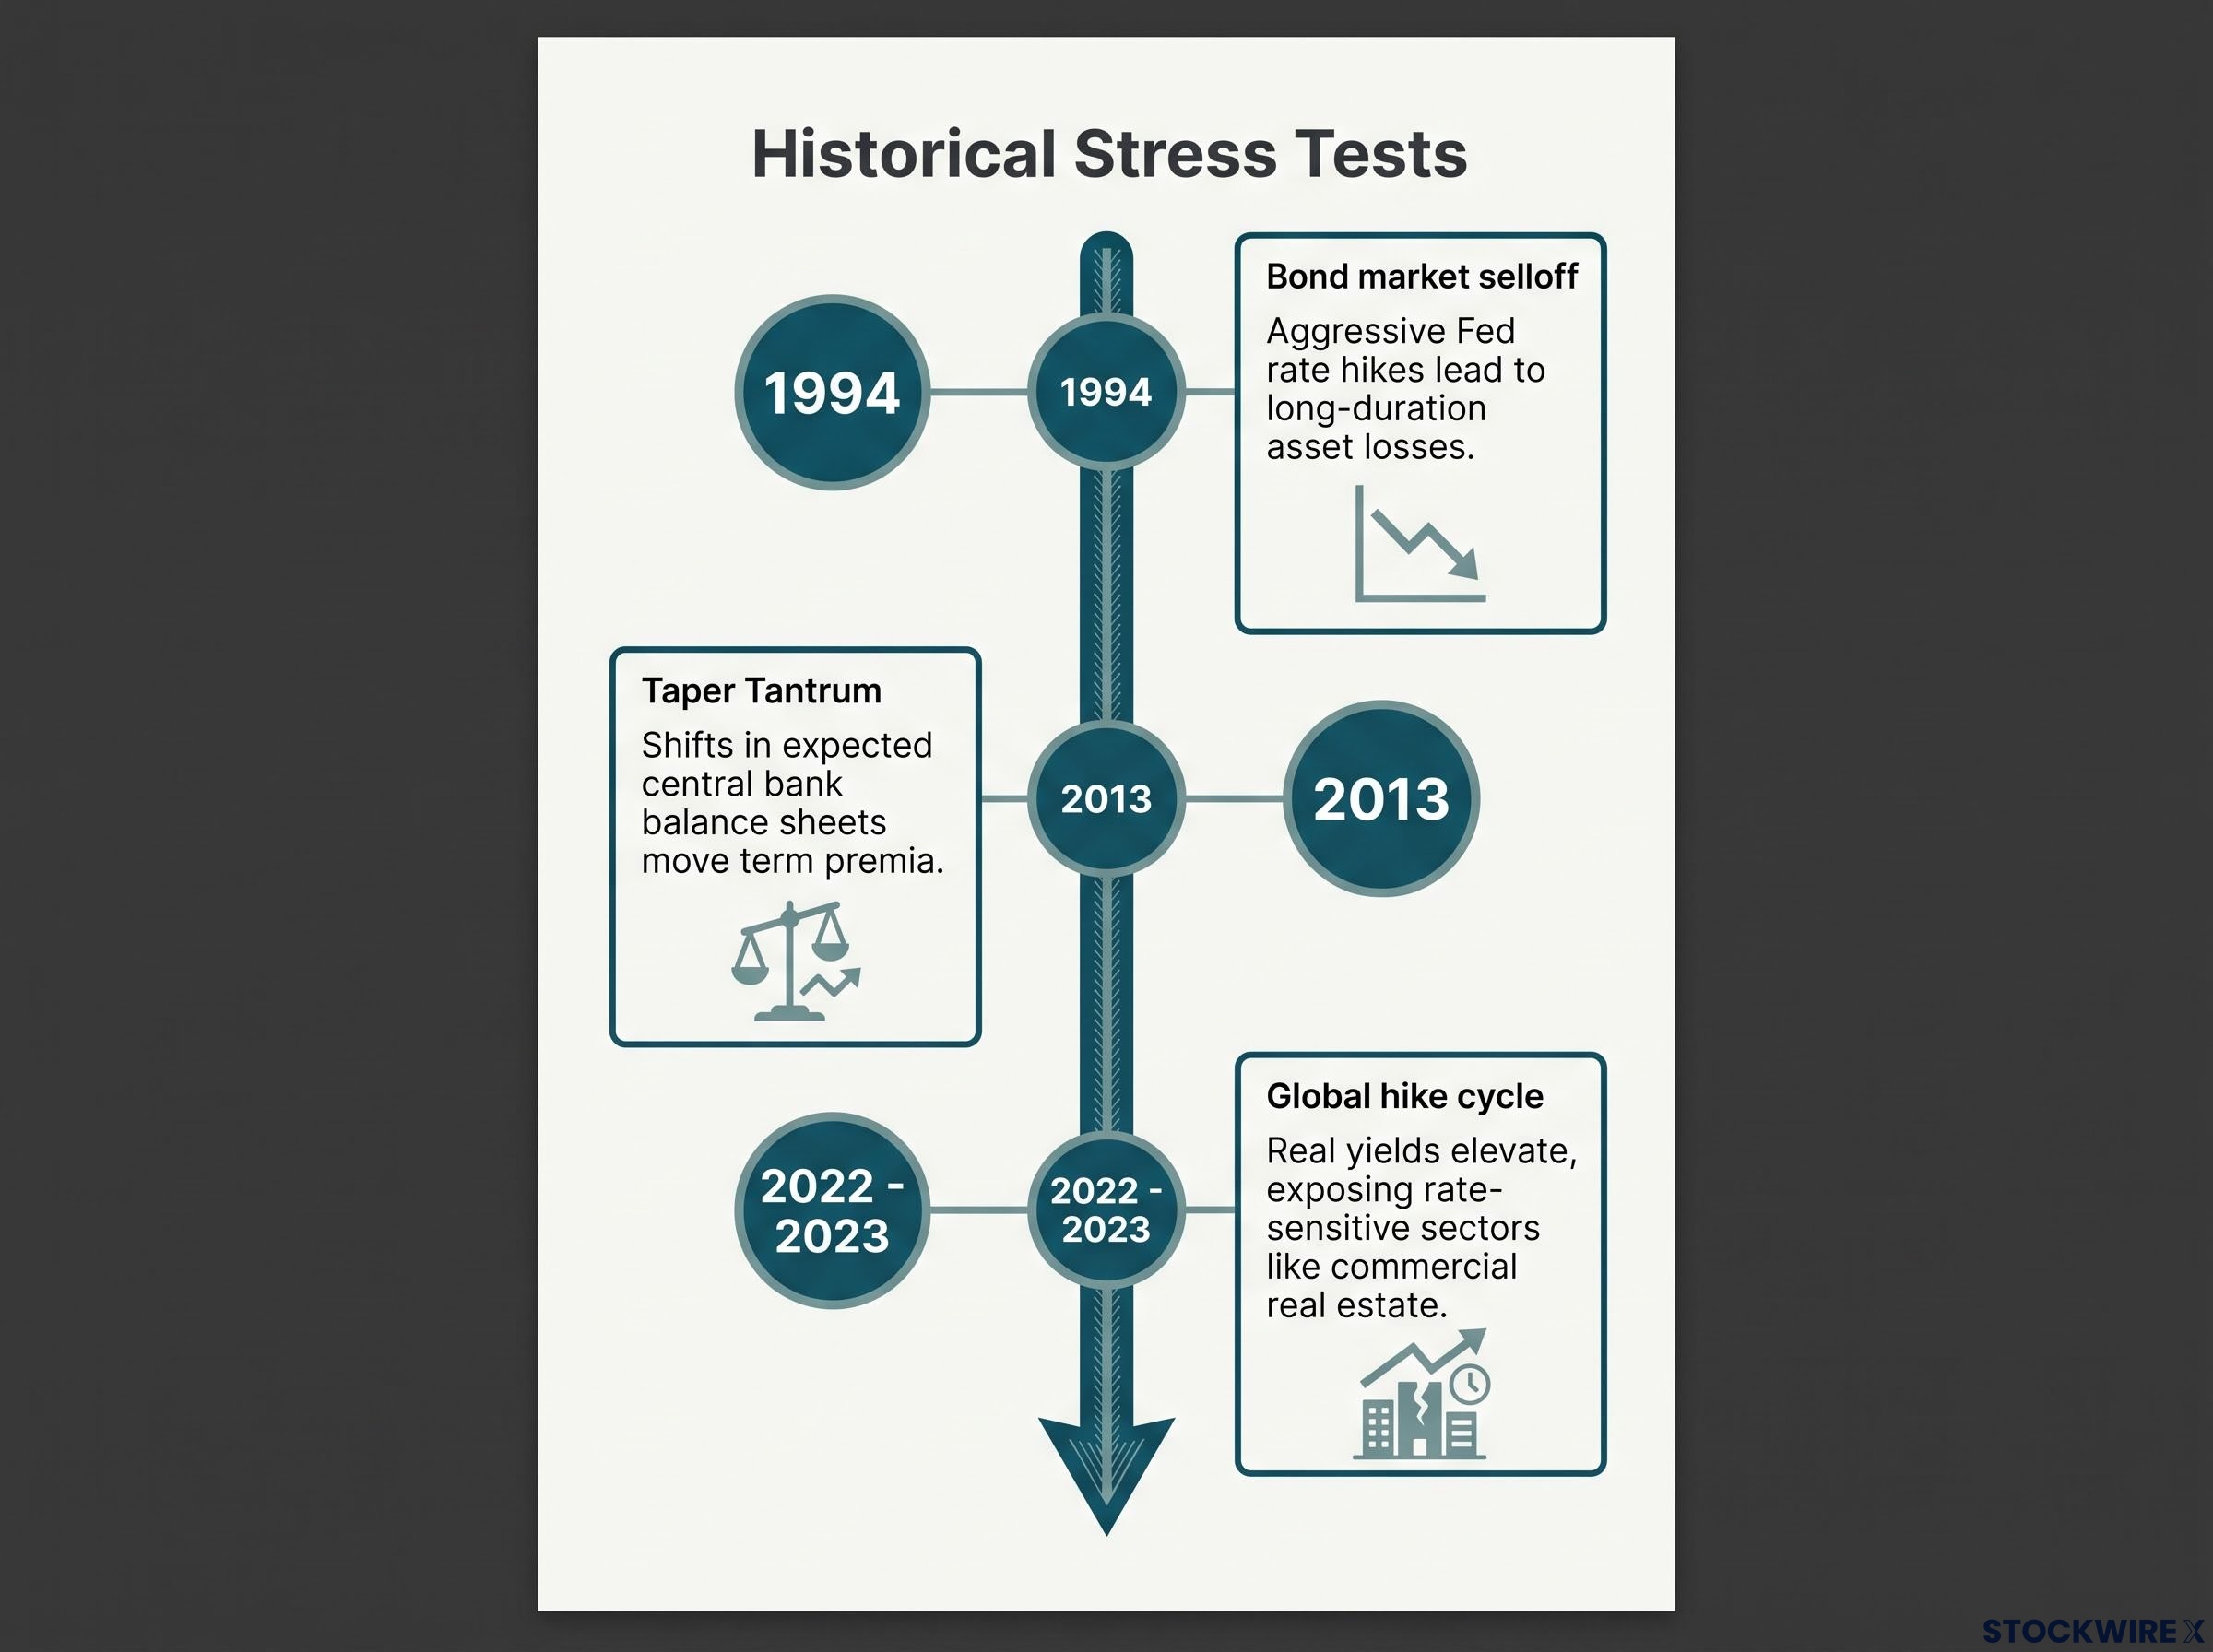
The current setup is not unprecedented. Three past episodes map onto it, and each carries a specific warning.
The 1994 bond market selloff is the sharpest parallel. The Fed raised rates aggressively, and long-duration bonds and rate-sensitive equities suffered outsized losses, even though the wider economy stayed relatively healthy.
Historical analysis from the IMF and BIS shows that a sudden repricing of the expected rate path can inflict severe losses on long-duration assets, even when the broader macroeconomic backdrop appears stable. Duration and leverage are what break first.
The 2013 taper tantrum adds a second lesson. It demonstrated that shifts in the expected path of central bank balance sheets, not just policy rates, can move term premia and yields sharply, which is exactly why quantitative tightening commentary matters as much as rate guidance today.
The 2022 to 2023 global hike cycle is the freshest reference point. It showed that equity and credit can absorb higher rates while earnings hold up, but valuation compression eventually sets in if real yields stay elevated, and rate-sensitive sectors like commercial real estate carry the most exposure.
Bank of England Deputy Governor Sarah Breeden has stressed that financial conditions have already tightened significantly. That lag effect is the danger: the full weight of tightening lands on debt-servicing burdens well after the hikes themselves.
The lesson history keeps repeating is that valuation compression eventually breaks heavily indebted structures. It means you should stress-test your portfolio for a prolonged period of high refinancing costs, rather than positioning for a pivot that policymakers have not signalled.
Positioning for a sustained high-cost capital regime
The core threat is the combination. Coordinated Fed and BoE tightening is lifting policy rate expectations at the same moment structural forces are pushing the term premium higher, and those two pressures compound rather than cancel.
For the quarter ahead, the metric that matters most is whether the hawkish minority becomes the majority. Watch the BoE vote split for any drift beyond 6 to 3, and watch whether the Fed converts its priced-in October odds into an actual move.
Your mandate is straightforward. Review duration exposure across your bond allocations, and scrutinise the balance sheet quality and refinancing schedules of every leveraged holding, because those are the positions that break first when high-cost capital persists.
For investors wanting a systematic method to measure those exposures before conditions deteriorate further, our dedicated guide to portfolio risk management walks through beta-weighted position sizing and volatility targeting with a six-step rebalancing workflow.
This article is for informational purposes only and should not be considered financial advice. Investors should conduct their own research and consult with financial professionals before making investment decisions.
Past performance does not guarantee future results, and financial projections are subject to market conditions and various risk factors. Forward-looking statements about central bank policy are speculative and subject to change based on incoming data and market developments.