The MSCI USA Industrials Index has delivered a 10-year annualised return of 10.11%, yet most retail investors bypass the sector entirely in favour of technology or consumer growth names. The industrial goods sector is one of the broadest in the U.S. market, spanning aerospace and defence, machinery, construction, waste management, freight, and automation. Its cyclical nature makes entry timing as important as vehicle selection, and the current environment features active debate among major institutions about where specific subsectors sit in the growth cycle. This guide walks through what investing in industrials actually involves: sector composition, cycle timing frameworks, live ETF benchmark data, company-specific risks inside broad funds, and the structural trends extending the long-term case regardless of short-cycle noise.
What the industrial goods sector actually contains
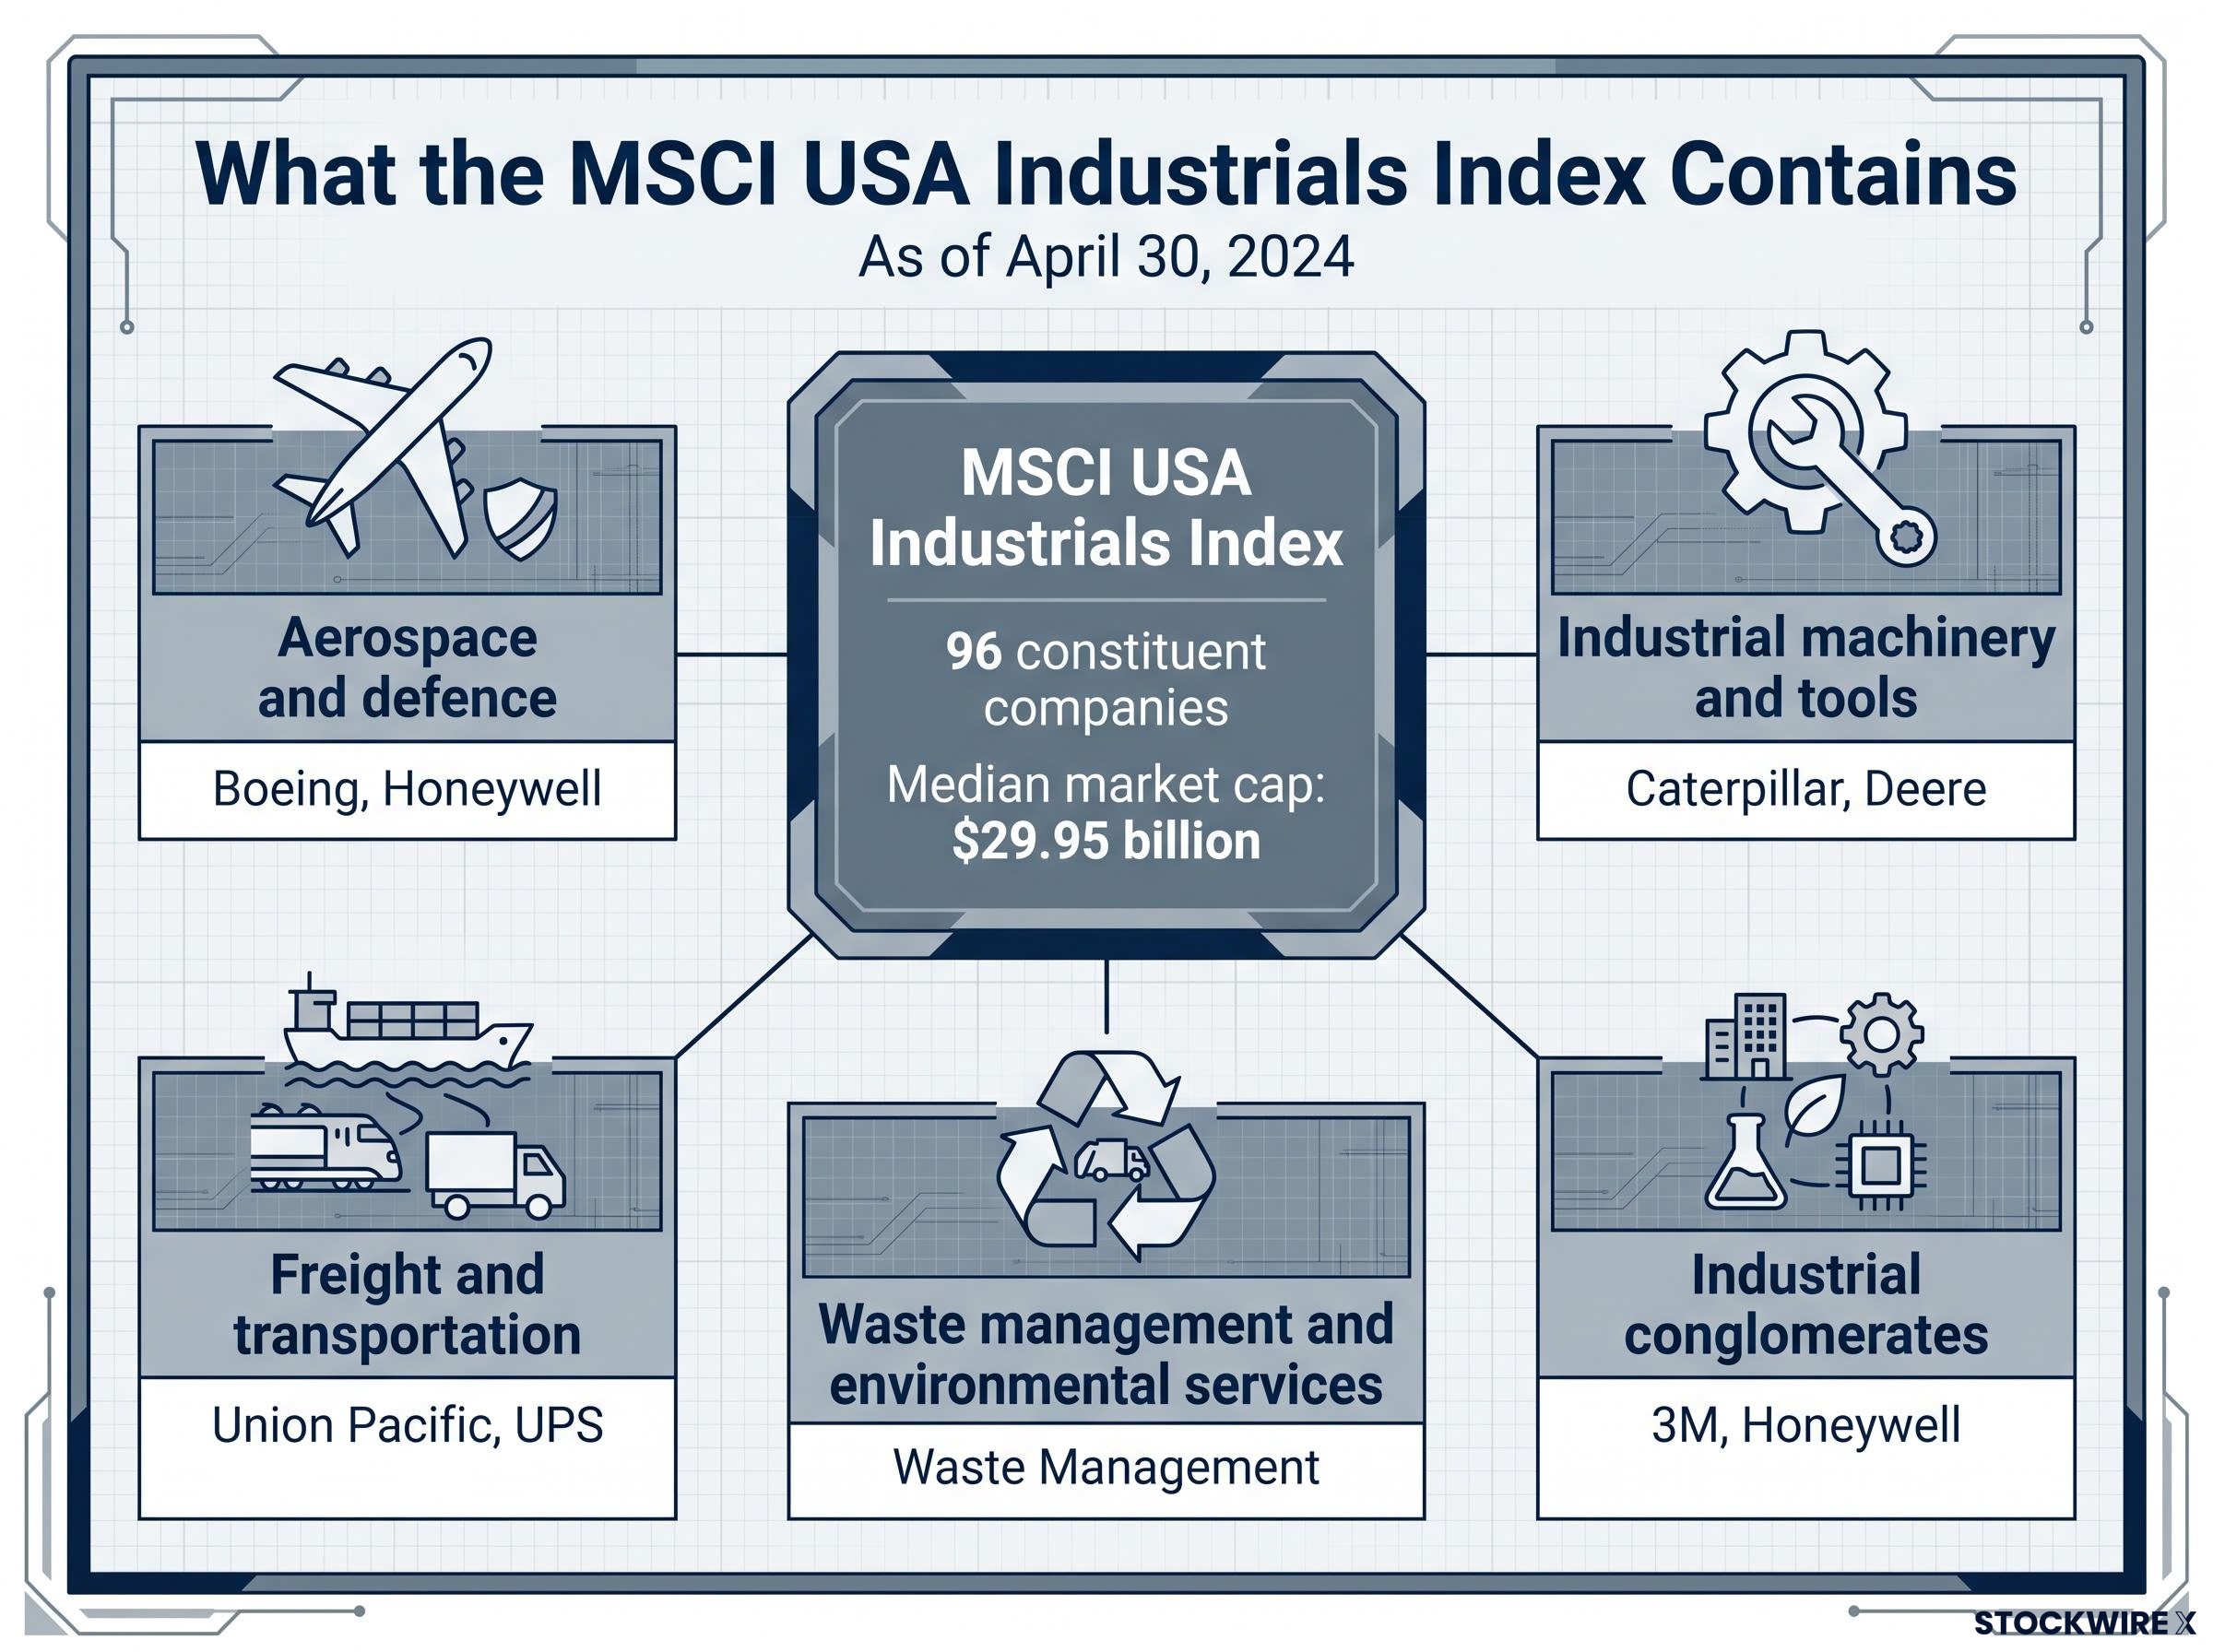
The word “industrials” suggests factories and heavy equipment. The reality is far broader. The sector encompasses companies building aircraft, hauling freight across continents, managing landfills, automating warehouses, and pouring the concrete that holds infrastructure together. As of April 30, 2024, the MSCI USA Industrials Index comprised 96 constituent companies with a median market capitalisation of $29.95 billion, according to MSCI data.
The major subsectors include:
- Aerospace and defence: Commercial aircraft manufacturing, military systems, and avionics (Boeing, Honeywell)
- Industrial machinery and tools: Heavy equipment for construction, mining, and agriculture (Caterpillar, Deere)
- Construction and engineering: Infrastructure development, building products, and cement
- Waste management and environmental services: Collection, recycling, and disposal operations (Waste Management)
- Freight and transportation: Rail networks, trucking, and logistics (Union Pacific, UPS)
- Industrial conglomerates: Diversified manufacturers across multiple industrial end markets (3M, Honeywell)
- Manufactured housing and lumber production: Residential and commercial building materials
- Industrial automation and robotics: Factory systems, process controls, and software-enabled manufacturing
Consistent revenue generators vs. highly cyclical plays
Not all subsectors move in lockstep. Waste management and industrial conglomerates tend to generate more consistent revenues, benefiting from recurring contracts, pricing power, and relatively stable demand. S&P Global Market Intelligence has labelled solid waste firms “defensive compounders” with strong volumes across economic conditions.
Aerospace backlogs, homebuilding, and freight sit at the other end. These subsectors experience extended bullish expansions lasting multiple years before reversing sharply. A broad industrial ETF holds both profiles simultaneously, and knowing that distinction shapes how an investor should size and time a position.
When big ASX news breaks, our subscribers know first
Understanding the industrial growth cycle before you invest
The industrial sector moves through four distinct growth phases, and recognising which phase a subsector occupies determines whether adding exposure is well-timed or poorly positioned. These phases function as a diagnostic tool rather than a precise calendar.
- Accelerating growth: Order books expand, revenue growth rates increase quarter over quarter, and valuations rise as the market prices in further upside.
- Decelerating growth: Growth continues but at a slowing pace. Earnings beats narrow, and valuations begin to compress.
- Accelerating decline: Revenue contracts at a widening rate. Margins deteriorate and capital spending is pulled back.
- Decelerating decline: The contraction slows. Orders stabilise, and early signs of recovery begin to appear.
Firms in the accelerating growth or decelerating decline phases tend to attract higher valuations because of their perceived trajectory. The practical question for investors is where the sector, and each subsector within it, currently sits.

Analyst reports from late 2024 through mid-2025 broadly characterise U.S. industrials as mid-cycle to early-upturn, with subsector divergence being the most important detail. BlackRock Investment Institute described conditions in January 2025 as a “mid-cycle soft landing scenario,” favouring industrial automation and infrastructure-linked names while calling cyclical transportation “selective opportunities.” Morgan Stanley, in November 2024, placed construction and machinery as early-to-mid-cycle beneficiaries, while global freight remained in “late-cycle normalisation.”
Goldman Sachs Research stated in September 2024 that U.S. industrials were “transitioning from a mini-industrial recession in 2023 into an early-cycle upturn,” with aerospace and defence in structural uptrends and truck freight characterised as late-cycle.
The implication is direct: cycle phase determines not just whether to buy industrials, but which subsectors deserve a larger allocation at any given time.
The four-phase cycle model described here connects directly to a broader sector rotation framework that maps how institutional capital systematically moves between sectors ahead of official economic data confirmation, with Relative Rotation Graphs and fund flow analysis providing real-time signals that reinforce what ISM New Orders data is already suggesting.
How to read cycle indicators as an entry signal
Understanding cycles as a concept is one thing. Knowing what to watch, and when to act, is what converts theory into a usable framework.
The primary leading indicator for timing industrial sector additions is the ISM Manufacturing Index, specifically its New Orders sub-index. A move from below 50 (contraction) back into expansion territory is widely cited as an early-entry signal across multiple institutional frameworks. The Purchasing Managers’ Index (PMI), which measures manufacturing activity through surveys of purchasing managers at private firms, serves the same function.
The ISM New Orders sub-index functions as a diffusion index with leading indicator properties, meaning a sustained move back above the 50-point threshold signals expanding manufacturing activity before that expansion shows up in earnings or revenue data.
The secondary confirmation layer includes credit spreads (narrowing spreads suggest improving corporate health), earnings revisions (upward revisions in industrial names signal improving fundamentals), and capital-spending surveys (rising corporate intentions to invest in equipment and facilities).
The execution approach recommended by Fidelity, BlackRock, and Barron’s converges on one principle: gradual additions around PMI inflection points rather than attempting to call the exact trough.
- Watch ISM/PMI: Monitor the New Orders sub-index for a sustained move back above 50.
- Confirm with secondary indicators: Look for narrowing credit spreads, upward earnings revisions, and improving capital-spending survey data.
- Execute staggered purchases: Dollar-cost average into broad industrial ETFs over several months around the inflection, reducing the consequence of being slightly early or late.
Adjusting subsector tilt by cycle phase
The subsector allocation should shift as the cycle evolves. Charles Schwab, in May 2025, recommended favouring more defensive industrial subsectors (defence, waste management, automation) if late-cycle conditions persist, layering into cyclical names only as leading indicators confirm an upturn.
In practice, this means: during late-cycle uncertainty, tilt toward defence contractors and environmental services. Once an early-cycle upturn is confirmed by PMI data and broadening order growth, rotate toward machinery, construction equipment, and broader large-cap industrial ETFs to capture higher-beta recovery.
The investment vehicles available and how they compare
Three pathways exist for gaining industrial sector exposure, each with a distinct trade-off:
- Individual equities: Concentrated, high-conviction exposure to specific companies. Higher potential returns but elevated company-specific risk and less diversification.
- Mutual funds: Actively managed diversification with professional stock selection. Higher fees and less liquidity than ETFs.
- Exchange-traded funds (ETFs): Low-cost, liquid, broad sector exposure that tracks a published index. The most accessible option for most retail investors.
For U.S. retail investors, ETFs dominate the practical conversation. The two largest industrial sector ETFs are the Industrial Select Sector SPDR Fund (XLI) and the Vanguard Industrials ETF (VIS).
The cost difference between individual stocks versus ETFs is only one dimension of the decision; passive index ETFs outperformed approximately 80% of active funds on a net-of-fees basis in 2025, which frames why the default industrial exposure question for most retail investors starts with XLI or VIS rather than with a shortlist of individual names.
The methodology difference matters. XLI tracks the S&P 500 industrial companies only, concentrating exposure among large-cap names. VIS tracks a broader MSCI index that includes mid- and small-cap industrial companies, spreading exposure more widely. Both carry identical 0.10% expense ratios despite a significant difference in assets under management.
| Metric | XLI (State Street) | VIS (Vanguard) |
|---|---|---|
| YTD Return (NAV) | 8.46% | 7.98% |
| 1-Year Return (NAV) | 20.31% | 18.74% |
| 5-Year Annualised Return (NAV) | 11.27% | 10.62% |
| AUM | $20.8 billion | $5.6 billion |
| Expense Ratio | 0.10% | 0.10% |
Data as of April 30, 2026, per State Street and Vanguard fund fact sheets.
The 65-basis-point gap in five-year annualised performance (11.27% vs. 10.62%) reflects XLI’s large-cap concentration. When the largest industrial names outperform the broader group, XLI captures more of that upside. VIS, with its wider index, offers greater diversification but moderately lower returns in large-cap-led environments. These funds are not interchangeable simply because they carry the same fee.
Key holdings and what they tell you about the risks inside broad industrial ETFs
Owning a broad ETF reduces company-specific risk, but it does not eliminate it. The top holdings in XLI each carry 3-5% weightings, meaning their individual stories directly affect fund returns. Understanding what those stories are helps investors assess whether a broad allocation currently aligns with their risk tolerance.
| Company | XLI Weight | VIS Weight | Key Development | Analyst Framing |
|---|---|---|---|---|
| Honeywell | 5.2% | 3.9% | $4.95B Carrier acquisition; materials spin-off | Aerospace play with less programme risk |
| Union Pacific | 4.8% | 3.6% | Rail volume recovery underway | Cyclical but supported by freight stabilisation |
| Caterpillar | 4.6% | 3.4% | Dividend increase June 2025; infrastructure demand | Infrastructure/mining upside; high cyclicality risk |
| RTX Corp. | 4.4% | 3.2% | Defence budget tailwinds | Multi-year revenue visibility |
| Boeing | 4.2% | 3.0% | DOJ probe; CEO departure; FAA production cap | Fair value intact but risk profile elevated |
Holdings data as of April 30, 2026, per State Street and Vanguard fact sheets.
Honeywell, the top holding in XLI, is reshaping its portfolio around aerospace and automation. The $4.95 billion acquisition of Carrier Global’s security unit in December 2024, reported by Bloomberg, deepened its building technology exposure. A planned advanced materials spin-off, announced in May 2025 according to Reuters, would further concentrate the remaining business on higher-growth segments. Barron’s has described Honeywell as “a way to play aerospace without Boeing’s headaches.”
Boeing presents a different profile. The January 2024 Alaska Airlines 737 MAX 9 door-plug blowout triggered FAA production caps, a Department of Justice probe reported by Reuters in April 2024, and CEO Dave Calhoun’s departure, reported by the Financial Times in March 2024. Cash flow remains constrained.
Morningstar’s equity analysis, published in February 2025, stated that Boeing’s “fair value intact but risk profile elevated,” noting strong long-term narrow-body demand alongside significantly higher execution and regulatory uncertainty.
Caterpillar benefits from infrastructure and energy-transition tailwinds. A dividend increase in June 2025, reported by the Wall Street Journal, signalled management confidence in long-cycle demand. Morningstar rates the company as a play on infrastructure and mining upside but warns of typical high cyclicality in a severe downturn.
3M illustrates how company-specific risk can persist even when the sector trend is positive. The $10.3 billion PFAS settlement received final approval in March 2024, according to Reuters, clearing a legal overhang. The Solventum health-care spin-off was completed in April 2024. A subsequent dividend reduction, reported by Barron’s, signalled a transition period with balance-sheet repair taking priority. 3M holds 3.1% of XLI but does not appear in VIS’s top 10.
These stories reinforce one principle: diversification reduces, but does not eliminate, the need to understand what sits inside a broad industrial fund.
The structural tailwinds that extend the long-term case for industrials
Short-cycle ISM readings matter for timing. But several forces driving industrial demand operate on multi-year or decade-scale horizons, providing a durable backdrop for patient capital.
- U.S. infrastructure spending: Legislation passed in 2021-2022 continues to generate multi-year capital deployment into machinery and construction. Citi Research, in July 2024, described U.S. heavy machinery makers as “early-cycle beneficiaries of multi-year infrastructure and energy-transition capex” with upside through 2025-2027.
- Reshoring and manufacturing reinvestment: Supply chain shifts are driving capital expenditure by U.S. manufacturers seeking to repatriate or diversify production. Goldman Sachs and BlackRock both cite this as a sustained demand source for factory automation and machinery.
- Commercial aerospace supercycle: Backlogs extend into the late 2020s, driven by post-pandemic travel recovery and fleet replacement. Bank of America, in October 2024, called aerospace and defence “the most attractive pocket of industrials.”
- Industrial automation and robotics: UBS, in February 2025, flagged this as a “structural growth subsector” benefiting from labour shortages and reshoring economics, relatively resilient across cycle phases.
- Defence budget expansion: Rising NATO commitments and elevated geopolitical risk provide multi-year revenue visibility. Barron’s, in December 2024, framed defence contractors as “defensive industrials” positioned for a higher-risk environment.
Defence sector valuations present a more complex picture than the structural tailwind narrative alone suggests; ITA and XAR were trading at forward P/E multiples approximately 10-20% above their five-year historical averages as of May 2026, with Goldman Sachs, BofA, and Barclays all flagging overcrowding at the same time that the budget expansion thesis remained fundamentally intact.
Each theme connects directly to specific subsectors and holdings. Infrastructure spending flows to Caterpillar and construction equipment makers. Aerospace backlogs benefit Honeywell and RTX. Automation demand supports industrial technology names across both XLI and VIS.
Subsectors that remain more cycle-sensitive
Not every corner of industrials benefits from structural protection. Freight, trucking, and short-cycle capital goods remain more exposed to ISM and credit conditions. Wolfe Research, in April 2024, described truckload and intermodal freight as late-cycle and facing overcapacity. Evercore ISI, in January 2025, noted improving rail volumes but flagged cyclicality and valuation as reasons for a neutral rather than overweight stance. These subsectors warrant more selective positioning and closer attention to leading indicators.
Building a position in industrials without getting the timing exactly right
The preceding sections (sector composition, cycle framework, indicator process, vehicle comparison, structural themes) converge into a practical three-layer approach:
- Establish a core position in a broad industrial ETF (XLI for large-cap concentration, VIS for broader diversification) sized to long-term allocation goals. This is the foundation, not a trade.
- Use ISM/PMI indicators to time additions, increasing weighting when the New Orders sub-index crosses back above 50 and secondary indicators confirm. J.P. Morgan Private Bank, in February 2025, recommended overweighting industrials under these conditions and underweighting if recession risk rises.
- Apply subsector tilts based on cycle phase. Favour structural names (defence, automation, waste management) during late-cycle uncertainty. Rotate toward higher-beta subsectors (machinery, construction) once an early-cycle upturn is confirmed.
The MSCI USA Industrials Index has delivered a 10-year annualised return of 10.11% as of April 30, 2024, providing a long-horizon benchmark for what patient, diversified industrial exposure has historically produced.
Staggered purchases over several months around PMI inflection points, as recommended by Fidelity, BlackRock, and Barron’s, reduce the consequence of being slightly early or slightly late. Morningstar, in Q1 2025, rated U.S. large-cap machinery makers as “fairly valued to modestly undervalued” and called construction-linked names a “core way to play the industrial capex theme.”
Individual stock selection, whether Caterpillar for infrastructure conviction or Honeywell for aerospace exposure, is appropriate only for investors with specific thesis-level confidence and tolerance for company-specific risk. For most, the ETF route offers a clearer cost, liquidity, and diversification trade-off.
A measured, durable approach to one of the market’s most productive sectors
The industrial goods sector has delivered consistent long-term returns, but its breadth and cyclicality reward investors who understand what they own and approach entry with a framework rather than a hunch.
Three principles hold the approach together. First, know the subsector map: the sector is not a monolithic bet but a blend of defensive compounders and high-amplitude cyclicals. Second, watch the cycle indicators: ISM New Orders, credit spreads, and earnings revisions narrow the entry window without demanding precise timing. Third, choose the right vehicle: XLI and VIS offer distinct index methodologies at identical cost, and the difference in underlying exposure matters more than headline expense ratios.
The structural themes supporting industrials (infrastructure spending, reshoring, aerospace backlogs, automation, and defence budgets) provide a multi-year backdrop that reduces, but does not eliminate, the importance of cycle awareness. For investors with a five-to-ten-year horizon, these forces make industrials a durable core allocation rather than a short-term trade.
Reviewing current sector allocation against the industrial sector’s long-term benchmark return profile is a practical starting point. Comparing XLI and VIS exposure, examining the top holdings for alignment with personal risk appetite, and monitoring ISM data for the next inflection point are the logical next steps for deeper due diligence.
For investors who want a repeatable process for evaluating sharp declines in individual holdings, our full explainer on classifying industrial sector selloffs walks through a three-category diagnostic that distinguishes irrational overreactions (where moat indicators remain intact) from structural disruption (where the competitive position is permanently impaired), with worked examples from sectors facing similar cyclical and regulatory pressures to those discussed here.
This article is for informational purposes only and should not be considered financial advice. Investors should conduct their own research and consult with financial professionals before making investment decisions. Past performance does not guarantee future results. Financial projections are subject to market conditions and various risk factors.