How to Build a Global ETF Portfolio on the ASX With 3 Funds
7 hrs ago
When gilt yields rise, your mortgage gets more expensive. Your pension fund’s projected returns shift. The government’s room to spend on public services narrows. You do not need to own a single gilt for the gilt market to shape your financial life.
Government bonds sit at the centre of the financial system, yet most people have never been told how they actually work. They set the baseline borrowing cost for nearly every loan in the economy. Whether a country’s debt is manageable or spiralling out of control depends on a handful of variables that rarely get explained in plain language.
Here is the framework for understanding all of it: how bonds trade, why yields move, what makes debt sustainable or dangerous, and what the gilt market is telling you about the UK economy right now. Once you have these concepts, bond market headlines, pension fund behaviour, and fiscal policy debates stop being opaque and start making sense.
A government bond is a loan you make to a government. It promises to pay you a fixed amount of interest each year (the coupon) and return your original money (the principal) at a set date in the future, known as the maturity date. So far, that sounds like a savings account.
The difference is transferability. A bond can be bought and sold on financial markets before it matures. The original lender does not have to wait for repayment; they can sell the bond to someone else at whatever price the market is willing to pay. That single feature, the ability to resell, is what makes bonds powerful and volatile. It means a bond’s value changes daily, and from that, everything else about the bond market follows.
Governments issue bonds because tax revenue covers routine spending but not everything. When recessions hit, crises emerge, or large investment programmes are needed, tax receipts fall short. Bonds fill the gap.
In the UK, government bonds are called gilts. They are sold through auctions run by the Debt Management Office (DMO), where institutional buyers submit competitive bids that effectively set the interest rate the government pays. The average maturity of outstanding gilts is approximately 14 years, according to DMO data. That long maturity means the government locks in whatever rate environment prevails at issuance for over a decade, and only a fraction of the total debt stock needs refinancing in any given year.
The DMO gilt auction and issuance framework sets out the competitive bidding process through which institutional buyers effectively determine the interest rate the government pays at each issuance, with accepted bids establishing the clearing yield for the entire tranche.
The buyers are not speculators. They are institutions with specific, practical reasons for wanting the safest asset available:
The mix of holders matters. A gilt market with a broad, diverse buyer base is more stable than one dominated by a single type of investor. Concentration creates fragility; diversity creates resilience.
You have probably seen a headline saying “gilt yields rose today.” Here is what that actually means, and why it matters.
A bond pays a fixed coupon, set as a percentage of its face value when it was first issued. That coupon never changes. But the bond’s market price does change, because it trades on open markets. And when the price moves, the effective return for a new buyer, the yield, moves in the opposite direction.
The arithmetic is straightforward. Suppose a bond has a face value of £1,000 and pays £50 per year in interest (a 5% coupon). If the market price rises to £1,100, a new buyer still receives £50 per year, but they paid £1,100 for the privilege. Their yield is £50 / £1,100 = 4.5%. If the market price falls to £900, the yield rises to £50 / £900 = 5.6%.
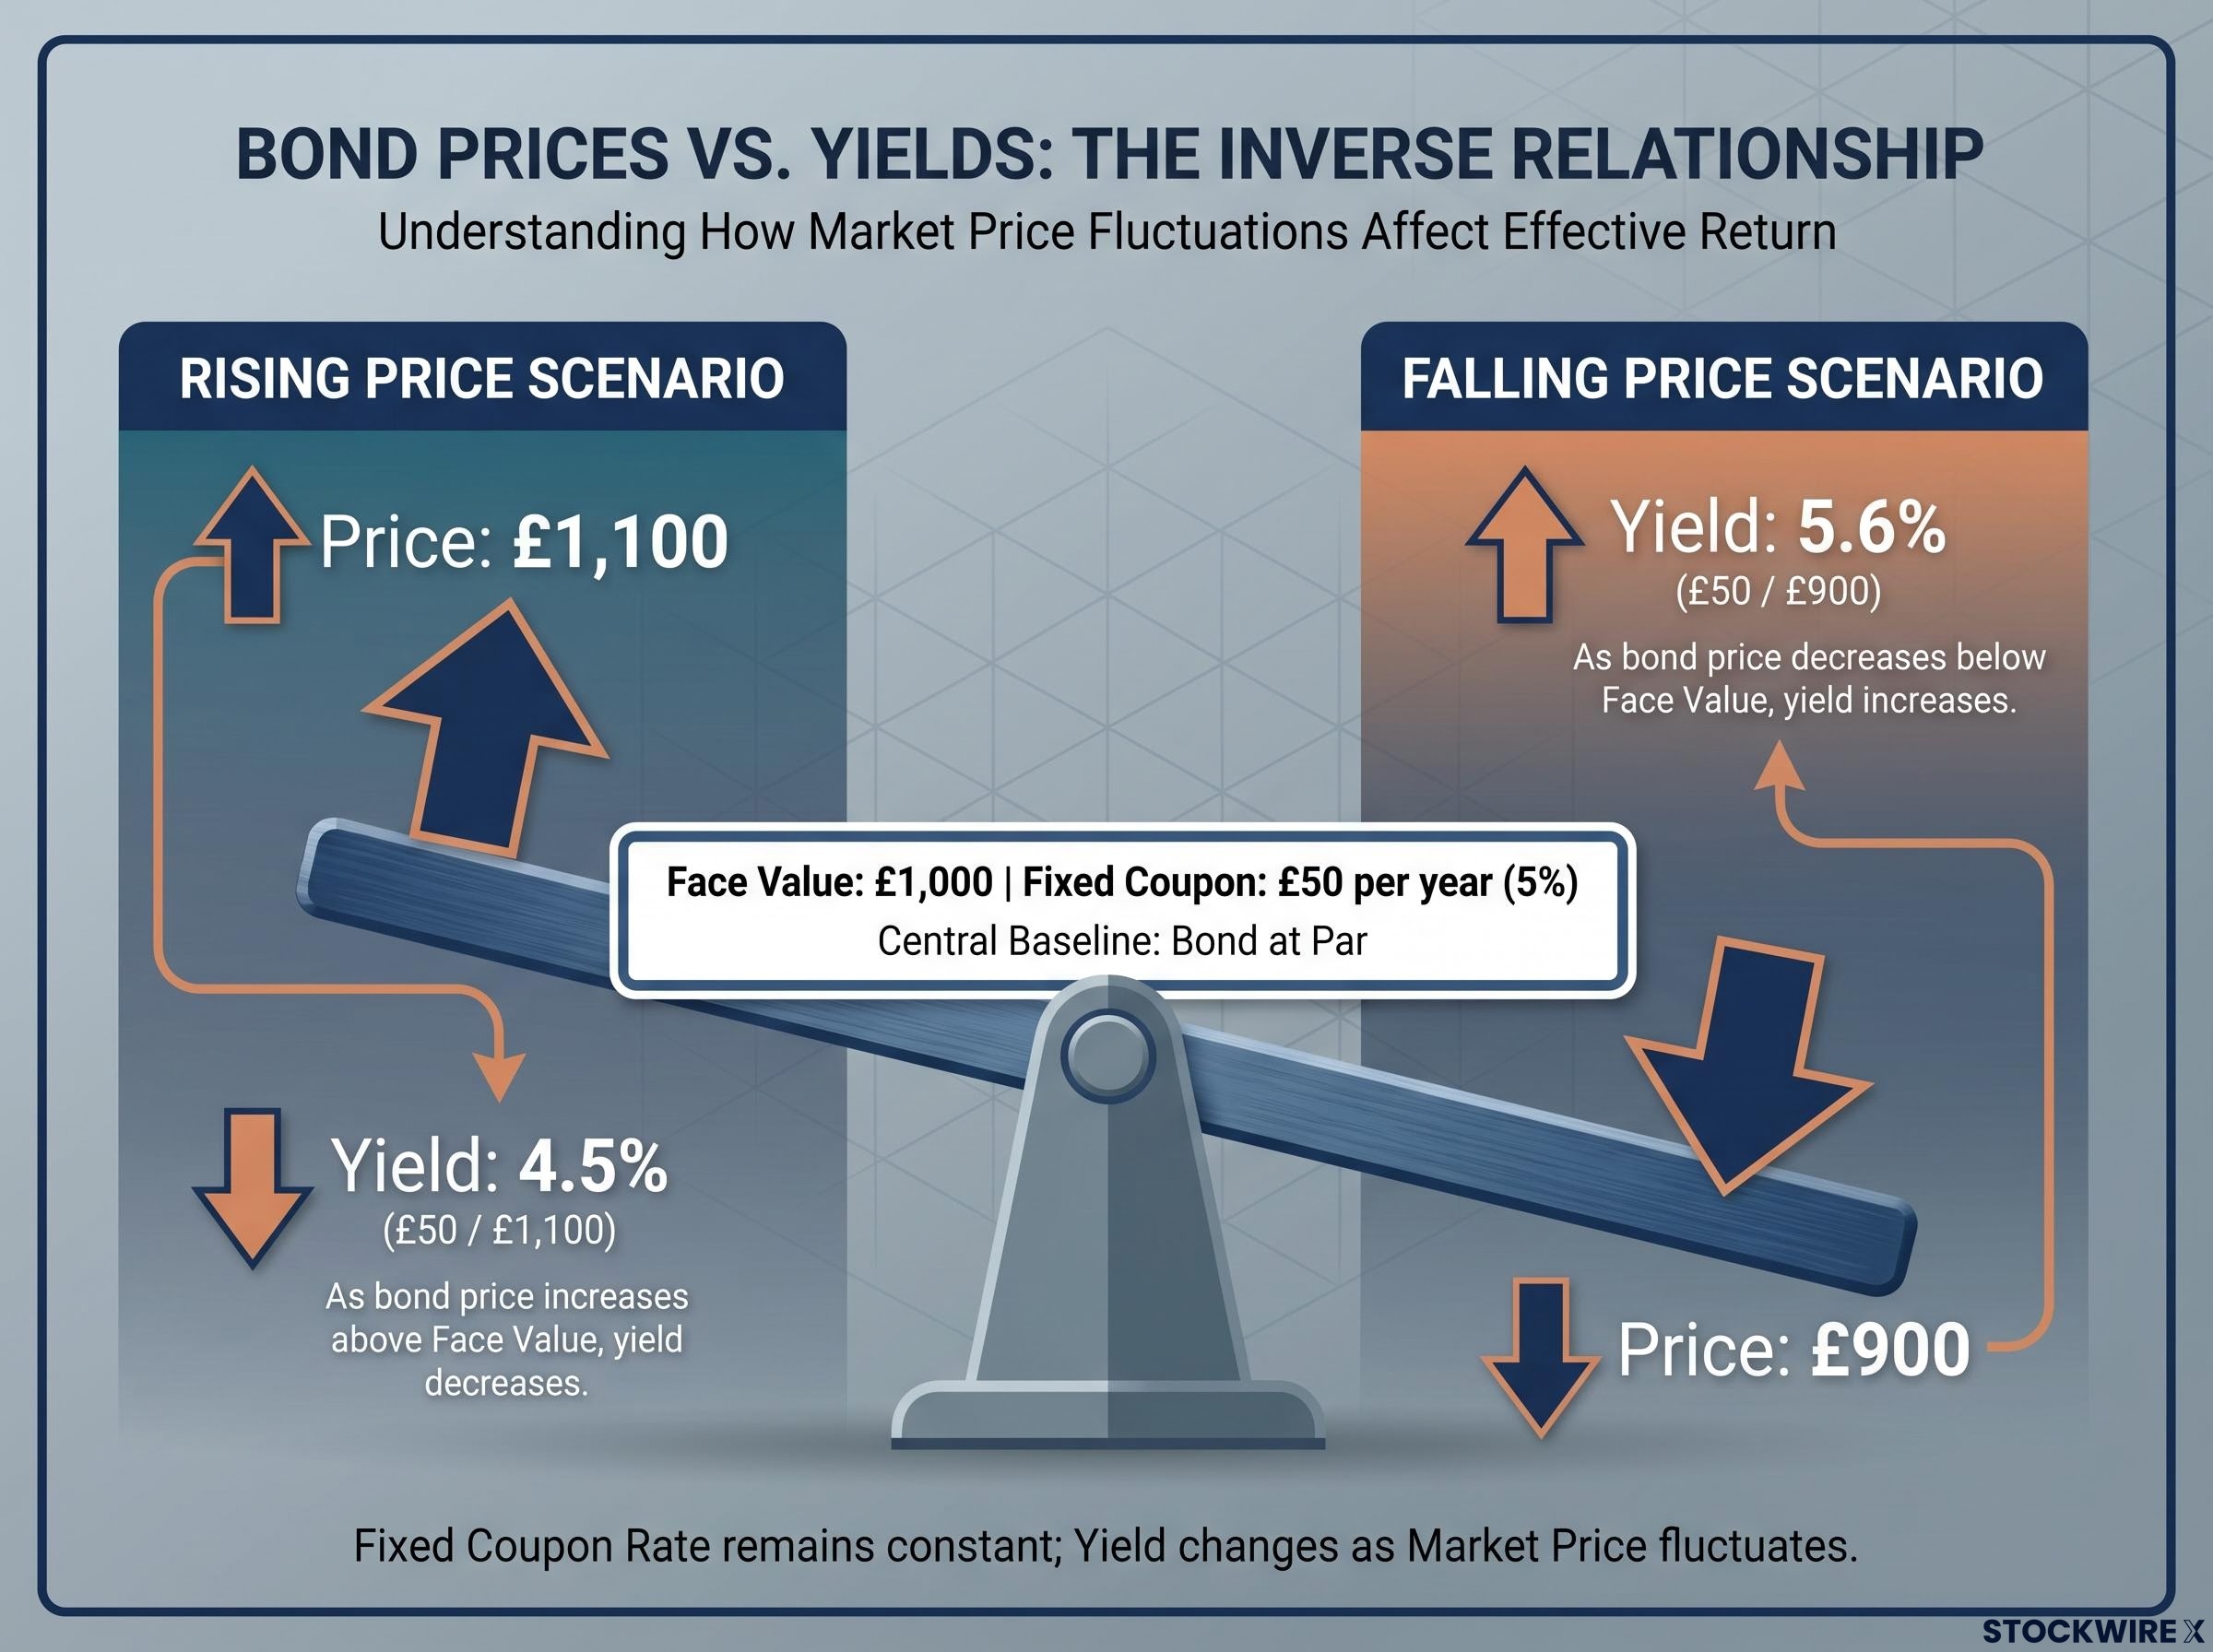
Rising yields always mean falling prices. Falling yields always mean rising prices. The relationship is not a market quirk; it is mathematical.
This matters directly for government borrowing costs. When yields on existing gilts rise, the government must offer similar yields on new gilts to attract buyers at auction. That directly increases the interest bill on all new and refinanced debt.
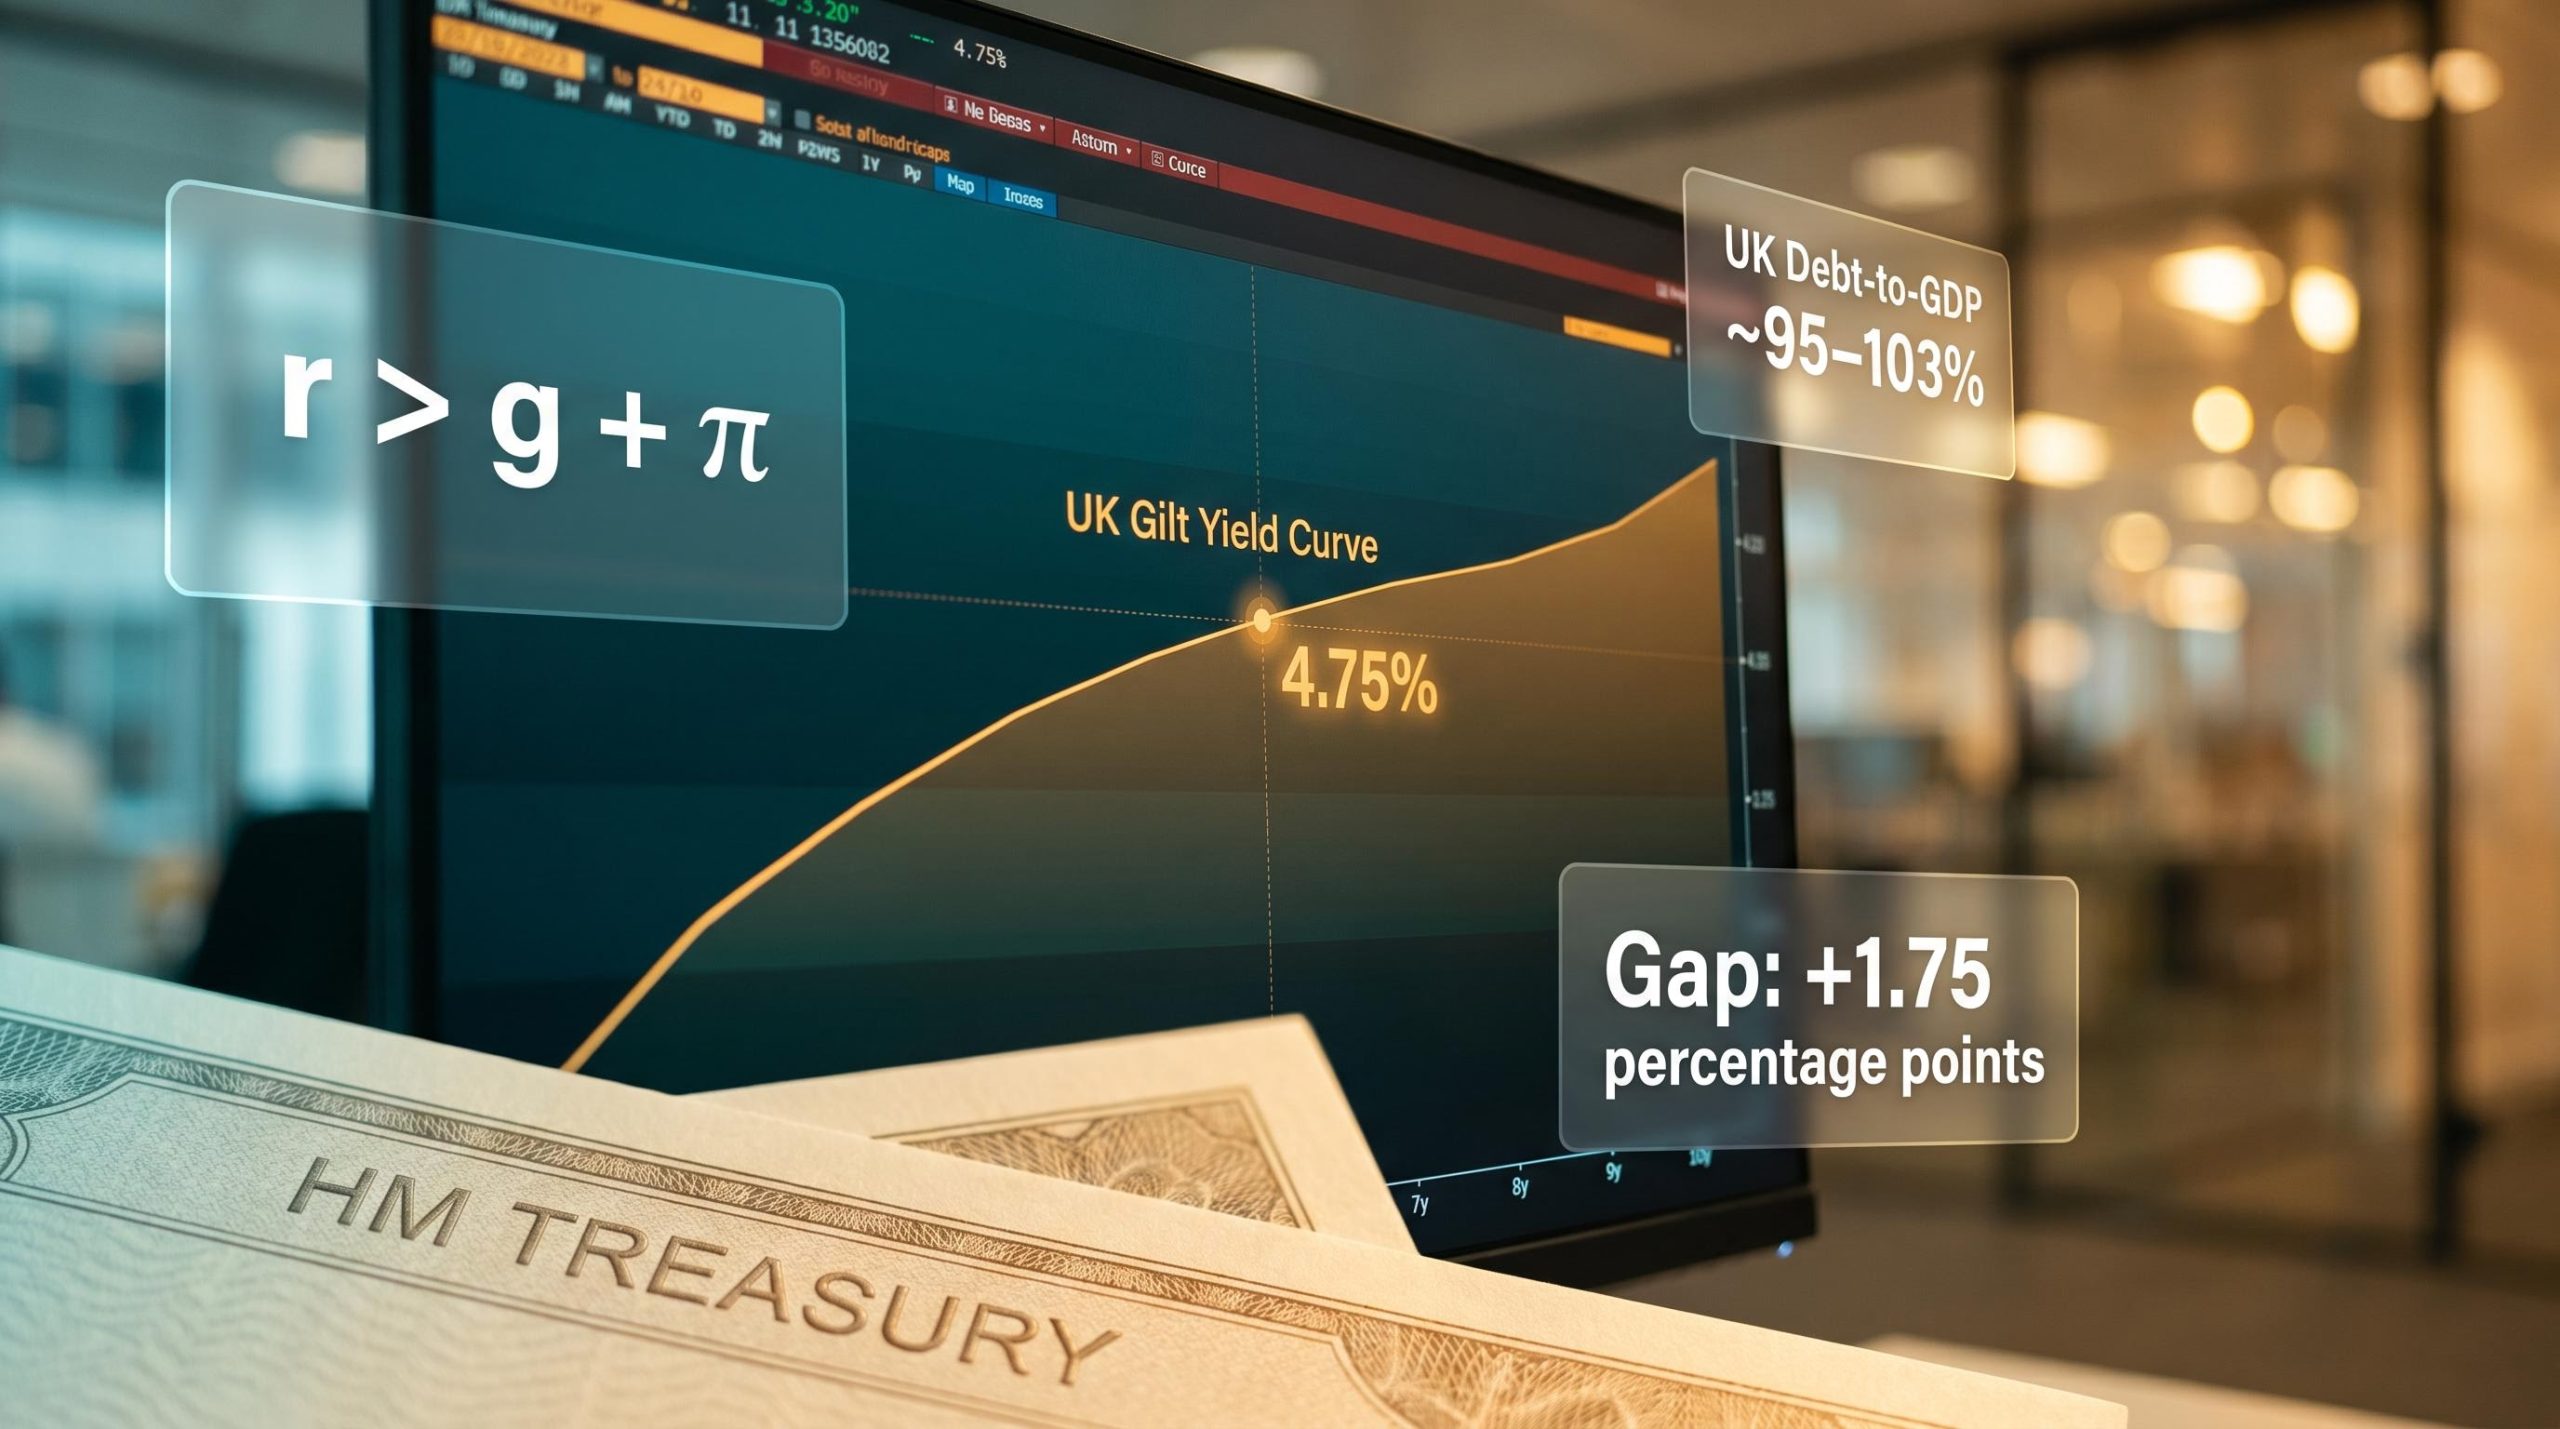
UK 10-year gilt yield: approximately 4.75%. From roughly 2009 to 2021, gilt yields were near zero, sometimes below 1%. The post-pandemic tightening cycle that began in 2022 pushed them back toward the 4-5% range, a shift that raised the government’s borrowing costs, created capital losses for holders of low-yield bonds, and, for the first time in over a decade, gave savers competitive returns on fixed-income investments.
The standard measure of government debt is the debt-to-GDP ratio: total outstanding obligations divided by the size of the economy servicing them. A higher number sounds worse, but the relationship between debt levels and danger is far less straightforward than political debate suggests.
Japan’s debt-to-GDP ratio sits at approximately 237%. It has not faced a sovereign debt crisis. It borrows predominantly in its own currency, from domestic investors, at low yields. Germany sits at 64%, which looks prudent until you note that it has also underinvested in infrastructure and defence for years. The number alone tells you almost nothing without the dynamics around it.
Debt-to-GDP thresholds are less mechanically predictive than political debate implies: the UK crossed 100% in September 2024 and retained its investment-grade credit rating, while Japan has sustained ratios above 200% for years without a sovereign funding crisis, because structural factors around who holds the debt and at what yield matter more than the headline ratio alone.
| Country | Debt-to-GDP (mid-2026) | Context |
|---|---|---|
| Japan | ~237% | Domestic holders, own currency, low yields |
| Italy | ~135% | Eurozone constraints, periodic market stress |
| United States | ~121% | Reserve currency issuer, deep markets |
| France | ~113% | Eurozone member, structural deficit pressures |
| United Kingdom | ~95-103% | ~95% net (ONS), ~100-103% gross |
| Germany | ~64% | Constitutional debt brake, low borrowing |
| Australia | ~50-70% | Commodity economy, relatively low debt |
At roughly £43,000 for every man, woman, and child in the country, UK gross debt is substantial in per-capita terms. That figure gives you a sense of the stock’s scale relative to the population, though whether it is manageable depends entirely on the arithmetic covered in the next section.
A higher ratio is easier to sustain when the economy is large and productive, growing steadily, and paying a low, stable interest cost on the debt. When those conditions hold, debt shrinks relative to the economy over time without requiring aggressive repayment. When they do not hold, even a moderate ratio can become a problem.
Whether government debt grows or shrinks relative to the economy comes down to three variables. Once you understand the relationship between them, fiscal policy debates become far more transparent.
The variables are:
Start with inflation. The government owes a fixed number of pounds. When inflation pushes prices and wages higher, tax receipts rise because people earn and spend more in nominal terms. Because the face value of existing fixed-rate debt stays constant while the broader price level climbs, the real cost of servicing that debt is gradually worn away. Borrowers benefit from this erosion; bondholders lose out, since the fixed coupons they receive command progressively less purchasing power as time passes.
Growth works through the denominator. If GDP expands at 3% per year while the nominal debt stock stays flat, the debt-to-GDP ratio falls automatically. The economy’s capacity to service the debt improves even without explicit repayment.
The threshold that matters is whether r is greater or less than g + π combined:
Now apply this to the UK. Plugging in current figures: the 10-year gilt yield of approximately 4.75% acts as a proxy for r, while the Bank of England’s inflation target of 2% and a long-run real growth trend of roughly 1% per year together put g + π at around 3%.
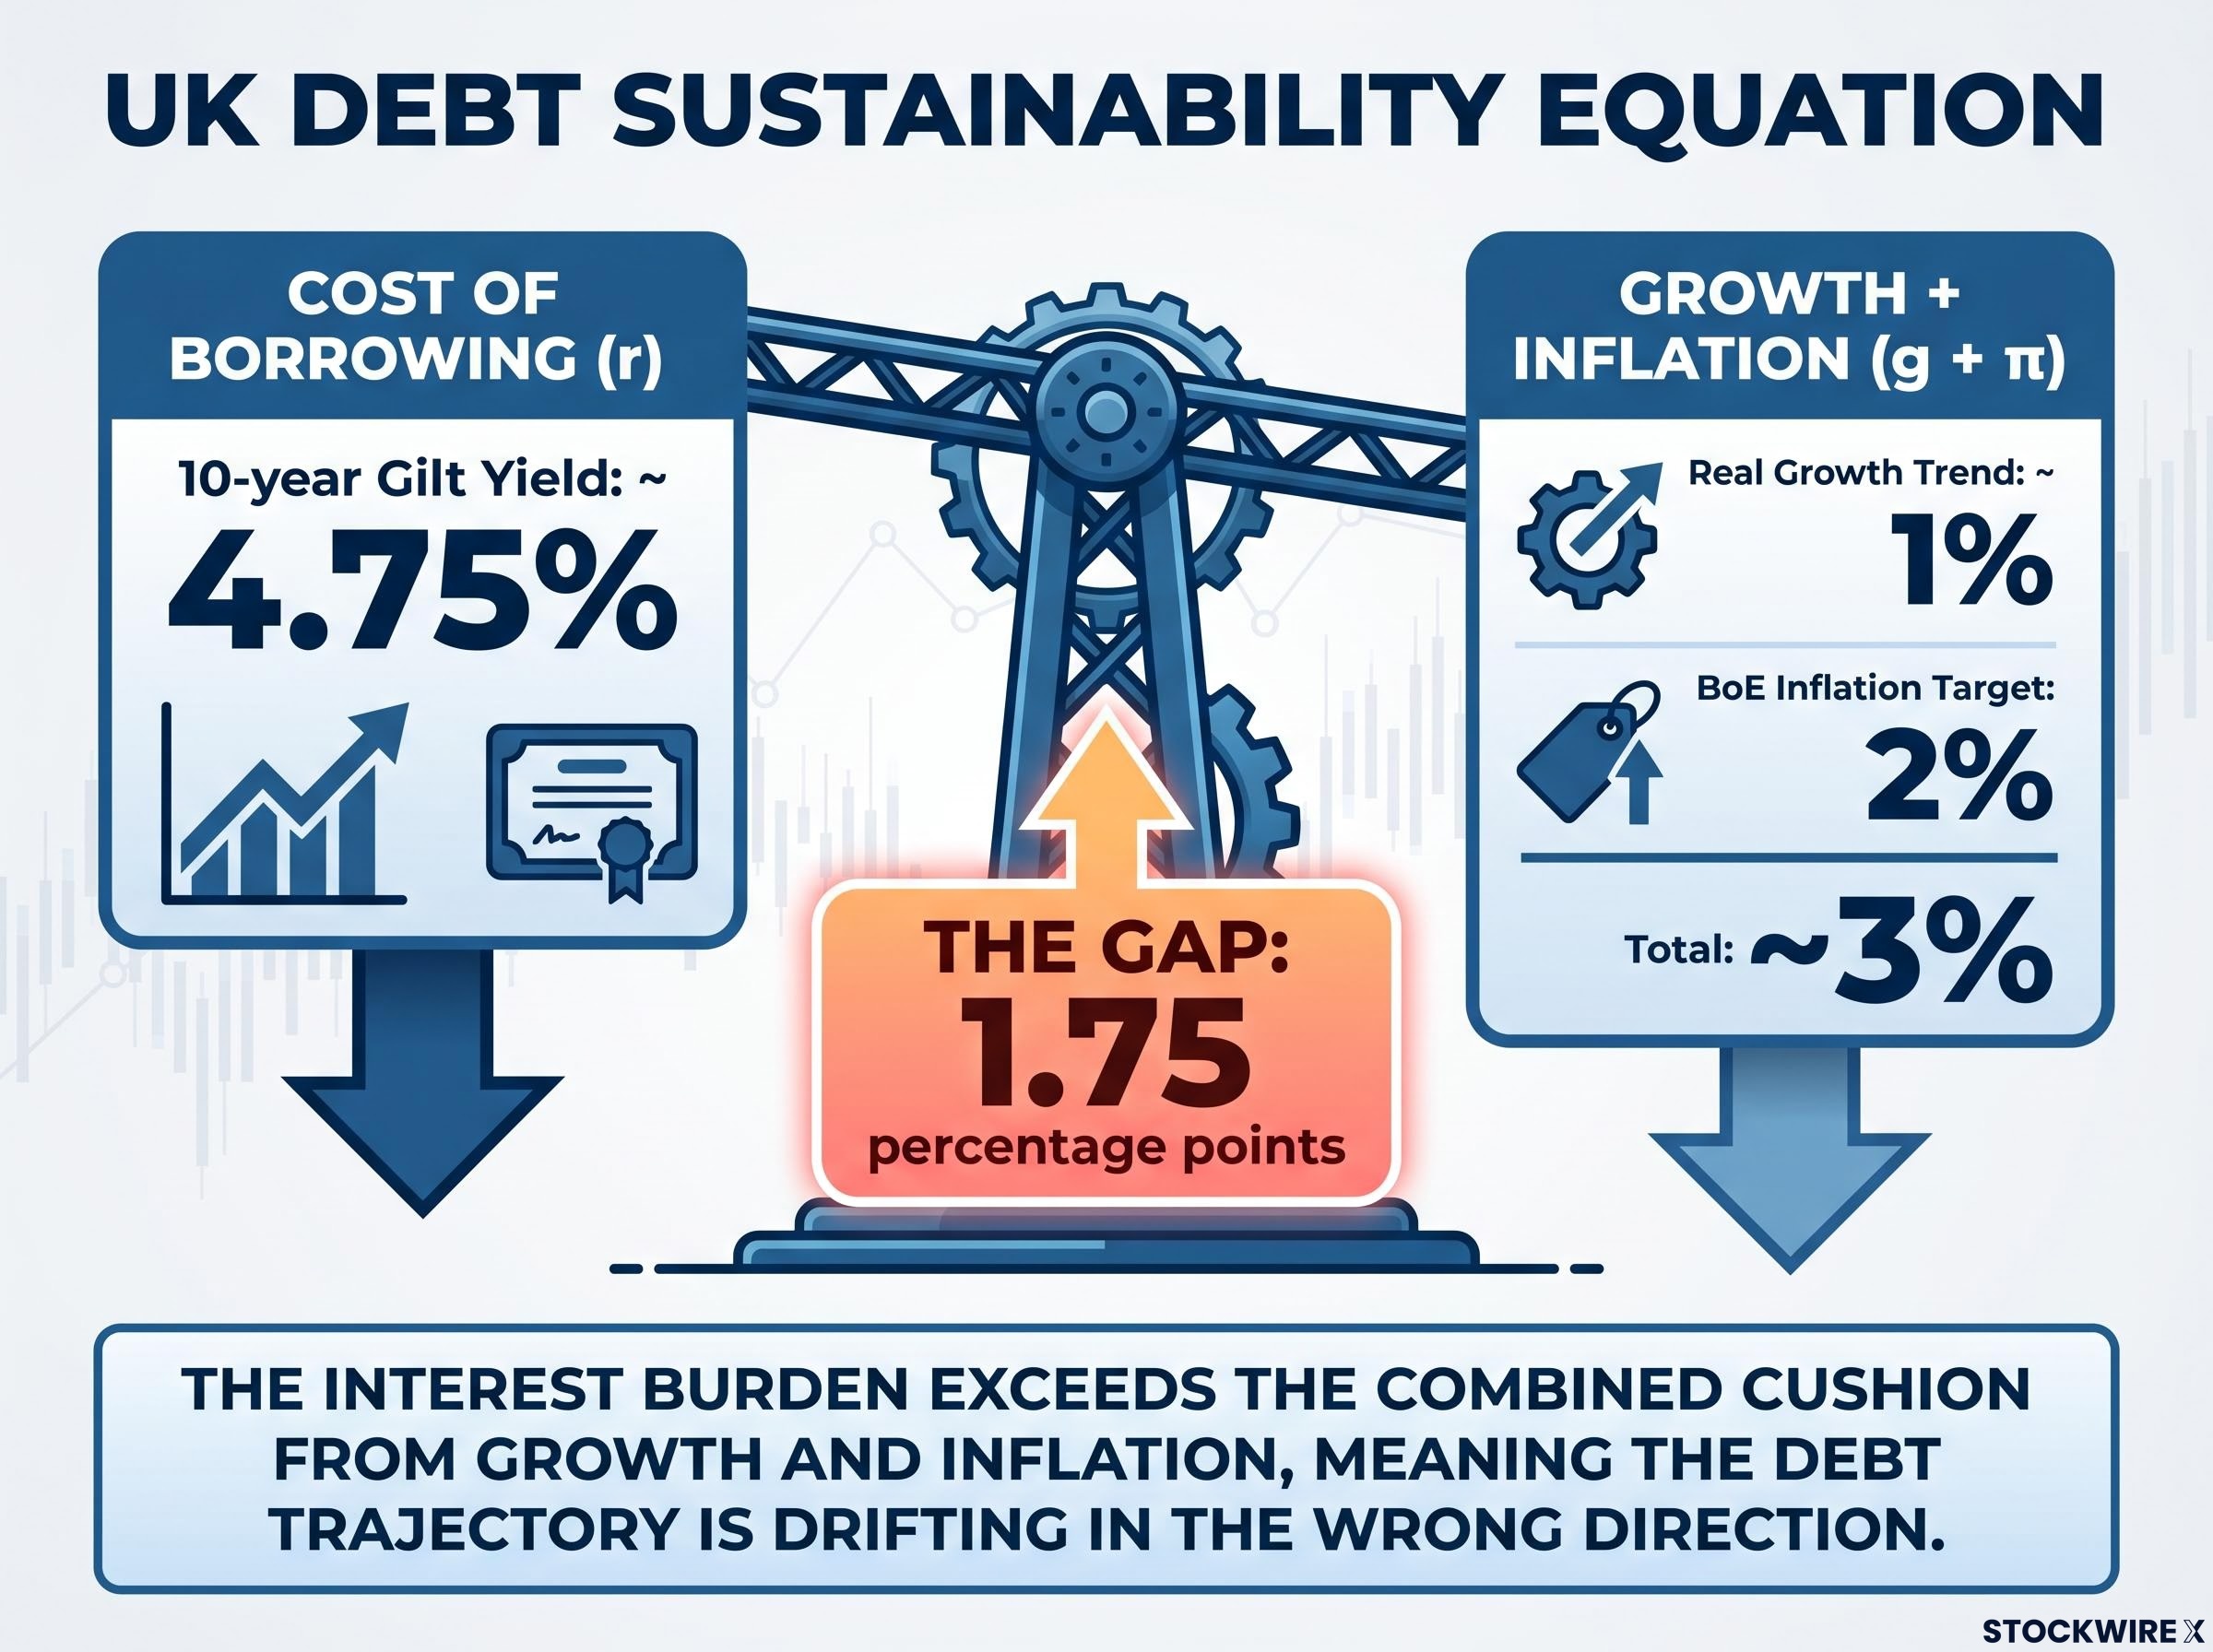
With the gilt yield at roughly 4.75% and g + π at roughly 3%, the interest burden currently exceeds the combined cushion from growth and inflation by around 1.75 percentage points. That shortfall is the core reason fiscal policy debates are so contentious right now: the debt stock tends to grow under its own momentum each year the gap persists.
This does not signal an imminent crisis. But it does mean the debt trajectory is drifting in the wrong direction. Closing the gap requires either stronger growth, a sustained period of moderately higher inflation without credibility loss, or fiscal tightening. Without at least one of those, the arithmetic works against the government each year.
UK growth forecasts matter directly to the sustainability equation: the IMF’s full-year 2026 projection of just 0.8% real GDP growth, if realised, keeps the g component of the r versus g plus inflation framework well below the current gilt yield, extending the period over which the debt ratio drifts upward under its own momentum.
If you think of bond investors the way you think of equity investors, chasing the highest possible returns, you will misread nearly everything the bond market does. Institutional bond buyers have a fundamentally different set of priorities:
Pension funds and insurers hold gilts because they have obligations stretching decades into the future: pensions to pay, annuities to honour, claims to settle. They need assets that deliver predictable cash flows at predictable dates. This is liability matching, and it is why these institutions buy gilts even when the yields look unexciting. They are not trying to beat the market. They are trying to ensure they can meet their promises.
Rising prices are the specific threat bond investors dread. A fixed coupon loses real value as the cost of living climbs, so a bondholder receiving 3% while inflation runs at 4% is effectively falling behind each year, even though every scheduled payment arrives in full. That vulnerability is why bond markets respond so sharply to inflation data, central bank communications, and any development that alters the expected path of future prices.
The period from 2022 to 2024 was one of the worst for fixed-income portfolios in recent decades. Holders of long-duration bonds issued during the near-zero rate era watched prices fall sharply as yields repriced upward. Capital losses were significant and widespread.
More troubling was the correlation breakdown. Bonds and equities fell simultaneously through much of 2022, undermining the traditional assumption that bonds cushion your portfolio when shares decline. That assumption is not a law of finance; it is a pattern that depends on the inflationary and rate environment. When inflation is the primary driver of market stress, both asset classes can fall together.
For you as a retail investor, the takeaway is not that bonds are broken. They still serve a function: reducing volatility, providing certainty of cash flow, and sometimes rising when equities fall. But the protection they offer is conditional, not guaranteed. Equities, gold, and Bitcoin have often outperformed government bonds over long stretches in pure return terms. Bonds justify their allocation through the consistency and certainty of their income, rather than through capital appreciation.
If your pension is shifting toward gilts as you approach retirement, that is not a failure of strategy. It is liability matching in action, prioritising certainty over growth at the stage of life where certainty matters most.
For readers wanting to quantify exactly how much capital loss their pension fund or bond allocation faced during the 2022-2024 repricing, our dedicated guide to bond duration explains the single number on every fund fact sheet that translates a rate move into a precise pound-value loss for your portfolio.
A loss of investor confidence in a government’s capacity to service its debt can set off a cycle that reinforces itself. The sequence runs as follows: rising anxiety about sustainability prompts investors to seek higher yields as compensation for the risk they perceive. Those higher yields increase what the government must pay to borrow, pushing the fiscal position further into difficulty. That deterioration feeds back into greater anxiety, which pushes yields higher again. Each turn of the cycle worsens the next, and the process can escalate quickly. This self-reinforcing dynamic is what markets call a doom loop.
September 2022 provided the UK’s most recent demonstration. Chancellor Kwasi Kwarteng announced an unfunded fiscal package that spooked the gilt market. Yields spiked, pension funds faced margin calls on leveraged positions, and the Bank of England was forced to intervene with emergency bond purchases to restore order. The episode showed that even a G7 sovereign with its own currency can face a market confidence shock when fiscal policy moves faster than credibility can absorb.
The Bank of England gilt market case study from its 2023 Quarterly Bulletin details the precise sequencing of the September 2022 intervention, including the financial stability tools deployed and the transmission mechanism through which leveraged pension fund positions amplified the initial yield spike.
The eurozone crisis of the early 2010s showed the dynamic in more extreme form. Greek and Italian bond yields spiked far above levels justified by their underlying economies, driven by fear rather than fundamentals, and required institutional intervention to stabilise.
Governments facing adverse debt dynamics have four main levers:
Breaking a doom loop typically requires credible fiscal consolidation, trusted central bank support, or external assistance from institutions such as the IMF. The September 2022 episode was resolved relatively quickly because the policy was reversed and the Bank of England intervened decisively. Not every episode ends that neatly.
Gilt yields are not an abstraction. They are the baseline cost of capital for the entire UK economy. Mortgage rates, corporate borrowing rates, and the discount rates used in investment valuations are all anchored to gilt yields. When gilt yields rise, credit tightens across the board, from home loans to business expansion.
The UK debt maturity structure, with its average of nearly 14 years across outstanding gilts, means that short-term yield spikes feed through to the government’s actual interest bill far more slowly than the headlines imply, an important qualification when you are reading any fiscal commentary that treats a yield move as an immediate budget crisis.
Your pension is directly connected. Most defined-contribution pension schemes shift their asset allocation toward gilts as you approach retirement. That means gilt yield movements affect the risk profile and expected returns of the majority of UK savers’ long-term wealth, whether or not you have ever thought about the bond market.
You now have a framework for evaluating fiscal policy independently. When a Chancellor presents a budget, the question is straightforward: does this policy move the relationship between r and g + π in a better or worse direction? Does the gilt market’s reaction confirm or contradict the official framing? When you see gilt yields spike after a fiscal announcement, the market is telling you something about credibility. When yields hold steady, that is a signal too.
Under current conditions, with the interest rate exceeding the growth-plus-inflation combination by approximately 1.75 percentage points, the path to a more stable debt trajectory requires at least one of three things:
Track those three variables and you have a live read on whether UK public finances are improving or deteriorating. Government bonds are the pricing mechanism for sovereign risk and the plumbing of the financial system. Understanding how they work is not specialist knowledge. It is the foundation for understanding how any modern economy functions.
This article is for informational purposes only and should not be considered financial advice. Investors should conduct their own research and consult with financial professionals before making investment decisions.
A government bond is a loan you make to a government in exchange for fixed annual interest payments (the coupon) and the return of your principal at a set maturity date. Unlike a savings account, bonds trade on open markets before maturity, so their price and effective yield change daily.
Because the coupon payment is fixed, a rising bond price means a new buyer pays more for the same income, so their percentage return falls. Conversely, a falling price delivers the same fixed income for less outlay, pushing the yield up. The relationship is mathematical, not a market quirk.
The debt-to-GDP ratio measures total government obligations as a share of the economy servicing them, but the number alone tells you little: the UK crossed 100% gross debt in 2024 and kept its investment-grade rating, while Japan has sustained ratios above 200% for years, because who holds the debt and at what yield matters more than the headline figure.
Gilt yields act as the baseline cost of capital for the entire UK economy, so when they rise, lenders raise mortgage rates to maintain their margins above that floor. The UK 10-year gilt yield of approximately 4.75% in current conditions feeds directly into the fixed-rate mortgage market.
A doom loop occurs when rising investor anxiety about a government's ability to repay its debt pushes yields higher, which increases actual borrowing costs, which worsens the fiscal position, which feeds further anxiety in a self-reinforcing cycle. The UK's September 2022 gilt crisis, triggered by the unfunded Kwarteng budget, is the most recent example of how quickly this dynamic can escalate even for a G7 sovereign.