A trader recently put on a position that risked $192.50 to target a potential gain of more than $1,050. That is roughly five and a half dollars of upside for every dollar at risk.
The tool that makes that ratio possible is a defined-risk options structure built on a chart pattern most people recognise but few know how to turn into a trade with a fixed maximum loss.
Right now, the setup for that trade looks more compelling than usual. The Russell 2000 small-cap index has lost 7.4% year-to-date through September 2026, the 10-year Treasury yield sits at 4.95%, and Brent crude has pushed above $107 per barrel. Small caps are being squeezed by forces that larger benchmarks are shrugging off more easily.
The same technical pattern that guided a prior bearish trade to a 10.70-point combined gain has reappeared, this time as a double top. A professional trader has responded by building a new position around it.
This walks you through exactly how that Russell 2000 options strategy is constructed: what it costs, what it can earn, and how the macro and technical conditions came together to make a trader want to own it. By the time you finish, you will be able to read the same signals and evaluate the trade’s logic for yourself.
Why small-cap stocks are under pressure right now
The Russell 2000’s 7.4% decline through September 2026 is not a random slump. It is the predictable outcome of a specific macro combination, and understanding that combination is what makes the bearish case credible in the first place.
Start with debt. Small-cap companies lean heavily on bank loans and shorter-maturity borrowing, which means rising rates hit them quickly. With the 10-year Treasury at 4.95% as of 11 September 2026, interest coverage deteriorates and credit access tightens, a pressure that cash-rich mega-caps sitting on long-term fixed-rate debt largely avoid.
Then add energy. Brent crude above $107 per barrel on the same date squeezes margins hardest for smaller, domestically focused businesses that cannot spread rising input and freight costs across global revenue bases the way multinationals can.
The three structural channels stack up like this:
- Short-duration debt: Small caps refinance sooner and borrow shorter, so rising rates erode their interest coverage faster than large caps.
- Weaker pricing power: Narrower margins mean elevated energy and freight costs bite harder, with less ability to pass them on.
- Domestic revenue concentration: Most small-cap revenue comes from the U.S. economy, leaving no international cushion when domestic financial conditions tighten.
Put those three together and the underperformance stops looking like noise.
Small-cap underperformance has a structural dimension that the macro explanation alone does not capture: quality factor scores for Russell 2000 constituents sat at a negative reading as of late 2025, reflecting a tilt toward lower-quality, more rate-sensitive businesses that amplifies the pressure from elevated yields and energy costs.

Russell 2000 Total Return, year-to-date: −7.4% through September 2026 (FTSE Russell/LSEG Performance Insights)
You can see the relative weakness in real time. On the trade entry day, the NASDAQ climbed roughly 1% while the Russell 2000 managed only about half that, near 0.5%. On 11 September 2026, the index closed at 2,891.68, down 29.55 points (1.01%) on the session.
Here is what that means for you. When financial conditions tighten, small caps lose ground faster than the benchmarks most investors actually track. That gap between what the Russell does and what the S&P does is precisely the inefficiency this trade is built to capture.
When big ASX news breaks, our subscribers know first
Reading the chart: what a double top pattern signals and how to measure it
On the screen, a double top looks simple: price rises to a resistance level, fails, pulls back, rallies to the same level again, and fails a second time. That second rejection is the whole story.
A double top is a distribution pattern. In plain terms, it signals that buyers have twice tried and twice failed to push price through a ceiling, which suggests upward momentum has run out and sellers are taking control.
The double top belongs to a broader family of bearish chart patterns that share a common logic: price fails at resistance, volume confirms exhaustion, and a measured-move target provides a quantifiable exit destination rather than a vague directional bias.
This particular pattern is forming beneath a familiar ceiling. The resistance zone near the 3,050-3,070 area is the same level that served as the short call spread strikes in the trader’s original head and shoulders trade. What was resistance then is acting as resistance now.
A mid-August false breakout, where price briefly poked above the zone before collapsing back, adds weight to the bearish reading. False breakouts often trap buyers and accelerate the reversal that follows.
At the time of analysis, the Russell 2000 had pulled back from its one-week moving average near 2,925 to roughly 2,909.
How the measured-move target anchors the strike selection
The double top does not just say “down.” It tells you how far.
The measured-move method projects a target using the pattern’s own geometry. Here is the sequence:
- Identify the pattern’s peak at the resistance zone.
- Measure the vertical height from that peak down to the neckline (the intervening swing low).
- Project that same distance downward from the breakout point.
- Arrive at the target, which in this case points to approximately 2,730.
That 2,730 figure is not a guess. It is the level the chart’s geometry projects as the likely destination if the pattern resolves bearishly, which is exactly why the trade’s strikes sit where they do.
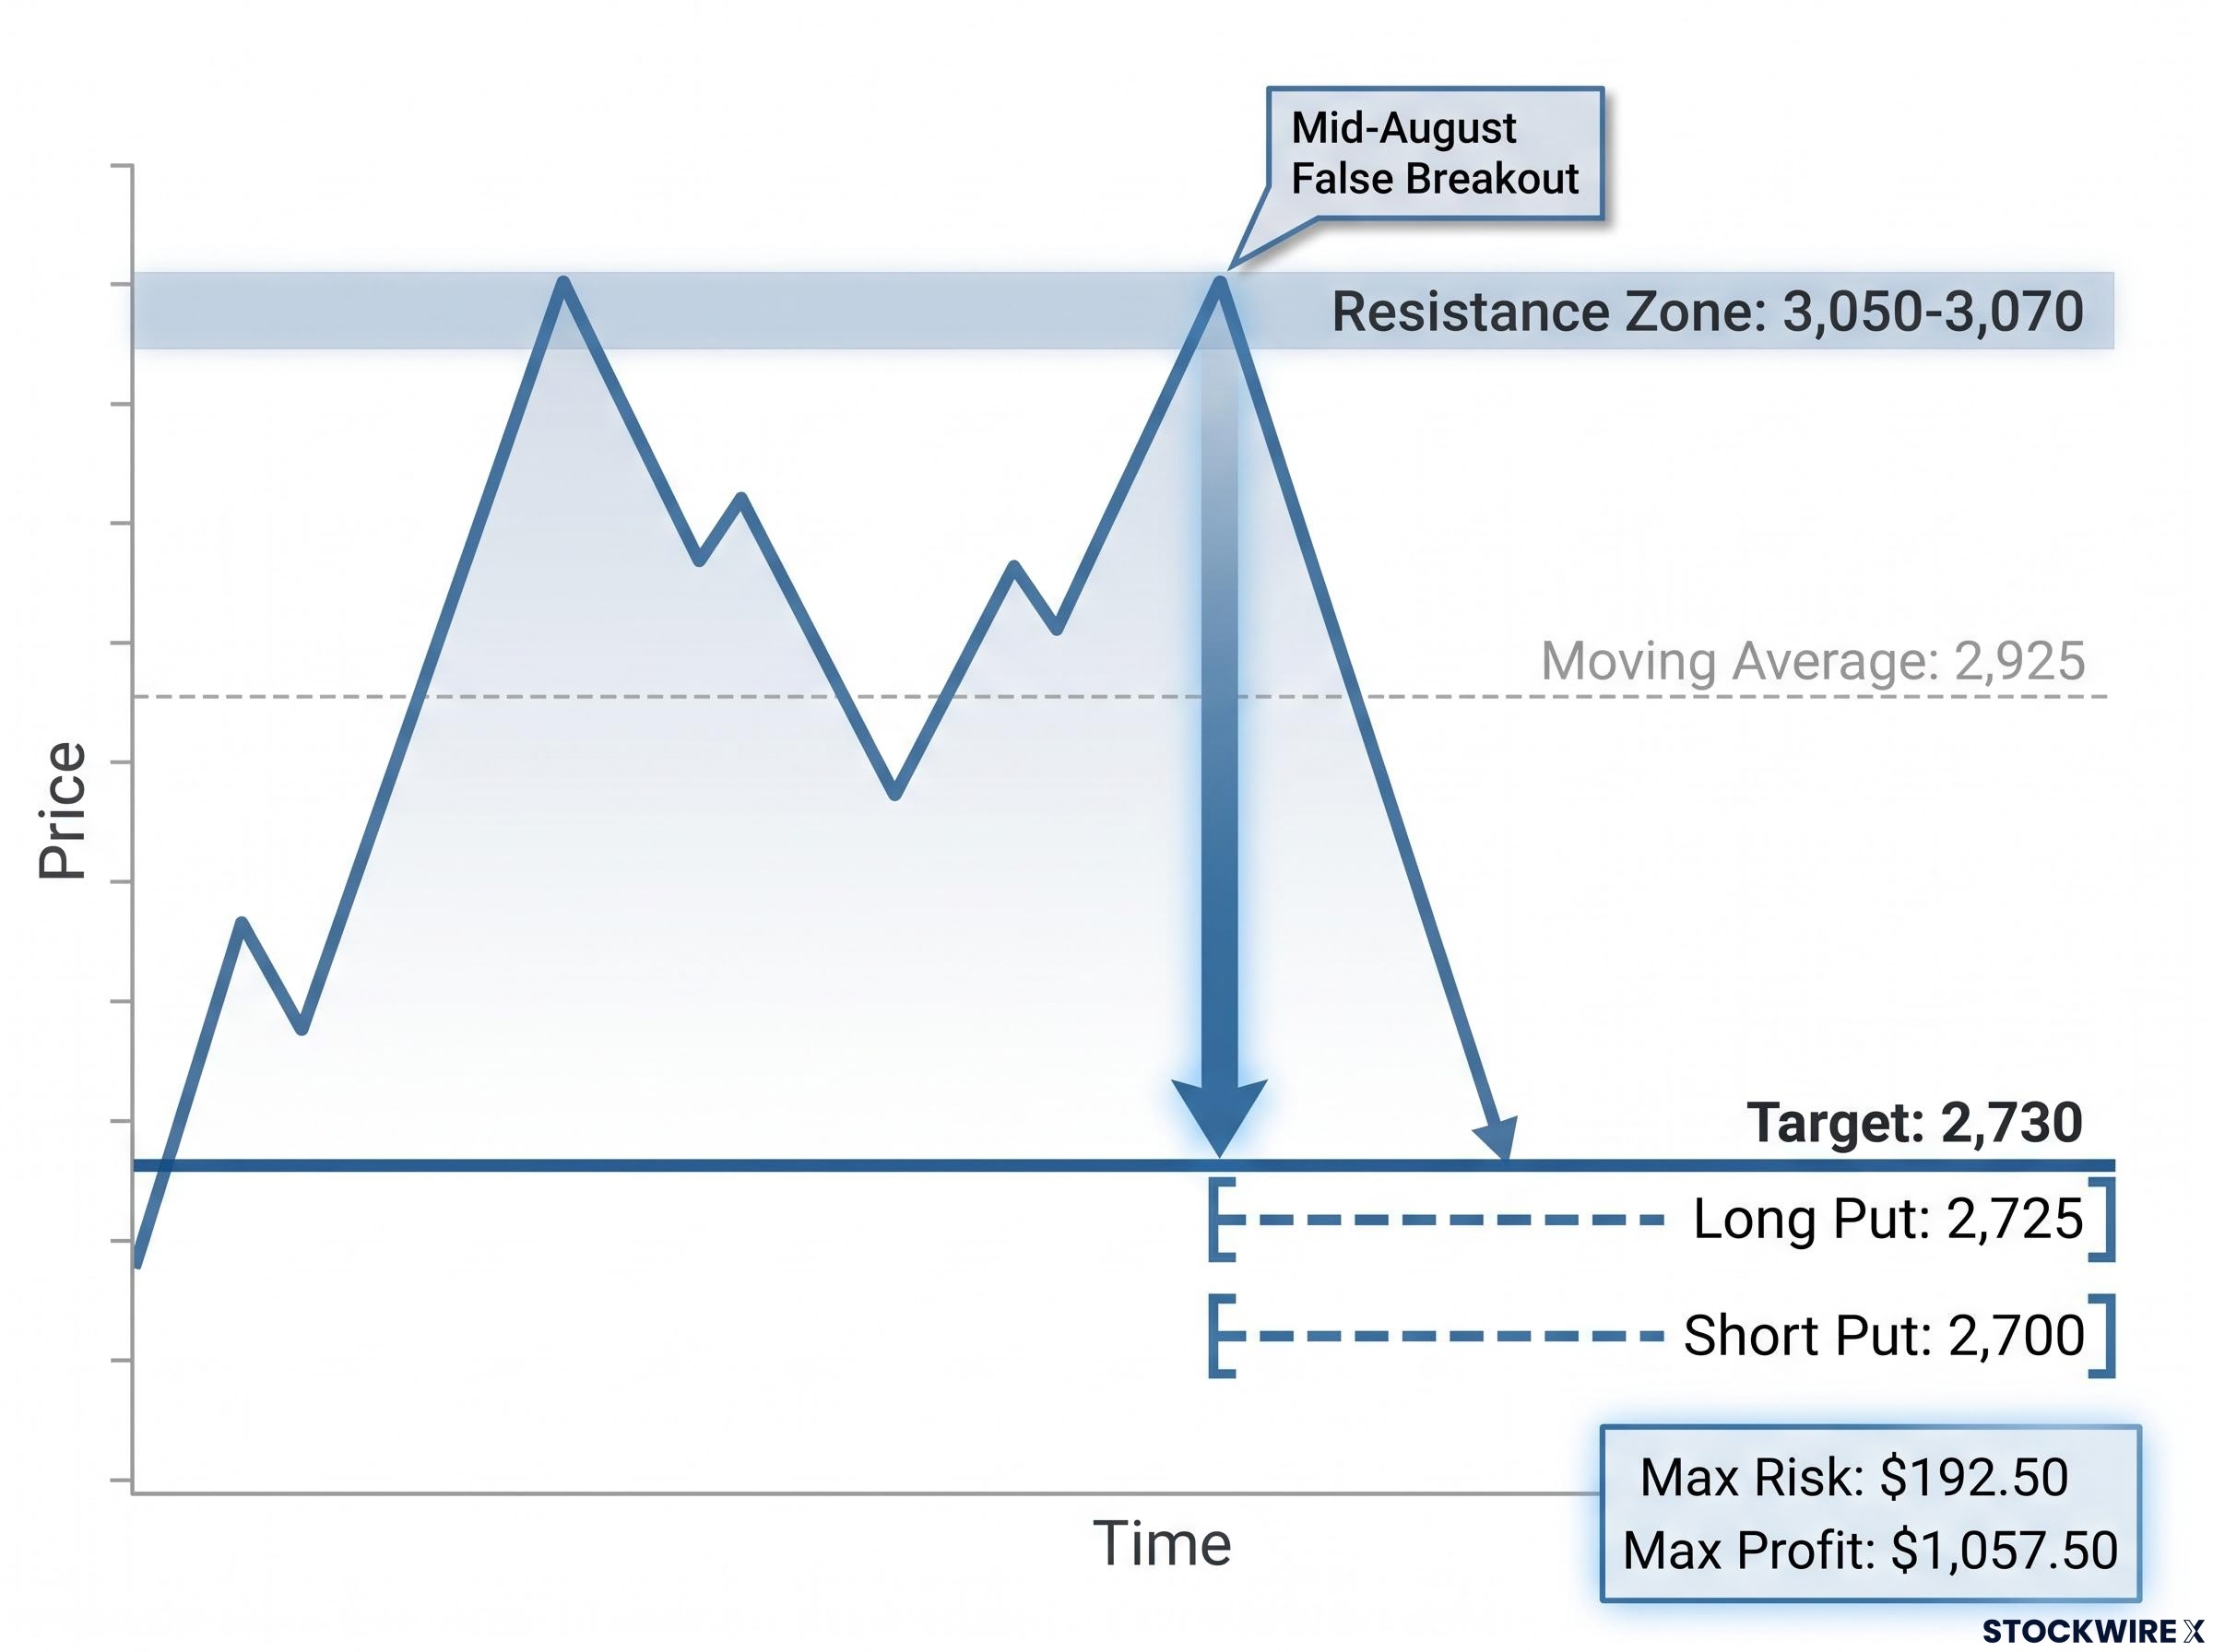
The long put strike of 2,725 sits just below the measured-move target, aligning the options architecture with the technical projection. The short put at 2,700 caps the structure 25 points below, defining both the maximum risk and the maximum reward.
When strikes are anchored to a measured move rather than picked arbitrarily, you can judge whether an options trade is grounded in technical logic or simply hope. That distinction is what separates structured positioning from reactive guessing.
How the long put spread is structured and what it costs to be wrong
Here is the full anatomy of the new position. The trader bought the 2,725 put and sold the 2,700 put in the December 2026 E-Mini Russell 2000 futures contract, with roughly 90 days to expiration.
That combination is a long put spread, a defined-risk bet on the index falling. Every futures point is worth $50, which is what turns the point figures into dollars you can plan around.
The net debit, the amount paid to put the trade on, is 3.85 points, or $192.50. That is the maximum you can lose, fixed the moment the trade is opened.
The maximum profit is 21.15 points, or $1,057.50, calculated as the 25-point spread width minus the 3.85-point debit. Breakeven at expiration sits at 2,721.15, the long strike minus the debit paid.
| Metric | Value in Points | Value in Dollars |
|---|---|---|
| Net Debit (Max Loss) | 3.85 | $192.50 |
| Max Profit | 21.15 | $1,057.50 |
| Breakeven at Expiration | 2,721.15 | n/a |
| Spread Width | 25.00 | $1,250.00 |
| Futures Point Value | 1.00 | $50.00 |
There is a volatility angle here too. The implied volatility rank (IVR) was 20.4 at entry, with raw implied volatility around 23%. IVR measures where current volatility sits relative to its recent range, and a reading near 20 is low.
Buying a put spread when volatility is cheap is a structurally favourable setup. Premium costs less, and there is room for volatility to expand in your favour if fear returns to the market.
The IVR reading of 20.4 and a low raw implied volatility near 23% also shape the trade’s probability of profit: cheap premium means the debit paid understates the spread’s realistic value if volatility expands, and quantifying that probability before entry is what separates disciplined position sizing from intuition.
Risk/reward at entry: approximately 5.5-to-1, targeting a 21.15-point gain against a 3.85-point maximum loss.
That ratio changes how you think about the trade. Because the upside dwarfs the risk, the position does not need to reach full profit to be worthwhile, and it does not even need the index to hit 2,730 if implied volatility expands enough to lift the spread’s value. If the market instead rallies back through 2,925, the trader flagged repositioning near 2,970 as a live option. That is the appeal of defined-risk options: directional exposure without open-ended downside.
What the original super bear trade achieved, and why the structure changed
Before this clean single spread, the trader ran something more elaborate, and its results are what validate the bearish thesis in the first place.
The original position combined two spreads. On the downside, a long put spread at the 2,925/2,900 strikes cost about 5.60 points ($280). On the upside, a short call spread at 3,050/3,075 collected roughly 9.80 points ($490).
Because the call spread brought in more than the put spread cost, the trade opened for a net credit of 4.20 points ($210). Each leg was 25 points wide, worth $1,250 in notional terms at $50 per point.
The logic was deliberate. The short call spread financed the downside protection and generated income if the market drifted sideways or lower. The catch was that it introduced short call risk: a sharp rally toward the 3,050 strike would create mark-to-market stress.
Market conditions moved in the trader’s favour, and the position was closed for an additional 6.50-point credit ($325). The exit was driven by rising gamma risk as the trade matured and a desire to avoid exposure to a sudden macro reversal, specifically a drop in oil or yields that could trigger a fast rally.
Combined with the entry credit, the total gain came to 10.70 points ($535) before fees and slippage.
| Feature | Original Super Bear Trade | New Long Put Spread |
|---|---|---|
| Structure | Long put spread 2,925/2,900 plus short call spread 3,050/3,075 | Long put spread 2,725/2,700 |
| Entry Credit/Debit | Net credit 4.20 pts ($210) | Net debit 3.85 pts ($192.50) |
| Max Profit | ~29.20 pts ($1,460) downside | 21.15 pts ($1,057.50) |
| Max Loss | ~20.80 pts ($1,040) upside | 3.85 pts ($192.50) |
| Key Risk | Short call exposure on a sharp rally | IV compression or no move lower |
| Best Market Scenario | Grinding drift lower or sideways | Sharp move down or volatility expansion |
When a debit spread beats a credit structure
Why would a trader voluntarily switch from a structure that pays you to a structure that costs you? The answer is expectation.
Debit spreads like this long put spread suit a trader who expects a sharp directional move or a jump in volatility. Both positive gamma (accelerating profit as price moves your way) and positive vega (rising value as volatility climbs) work in your favour when the move is fast.
Credit structures, the short call spread combined with a long put spread, suit markets expected to drift lower or stay rangebound. There, theta, the value that decays out of options as time passes, works in your favour on the short leg without needing a large price move.
The switch tells you something specific. Moving from a credit structure to a debit spread signals the trader now expects a faster, more volatile move lower rather than a slow grind, and that the cleaner structure was worth giving up the income to eliminate short call risk and operational complexity.
What would have to be true for this trade to go wrong
Every trade has a failure scenario, and this one has three worth naming plainly.
- A macro-driven rally: A dovish Federal Reserve pivot, a drop in oil, or a geopolitical resolution could spark a sharp small-cap rally, pushing the index back toward or above the short put strike.
- Implied volatility compression: If macro fears ease, IV can fall even without a meaningful price rally. With IVR at 20.4 and raw IV near 23%, there is room for volatility to contract, which would drag on the spread’s value.
- Time decay erosion: If the index fails to move materially toward the strikes over the 90-day window, the long put loses time value faster than the short put, eating into the position.
None of these breaks the risk budget, and that is the point.
Maximum loss: 3.85 points ($192.50) per contract, fixed and known at entry.
No matter how wrong the thesis turns out to be, the loss cannot exceed $192.50 per contract. That capped downside is exactly what makes a defined-risk spread usable as a hedge rather than a fresh risk to manage.
Context matters here. This position is not a standalone speculative bet. It functions as a hedge against long S&P 500 exposure the trader holds through December 2026, offsetting the risk that small caps lead the broader market lower.
The trader also has a plan if it goes against them. Should the index trade back through 2,925, repositioning near the 2,970 resistance level is on the table. Knowing your failure scenario and your adjustment plan before entry is the difference between a disciplined hedge and an undisciplined gamble.
This article is for informational purposes only and should not be considered financial advice. Investors should conduct their own research and consult with financial professionals before making investment decisions. Past performance does not guarantee future results. Financial projections are subject to market conditions and various risk factors.
What this trade tells you about using options as a portfolio hedge
Step back from the specific strikes and a repeatable process comes into focus. The real lesson is not the numbers; it is the order of operations.
The trader diagnosed the macro environment first, confirmed it with a technical pattern that produced a measured-move target, anchored the strikes to that target, and then chose a structure to match the expected character of the move. That sequence works on the next trade too.
- Identify the macro condition that creates a directional bias. Here, high rates, high oil, and domestic revenue concentration built the bearish case for small caps.
- Confirm with a technical pattern that provides a measured-move target and anchors strike selection. The double top projected 2,730, and the strikes sat right there.
- Choose the structure based on the expected character of the move. A debit put spread for a sharp move or volatility expansion; a credit structure for a slow grind.
The payoff of that discipline is the trade itself: risking 3.85 points ($192.50) to target 21.15 points ($1,057.50), with the worst case defined before entry.
What validates the thesis from here is simple. If yields and oil stay elevated and the double top breaks toward 2,730, the spread can march toward full profit. If macro conditions reverse sharply and the index climbs back above the 2,925-2,970 zone, the loss is already known and capped. The specific numbers will change on your next trade. The logic behind them does not.
For investors wanting to see how this defined-risk structure fits within a broader defensive framework, our dedicated guide to portfolio downside protection covers tail-risk sleeves, deep out-of-the-money index puts, and the three-layer portfolio architecture that professional managers use to address market crashes, multiple reversion, and forced selling simultaneously.