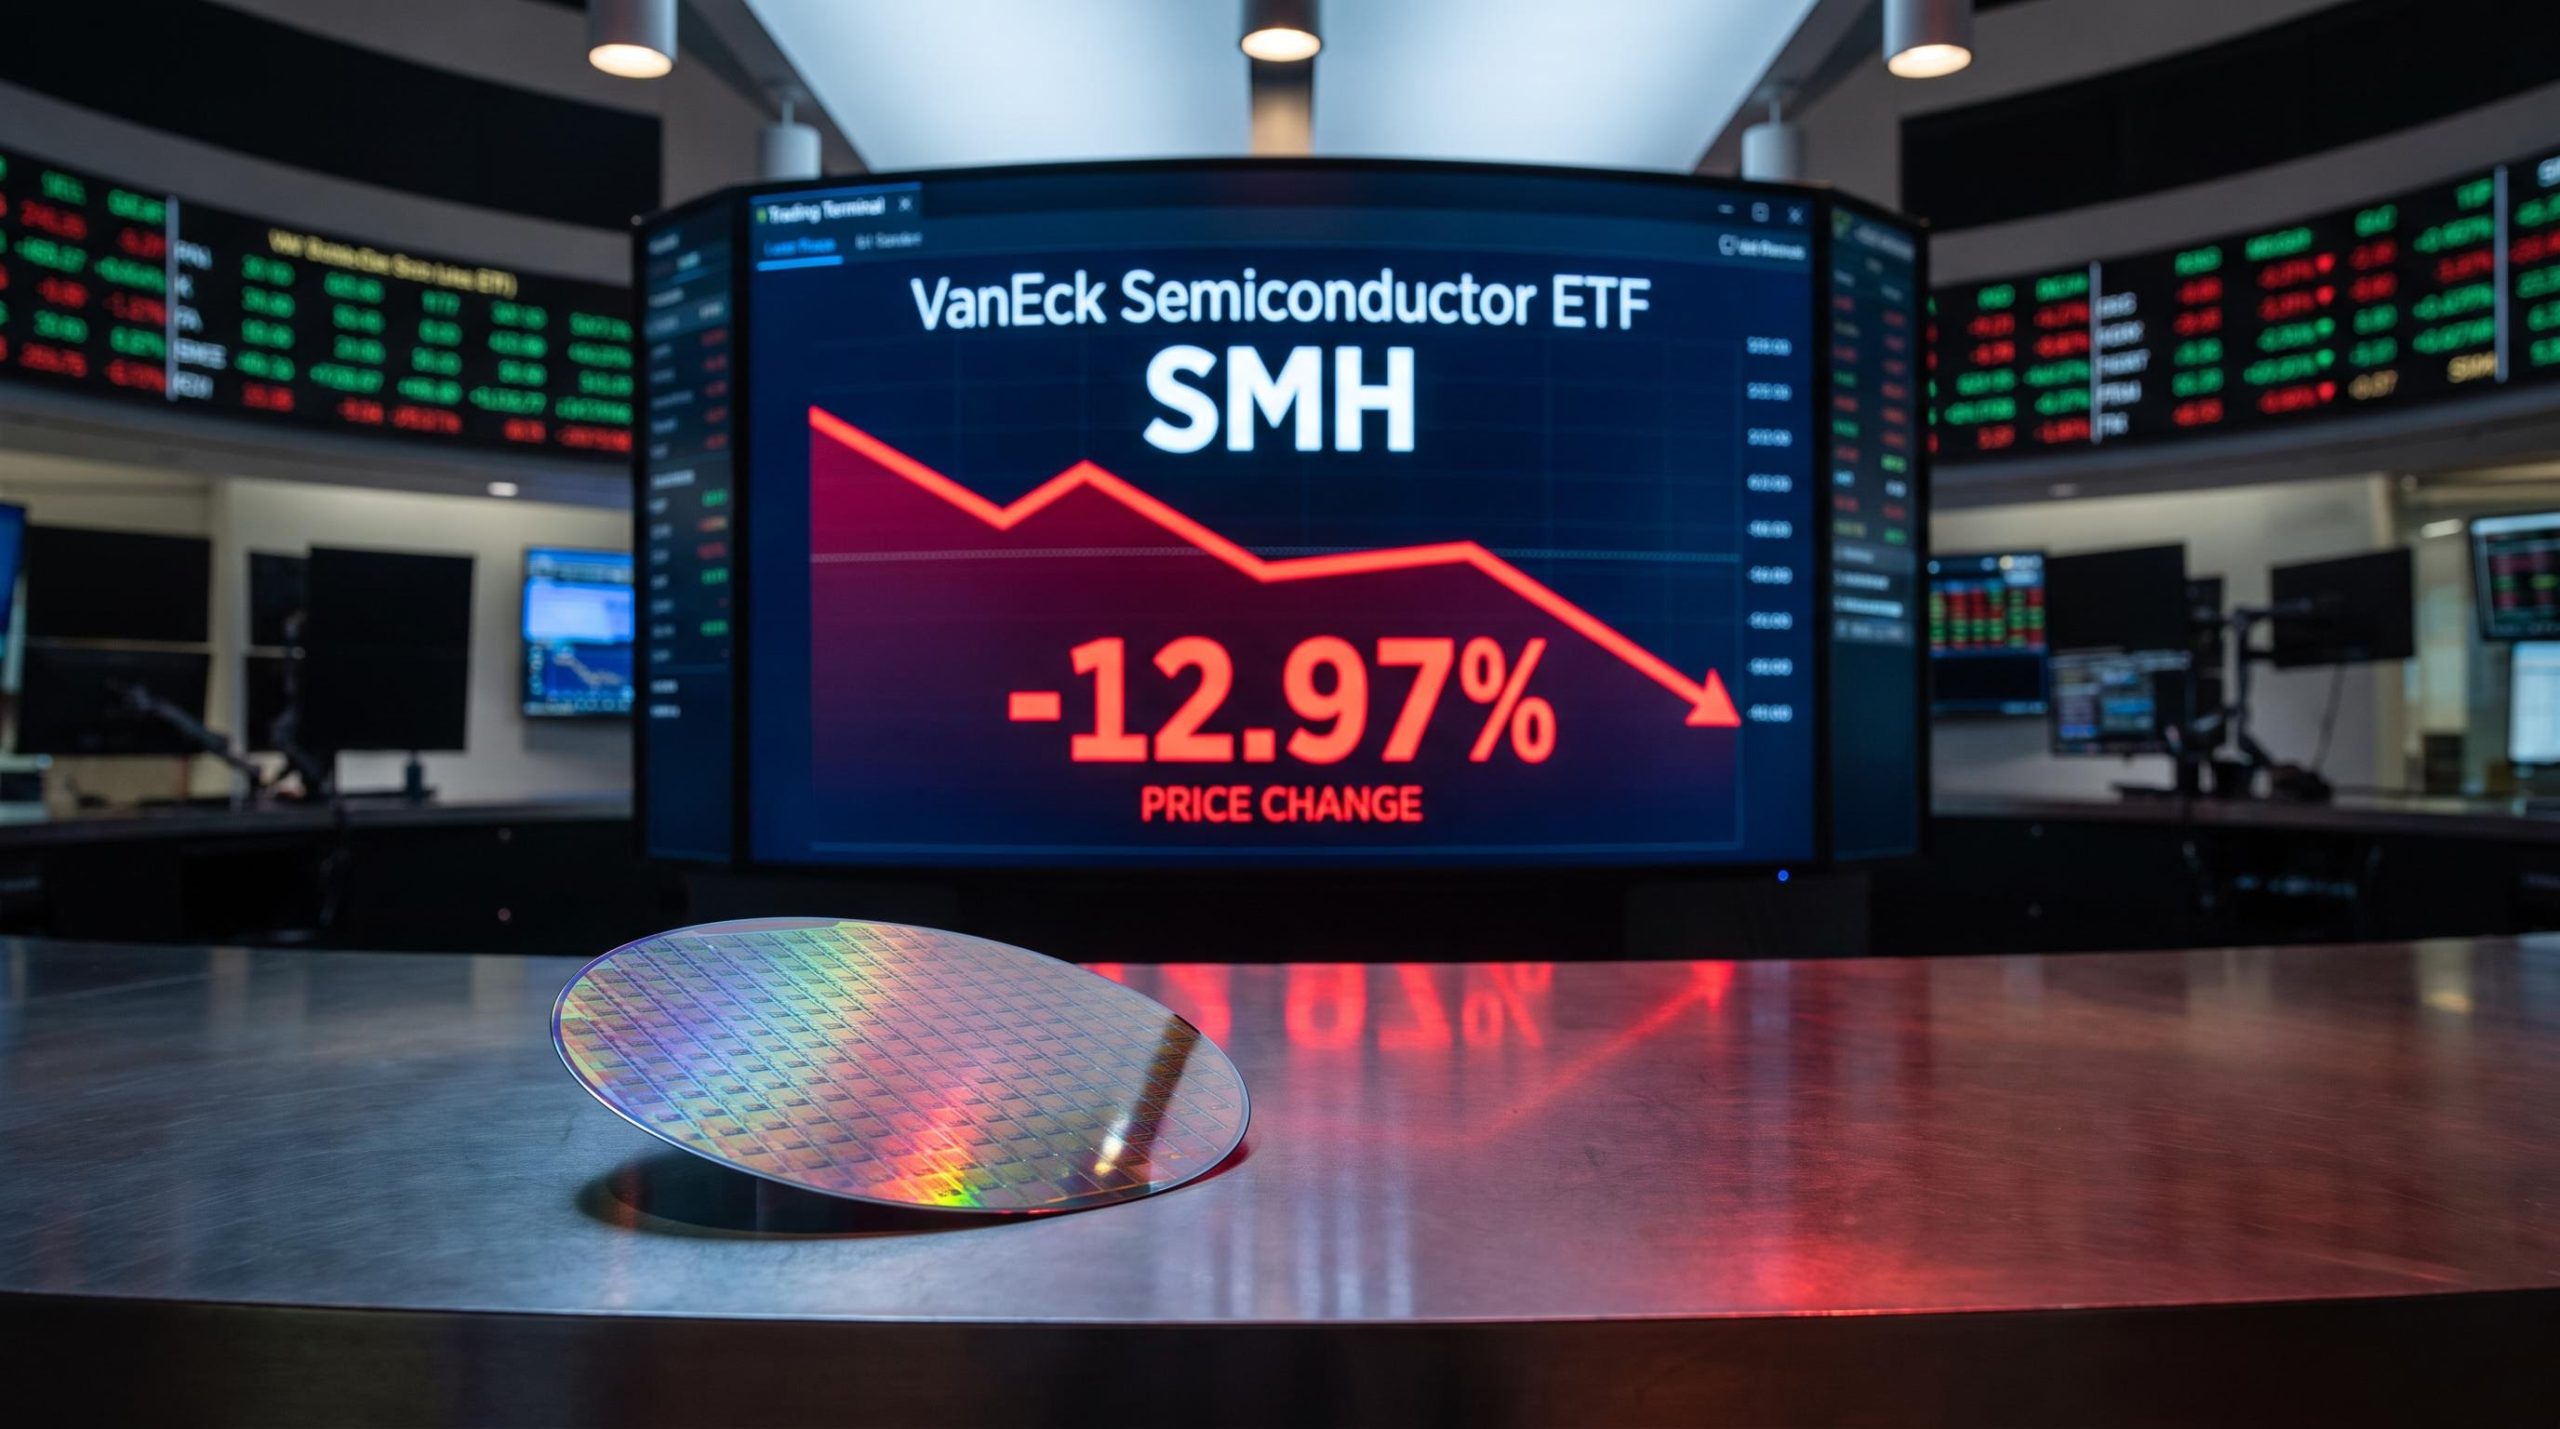
The U.S. Treasury ran a bond-buying programme roughly three times its usual size, and the market answered with a single day of gains before the decline picked up right where it left off. When direct government intervention cannot stop yields from rising, a question surfaces that many investors have never had to sit with: what rules still apply?
The 10-year Treasury yield is hovering just below 5%, a level last seen in late 2023. The instruments a lot of investors treat as portfolio ballast, long-duration bond funds, investment-grade corporate bond ETFs, and utility stocks, are all trending lower at the same time.
Treasury Secretary Scott Bessent’s expanded buyback programme was supposed to ease the pressure. The first expanded operation drew weaker-than-expected participation, and yields kept climbing.
Here is a clear framework for thinking through what this rate environment means for your specific holdings, and what the evidence-backed responses actually look like. This covers why the intervention did not work, what is driving yields to these levels, how it lands on the instruments you may hold, and what the institutional playbook recommends when yield control is no longer a safe assumption.
Why the Treasury’s bond-buying programme didn’t move the needle
Here is the apparent paradox: the government became a buyer of its own long-term debt, and prices fell anyway. Once you understand the mechanics, the failure stops looking mysterious and starts looking predictable.
The Treasury Department announced plans to lift purchases of longer-term debt to as much as $6 billion per operation, approximately three times the customary size. On paper, that sounds substantial. Against the actual scale of the market, it is a rounding error.
That is the core problem. Gross issuance of marketable U.S. debt runs into the hundreds of billions annually, so a $6 billion-per-operation expansion is incremental rather than transformative. The market treated it accordingly.
The Treasury buyback program objectives, as documented by the Treasury Department itself, center on liquidity support and cash management rather than yield suppression, which is why scaling operations threefold still cannot function as a yield-control mechanism the way quantitative easing did.
The reaction told the story. Bond prices rallied for a single day after the announcement, then resumed their decline. Following the first expanded operation, the 10-year yield moved toward 4.97%, still near its highest levels since October 2023.
Three mechanical reasons explain why the intervention fell short:
- Scale versus supply: $6 billion per operation is trivial against hundreds of billions in annual gross issuance, so it cannot shift the balance of supply the market must absorb.
- Forward-looking pricing: Bond prices reflect expectations about future fiscal trajectory and debt supply, not just today’s buying activity. A one-day operation does not change tomorrow’s issuance calendar.
- No shift in fiscal expectations: Buybacks at this size do nothing to alter what investors believe about deficits, so the compensation they demand for holding long debt stays put.
This aligns with a body of academic work on how long-term yields are set.
Research including work by Robin Greenwood and Samuel Hanson argues that the term premium, the extra yield investors demand for holding long-dated debt, is driven by persistent supply, risk, and policy uncertainty. Modest, one-off purchase operations do not move it.
Here is what this means for you. Treasury operations at this scale are a debt-management and refinancing tool, not a yield-control mechanism. If you see another buyback headline and read it as a signal that yields are about to fall, you are misreading the instrument. This is not quantitative easing, and it should not be traded as though it were.
When big ASX news breaks, our subscribers know first
Where yields actually are, and what got them here
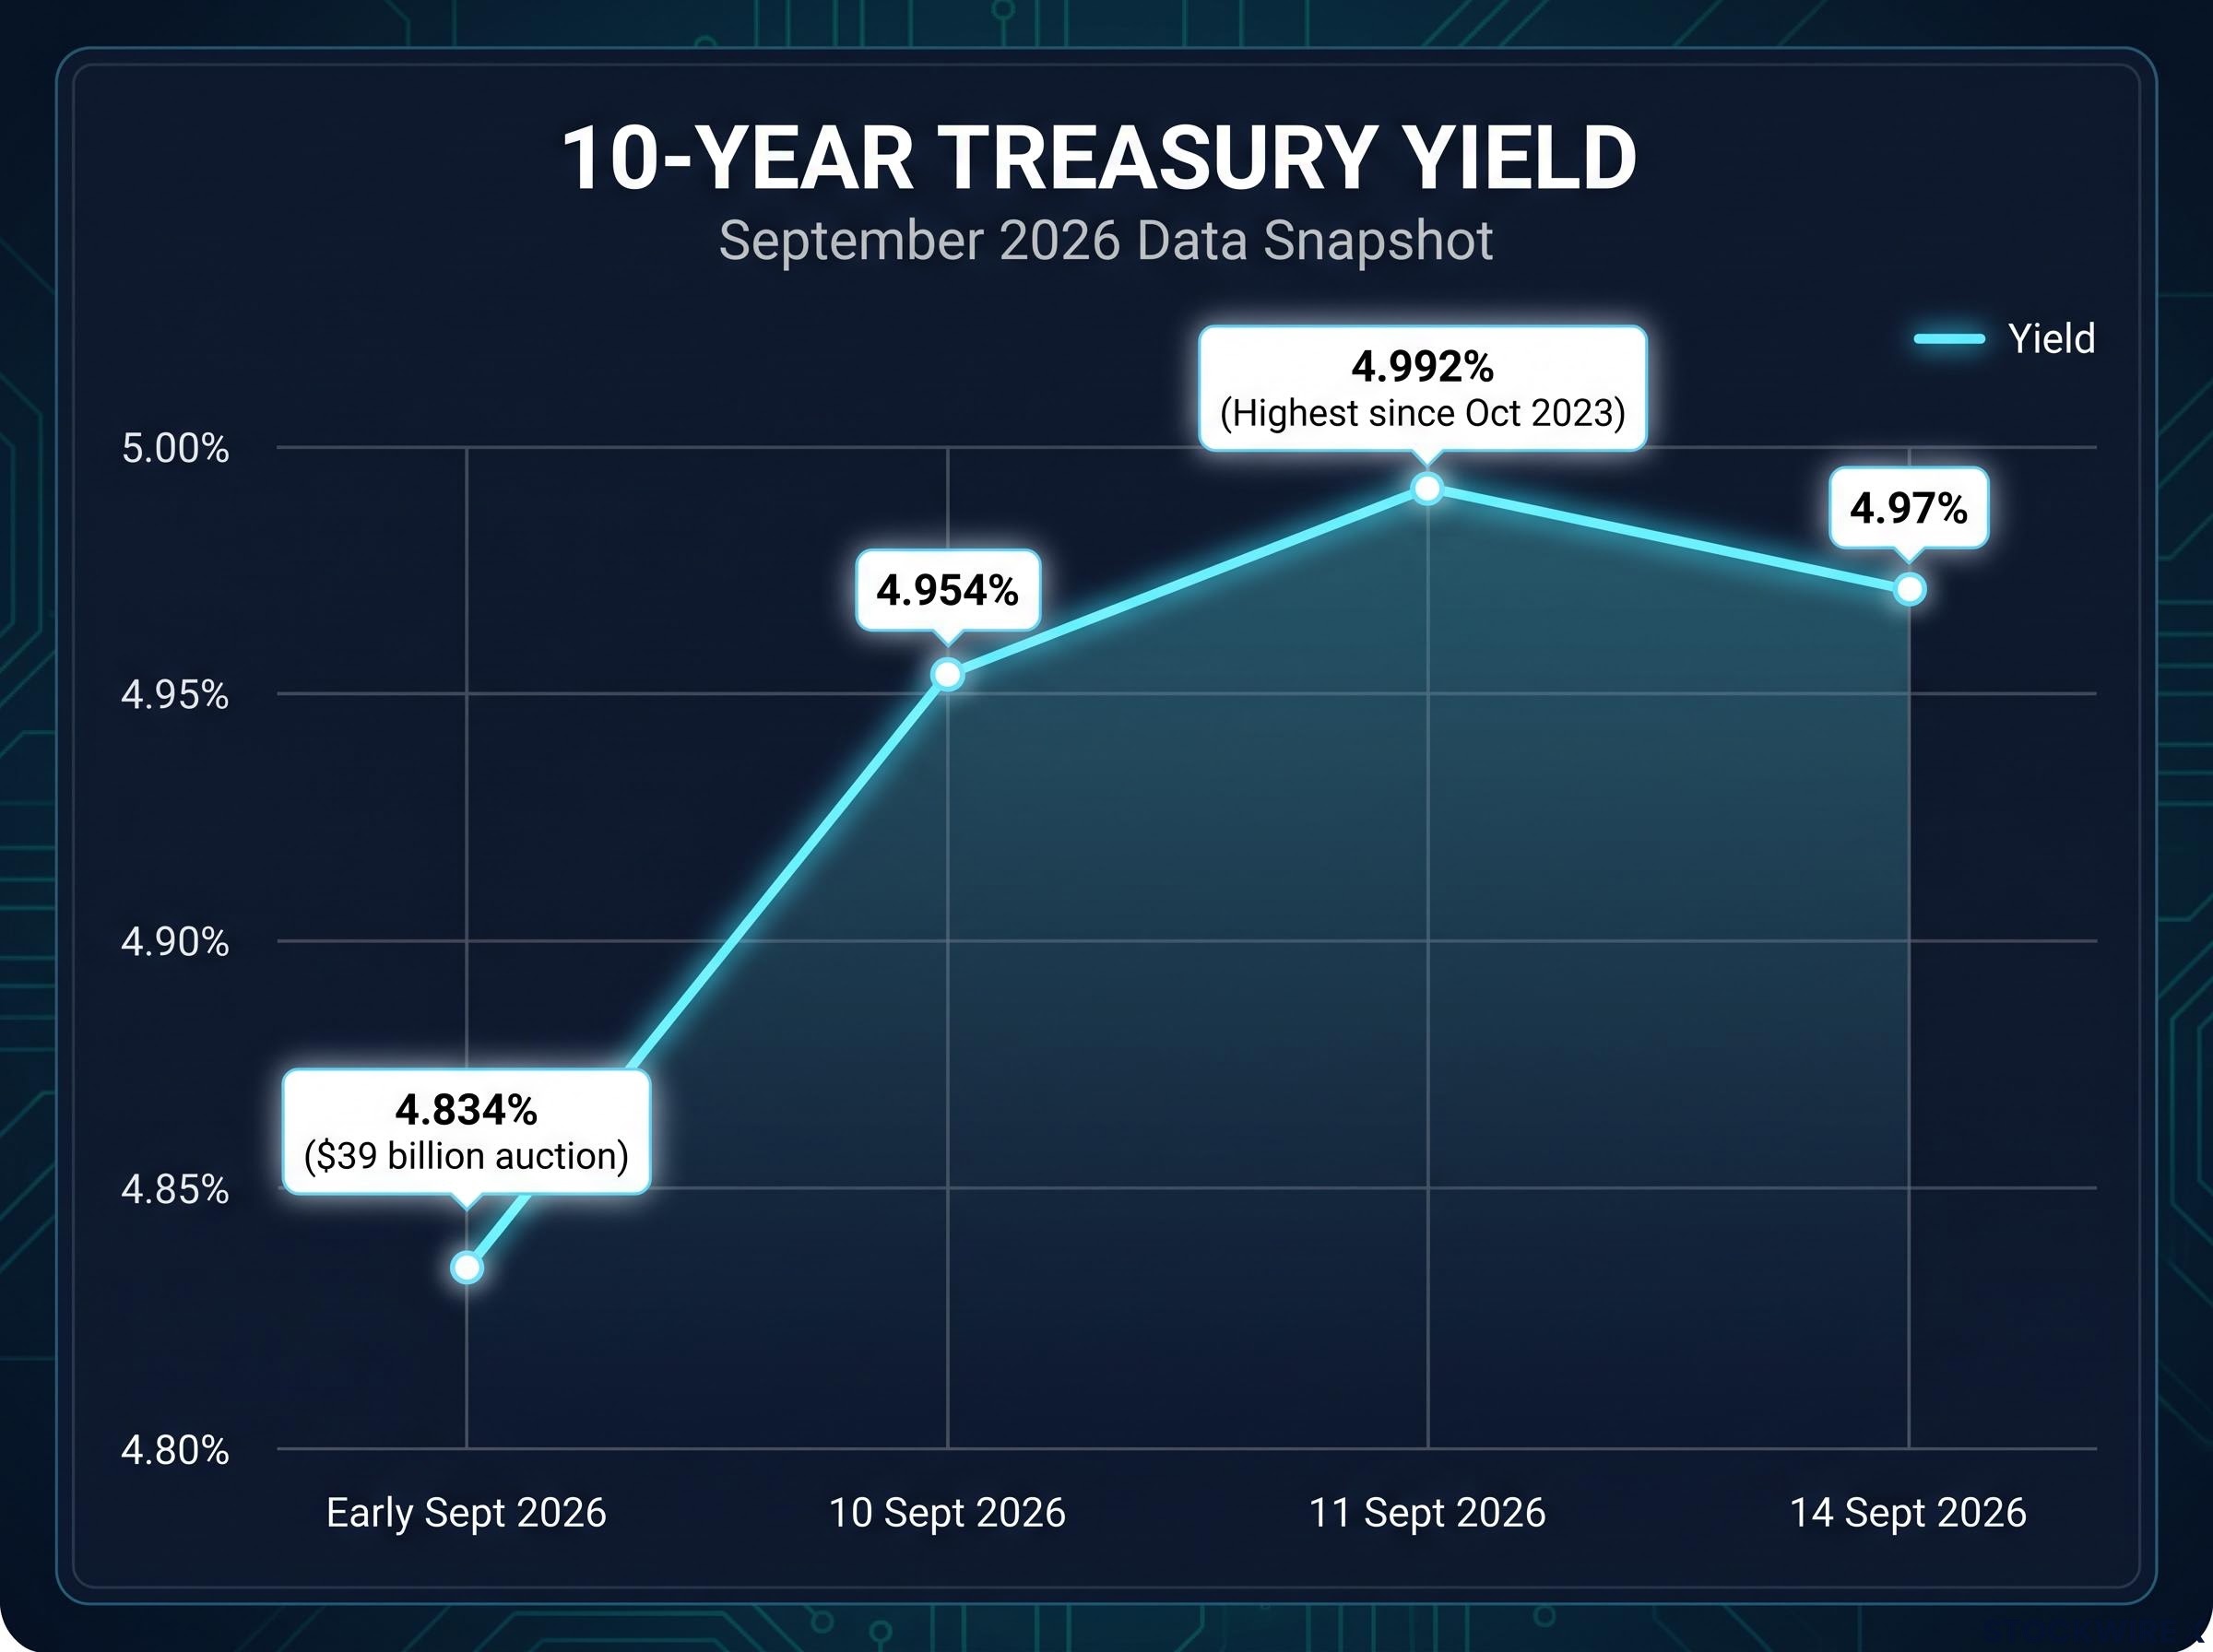
Start with the numbers, because the level itself is the story. In mid-September 2026, the 10-year Treasury yield touched 4.954% on 10 September, briefly reached 4.992% on 11 September, and sat at 4.97% on 14 September per Trading Economics. Each reading was described as the highest since October 2023.
That is roughly 0.24 percentage points above where the 10-year traded a month earlier. This is not a blip. It is a level that has held.
Two cyclical forces drove the most recent spike. The first is energy: rising oil prices tied to U.S.-Iran geopolitical tensions pushed near-term inflation expectations higher, and CNBC linked the 10-year’s move above 4.9% directly to that oil surge feeding inflation fears.
The second is policy. Fed Chair Kevin Warsh delivered hawkish remarks that added fuel to the move.
Warsh stated that inflation had not meaningfully slowed and suggested policymakers may have “work to do,” a message that pushed yields toward the 4.7% to 4.85% range and reinforced the upward pressure already in the market.
Here is where the picture gets more serious. In early September 2026, the Treasury sold $39 billion in 10-year notes at 4.834%, and the auction drew strong demand. Yet yields stayed elevated regardless.
| Date (2026) | 10-Year Yield | Primary Driver |
|---|---|---|
| Early September | 4.834% (auction) | Strong demand, term premium held |
| 10 September | 4.954% | Oil surge, inflation fears |
| 11 September | 4.992% | Highest since October 2023 |
| 11 September (FRED) | ~4.95% | Sustained elevated level |
| 14 September | 4.97% | Warsh hawkish signal, oil |
That auction detail is the one to sit with. Strong demand did not pull yields materially lower, which tells you the problem is not a shortage of buyers. Buyers are willing; they simply require a higher price of admission than they used to, in the form of a fatter term premium. That distinction matters, because it shapes how long this level is likely to persist.
The structural versus cyclical debate: which type of rate environment are we actually in?
Two camps are arguing over the same yield chart, and both have a serious case. This is not an academic squabble. Which side is right determines what a rational investor should do with a bond allocation right now.
The structural case: deficits, term premia, and fading central-bank support
The structural camp sees the 2025 to 2026 rise as a regime shift, not a passing spike. Persistent fiscal deficits and heavy issuance require progressively higher yields to clear the market, even when the Treasury conducts buybacks or tweaks auction sizes.
Demand is also thinning at the structural level. Fading foreign reserve accumulation and ongoing quantitative tightening leave a larger share of long-term debt in private hands, and private buyers want more compensation for duration and inflation risk than central banks ever did.
Major fixed-income managers back this reading. According to positions from PIMCO and BlackRock, large fiscal deficits, quantitative tightening, and reduced central-bank demand keep the term premium positive and elevated, making long-duration yields structurally less responsive to conventional intervention.
The distinction between a term premium story and a re-acceleration of inflation expectations is central to reading what yields are actually signalling: when market yields do the tightening, the Fed faces less pressure to act directly, but the compression risk that follows any diplomatic or energy-price resolution becomes the key asymmetric exposure to monitor.
The cyclical case: oil, geopolitics, and Fed signals
The cyclical camp keeps its focus near-term. The August to September 2026 yield spikes tie repeatedly to oil price surges, geopolitical tension, and hotter-than-expected core CPI, not to deficit announcements.
The logic runs forward from there. Once energy prices normalise, inflation data cools, and the Fed nears the end of its tightening, yields could retreat meaningfully. Market pricing implied roughly a 64% probability of a 25-basis-point Fed rate hike during this period, though that figure is flagged as unverified and should be read as a directional signal rather than a confirmed number.
The limit of the cyclical view is telling: the fact that buybacks failed lends circumstantial support to the structural side.
| Structural Camp | Cyclical Camp |
|---|---|
| Persistent deficits force higher clearing yields | Yield spike tied to oil and geopolitics |
| Fading foreign and central-bank demand | Hotter core CPI, near-term data |
| Elevated, positive term premium (PIMCO, BlackRock) | Fed tightening expectations, reversible |
| Structurally higher floor than the 2010s | Mean-reversion once drivers fade |
Here is why this matters to you directly. Most retail investors are quietly positioned for the cyclical scenario: they expect yields to drift back down and bond funds to recover, so they hold and wait. The structural case is strong enough that treating long duration as a patient hold carries more risk than the conventional wisdom admits. If the structural read is correct, buying long bonds here is premature rather than opportunistic.
What higher yields are doing to the specific instruments in your portfolio
Abstract yield levels only matter when you can map them to line items you actually own. So look at the four rate-sensitive instruments doing the damage, and the specific way each one is behaving.
Long-duration Treasuries are the most exposed. TLT, the iShares 20+ Year Treasury Bond ETF, declined after its brief one-day rally following Bessent’s announcement, and its large duration means even modest yield shifts translate into multi-percentage-point price drops. IEF, the iShares 7-10 Year Treasury Bond ETF, was also sinking; less duration than TLT, but meaningfully exposed all the same.
Bond duration is the single number that determines how much of that price move lands in your account: a fund with a duration of 17 loses approximately 17% in price for every one-percentage-point rise in yields, which is why TLT and IEF respond so differently to the same yield shift.
Investment-grade corporates carry a second layer of risk. LQD, the iShares iBoxx Investment Grade Corporate Bond ETF, broke down beneath a well-defined topping pattern. It faces two channels at once: Treasury duration risk plus spread-widening risk, and the 2022 episode showed both can fire simultaneously, challenging the idea of IG corporates as safe income.
Then there are the bond-proxy equities. XLU, the Utilities Select Sector SPDR ETF, breached the midline of a multi-decade ascending channel.
The XLU channel breach is described in market commentary as opening the door to substantially lower prices. The mechanism is valuation compression: as the risk-free rate climbs, investors demand higher dividend yields or lower price-to-earnings multiples, which pulls the price down even when underlying earnings hold steady.
| Instrument | Primary Risk Channel | Signal Observed |
|---|---|---|
| TLT (20+ yr Treasury) | Duration | Declined after one-day rally |
| IEF (7-10 yr Treasury) | Duration (moderate) | Sinking post-announcement |
| LQD (IG corporate) | Duration plus spread | Broke below topping pattern |
| XLU (utilities) | Valuation compression | Breached multi-decade channel midline |
Here is the uncomfortable read. The simultaneous breakdown across TLT, IEF, LQD, and XLU means there is no rate-sensitive hiding place right now. Credit quality does not insulate LQD, and equity defensiveness does not protect XLU, because the driver is the risk-free rate itself.
You may file these into separate mental buckets, bonds versus bond-proxies, short versus long duration. In a sustained rising-yield regime, the correlation across all of them converges toward one. The 2022 sell-off proved a 60/40 portfolio can lose on both sides at once, which is a real sequence-of-returns problem if you are close to or in retirement.
How institutional investors are repositioning when yield control is off the table
With long yields elevated and Treasury operations perceived as insufficient, institutional strategists are re-engineering interest-rate exposure rather than waiting for a buyback programme to cap yields. Treat what follows as a set of reasoned trade-offs, not a prescription, and assess which pieces fit your own situation.
- Shorten duration. Shift toward shorter-maturity Treasuries and high-quality short-term corporates, which move far less on long-rate swings; short-term rates remain elevated from Fed tightening while the 10-year approaches 5%, so you capture carry without the extreme price risk.
- Allocate to TIPS. Treasury Inflation-Protected Securities defend real purchasing power against inflation-driven rate shocks, and PIMCO and BlackRock have advocated this approach in regimes of elevated inflation uncertainty; the trade-off is weaker returns if inflation surprises to the downside.
- Consider floating-rate instruments. Notes and loans whose coupons reset with policy rates benefit from the current high short-rate environment without locking in long-duration price risk; the caveat is that credit and liquidity risk must be actively managed.
- Diversify with real assets and growth equity. Commodities, infrastructure, and earnings-growth-driven equity sectors are less correlated with the level of long rates, which counterbalances utilities and defensives that de-rate as yields climb.
- Build a barbell. Combine short-duration, high-quality bonds with a smaller long-duration allocation, capturing carry now while keeping optionality for a future recession or policy reversal.
TIPS real yields near 3.05% on 30-year maturities place investors in the top quartile of real yield opportunity since 2000, which is why PIMCO and BlackRock have advocated the TIPS allocation as a way to capture inflation protection without the sovereign accumulation dynamics that are driving gold beyond what domestic CPI alone would justify.
The barbell approach: retaining optionality without committing to duration
The barbell works because it refuses to pick a side. The short-duration, high-quality bonds give you carry and flexibility today, while the smaller long-duration slice pays off if yields eventually fall during a downturn or policy reversal.
This is the structure to reach for precisely because the structural-versus-cyclical debate is unresolved. It does not bet on one outcome; it explicitly acknowledges the uncertainty and positions for either.
Here is the takeaway from the institutional consensus. The burden of proof has shifted. Holding long-duration assets as a core, patient position now requires an explicit thesis about when and why yields will fall, rather than being the default setting of a diversified portfolio.
What the intervention failure changes, and what it does not
Step back from the individual data points and the recalibration is straightforward. Something genuinely changed, and a fair amount stayed exactly the same.
What changed: the assumption that Treasury operations can reliably anchor long-term yields no longer holds. With the 10-year near 5%, its highest since late 2023, and buybacks at $6 billion per operation failing to arrest the trend, rate-sensitive assets should be treated as carrying more correlated risk than their labels suggest.
What did not change: the inverse relationship between price and yield still operates. The mechanics of duration risk are unchanged, and diversifying across different types of rate sensitivity still works. The tools in your kit are the same; the environment they operate in is what shifted.
Long-duration assets would become more attractive again under one of two conditions: either cyclical forces such as oil and inflation reverse and the Fed signals a pause or a cut, or the structural debate resolves toward a lower-deficit path. Neither is settled yet, which is why the honest answer is a watch-list rather than a verdict.
The variables worth monitoring:
- Core CPI trajectory: A sustained cooling would strengthen the cyclical case and open the door to lower yields.
- Oil and energy prices: Falling energy costs would remove one of the clearest drivers of the recent spike.
- Fed Chair Warsh’s forward guidance: A softer tone would ease the near-term policy pressure on the long end.
- U.S. fiscal deficit projections: A credible lower-deficit path is the key structural signal to watch.
- Treasury auction and buyback participation: Weak participation confirms the market is still demanding higher term premia.
The overarching shift is this: long-duration assets have moved from core holdings to tactical positions. Holding them now requires an explicit thesis about when yields fall, not the old default assumption that they eventually will.
For investors weighing whether to hold or reposition intermediate-duration bond funds in this environment, our deep-dive into how investor behaviour shapes bond outcomes in rising-yield cycles shows how one behavioural decision compounded into a $38,000 five-year gap across three investors facing identical yield conditions.
This article is for informational purposes only and should not be considered financial advice. Investors should conduct their own research and consult with financial professionals before making investment decisions. Past performance does not guarantee future results, and financial projections are subject to market conditions and various risk factors.