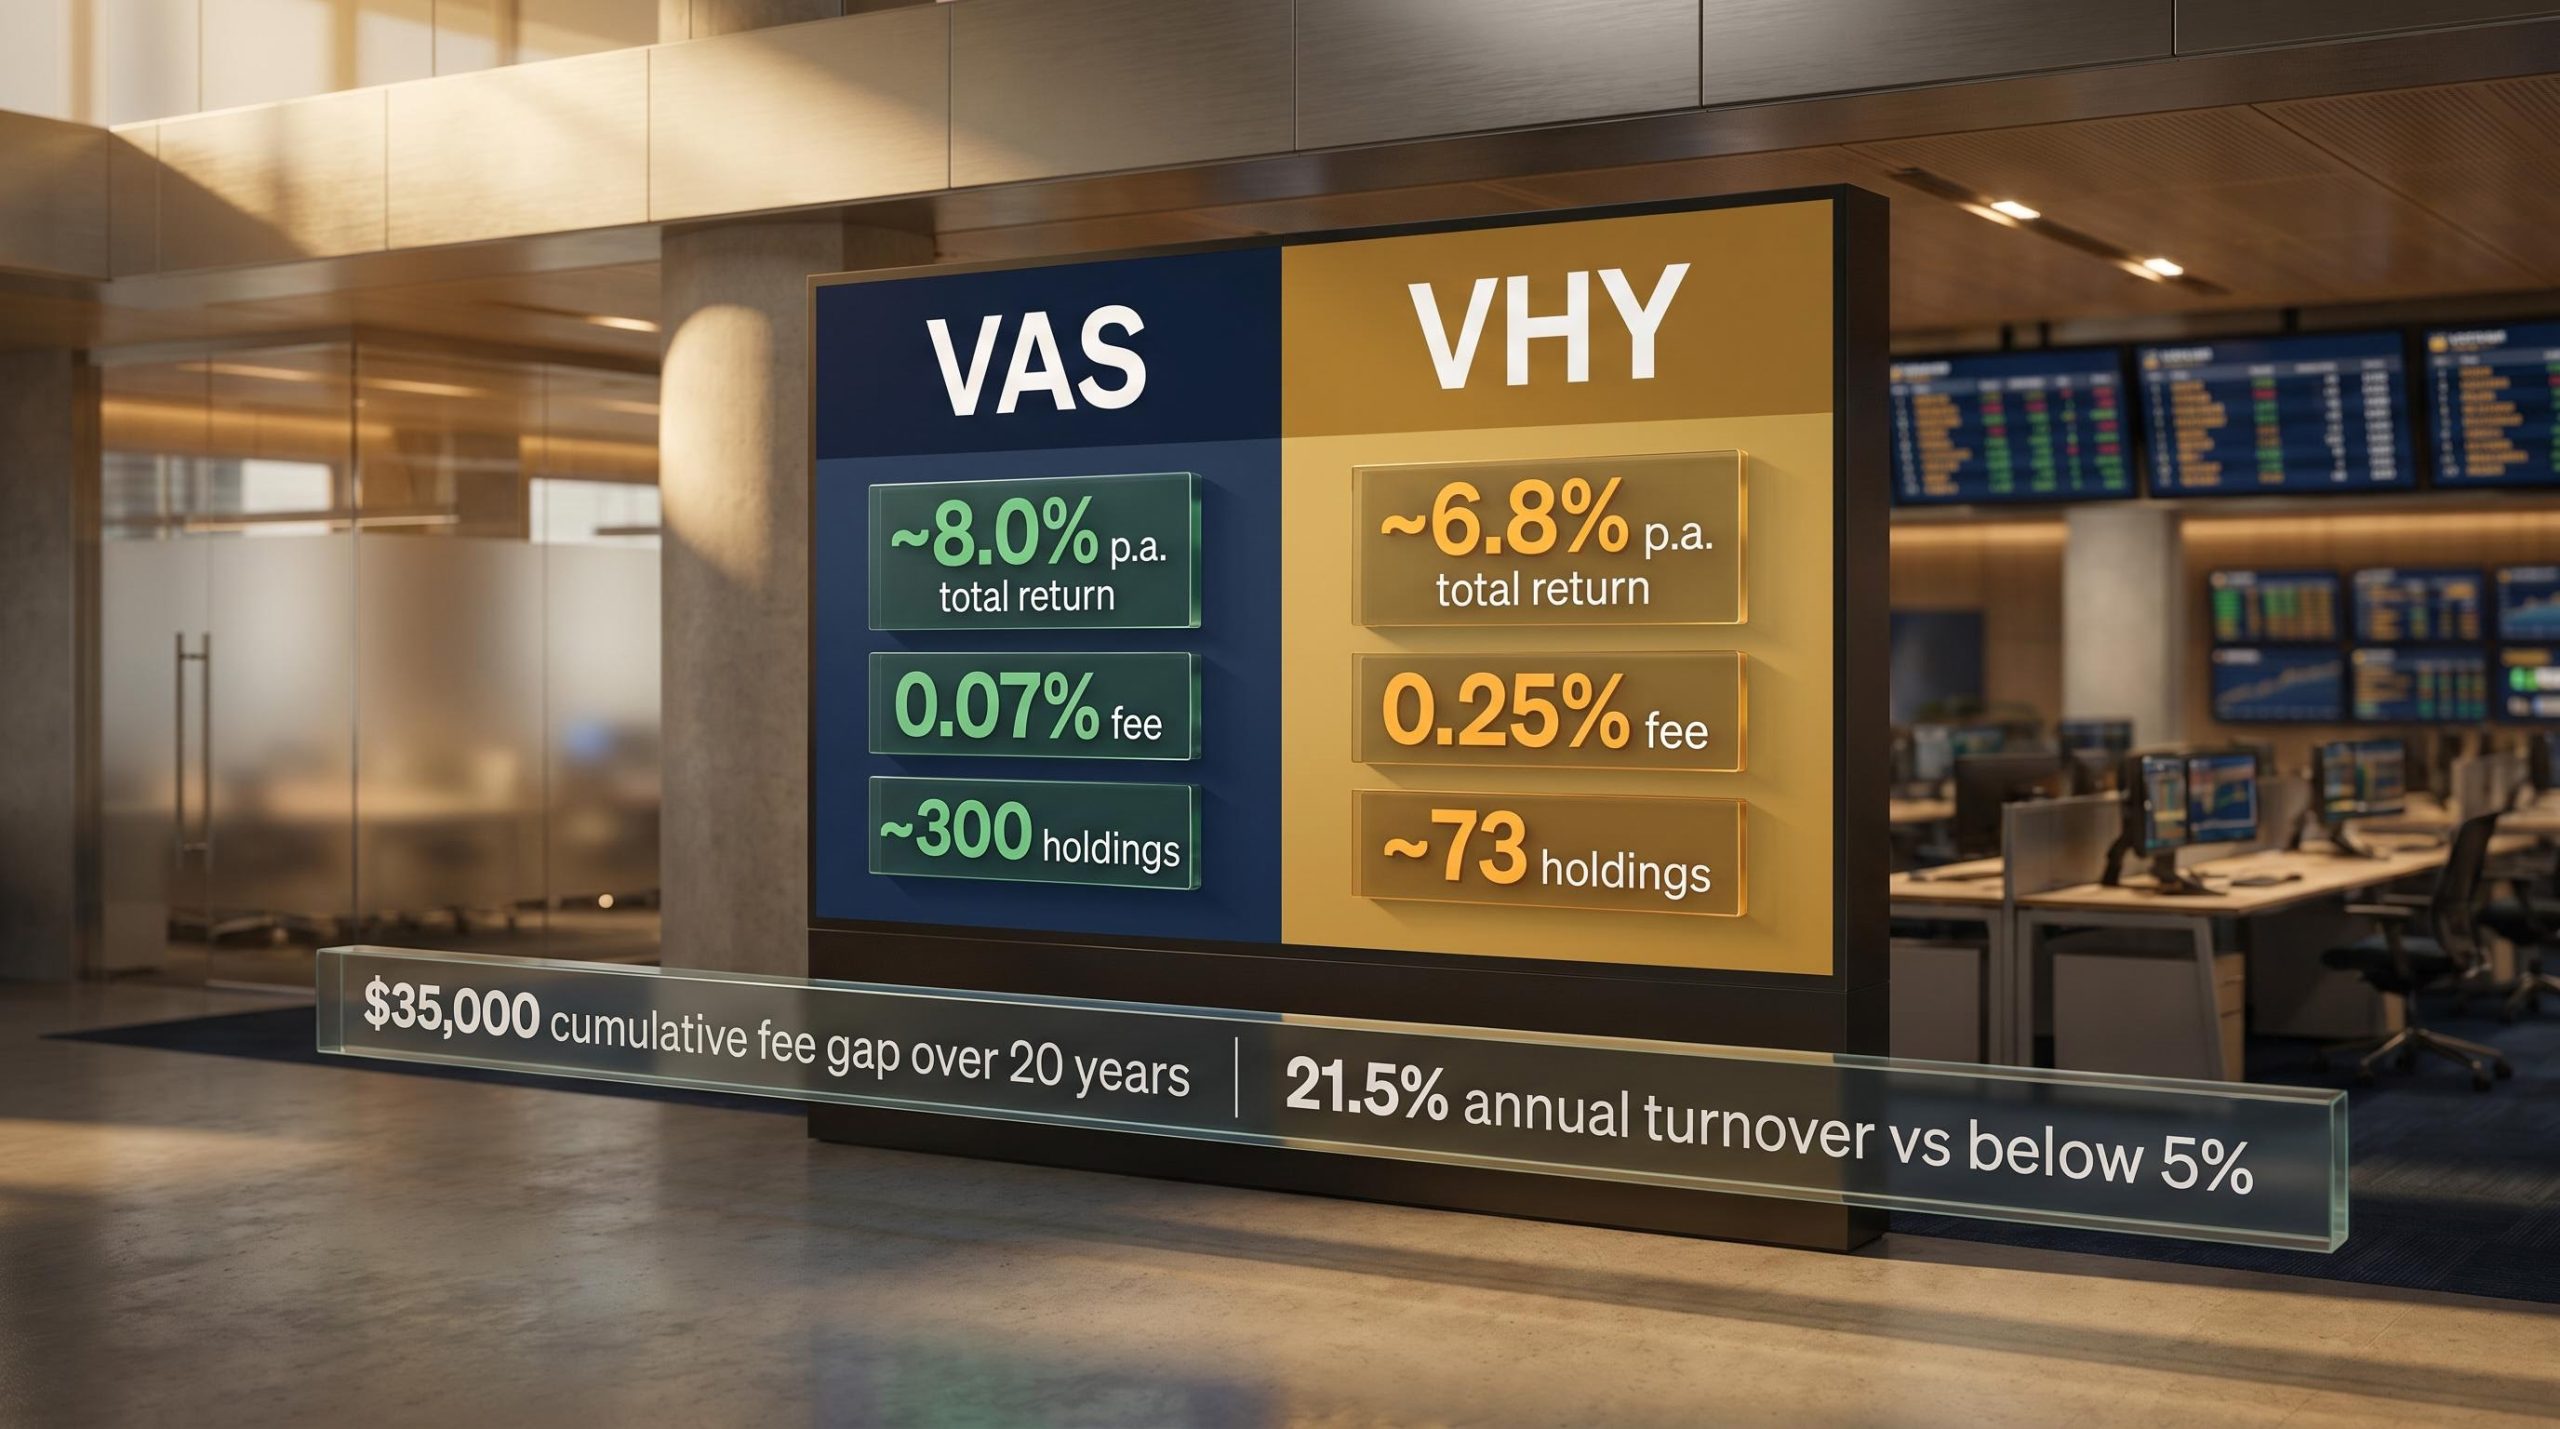
A higher dividend yield does not automatically mean a better retirement fund. Two Australian ETFs can hold many of the same companies, pay very different levels of income today, and yet the one with the lower yield can leave a retiree with substantially more wealth after 20 years. Vanguard Australian Shares Index ETF (VAS) and Vanguard Australian Shares High Yield ETF (VHY) are the case study.
Tens of thousands of Australian retirees face this exact question. VHY pays roughly double the headline yield of VAS, and that cash-in-hand difference feels significant when a salary no longer arrives each fortnight. The instinct to choose the fund that deposits more into your bank account every quarter is entirely understandable.
But the instinct may be wrong. Jamie Nemtsas, founder of retirement-focused advisory firm Wattle Partners, conducted a 15-year performance review of both funds, published in The Golden Times, and his findings challenge the assumption that higher yield equals better retirement outcome. Here is the evidence-based framework for deciding which of these two funds is more likely to support a 25-30-year retirement, not just the next quarterly distribution.
The yield gap is real, but it does not tell the whole story
On a $500,000 retirement portfolio, the income difference between these two funds is tangible. VHY, yielding approximately 5-6%, delivers roughly $25,000-$30,000 per year in distributions. VAS, yielding approximately 3.1-3.6%, delivers roughly $15,500-$18,000. That is a gap of up to $12,000 a year in cash income.
The question is where that extra income comes from. VHY tracks the FTSE Australia High Dividend Yield Index and holds approximately 73 securities. VAS tracks the S&P/ASX 300 Index and holds approximately 300. VHY’s elevated yield is generated through two specific mechanisms:
- Higher payout ratios among its screened companies, meaning those businesses distribute a greater share of earnings and retain comparatively little capital for reinvestment and compounding growth.
- A yield-screen methodology that systematically directs capital toward shares where a high dividend relative to a depressed price is the attraction, a situation that frequently signals weakening business prospects rather than a genuine opportunity.
Total return, not yield alone, is the correct lens for evaluating a retirement ETF. Total return captures both the income you receive and the capital growth (or erosion) underneath it. A fund paying 6% while your capital shrinks is not outperforming a fund paying 3.5% while your capital grows.
The total return lens matters here because a dividend payment does not create new wealth: when a company pays out cash, its share price falls by approximately the same amount on the ex-dividend date, leaving the investor’s total position unchanged before tax consequences are applied.
That reframing is the conceptual key to everything that follows. The yield gap gives retirees a real cash advantage with VHY today, but because that gap is partly generated by companies with depressed prices and high payout ratios, it carries embedded risks to both future income and capital that the headline number does not reveal.
When big ASX news breaks, our subscribers know first
What the fee gap costs over a 20-year retirement
VAS charges a management fee of 0.07% per annum. VHY charges 0.25%. The difference is 18 basis points, a figure that looks trivial until you compound it.
Nemtsas at Wattle Partners calculates that the annual cost difference on a $500,000 portfolio amounts to roughly $900, and when that recurring gap is compounded across a full 20-year retirement with reinvestment, the cumulative drag reaches an estimated $35,000.
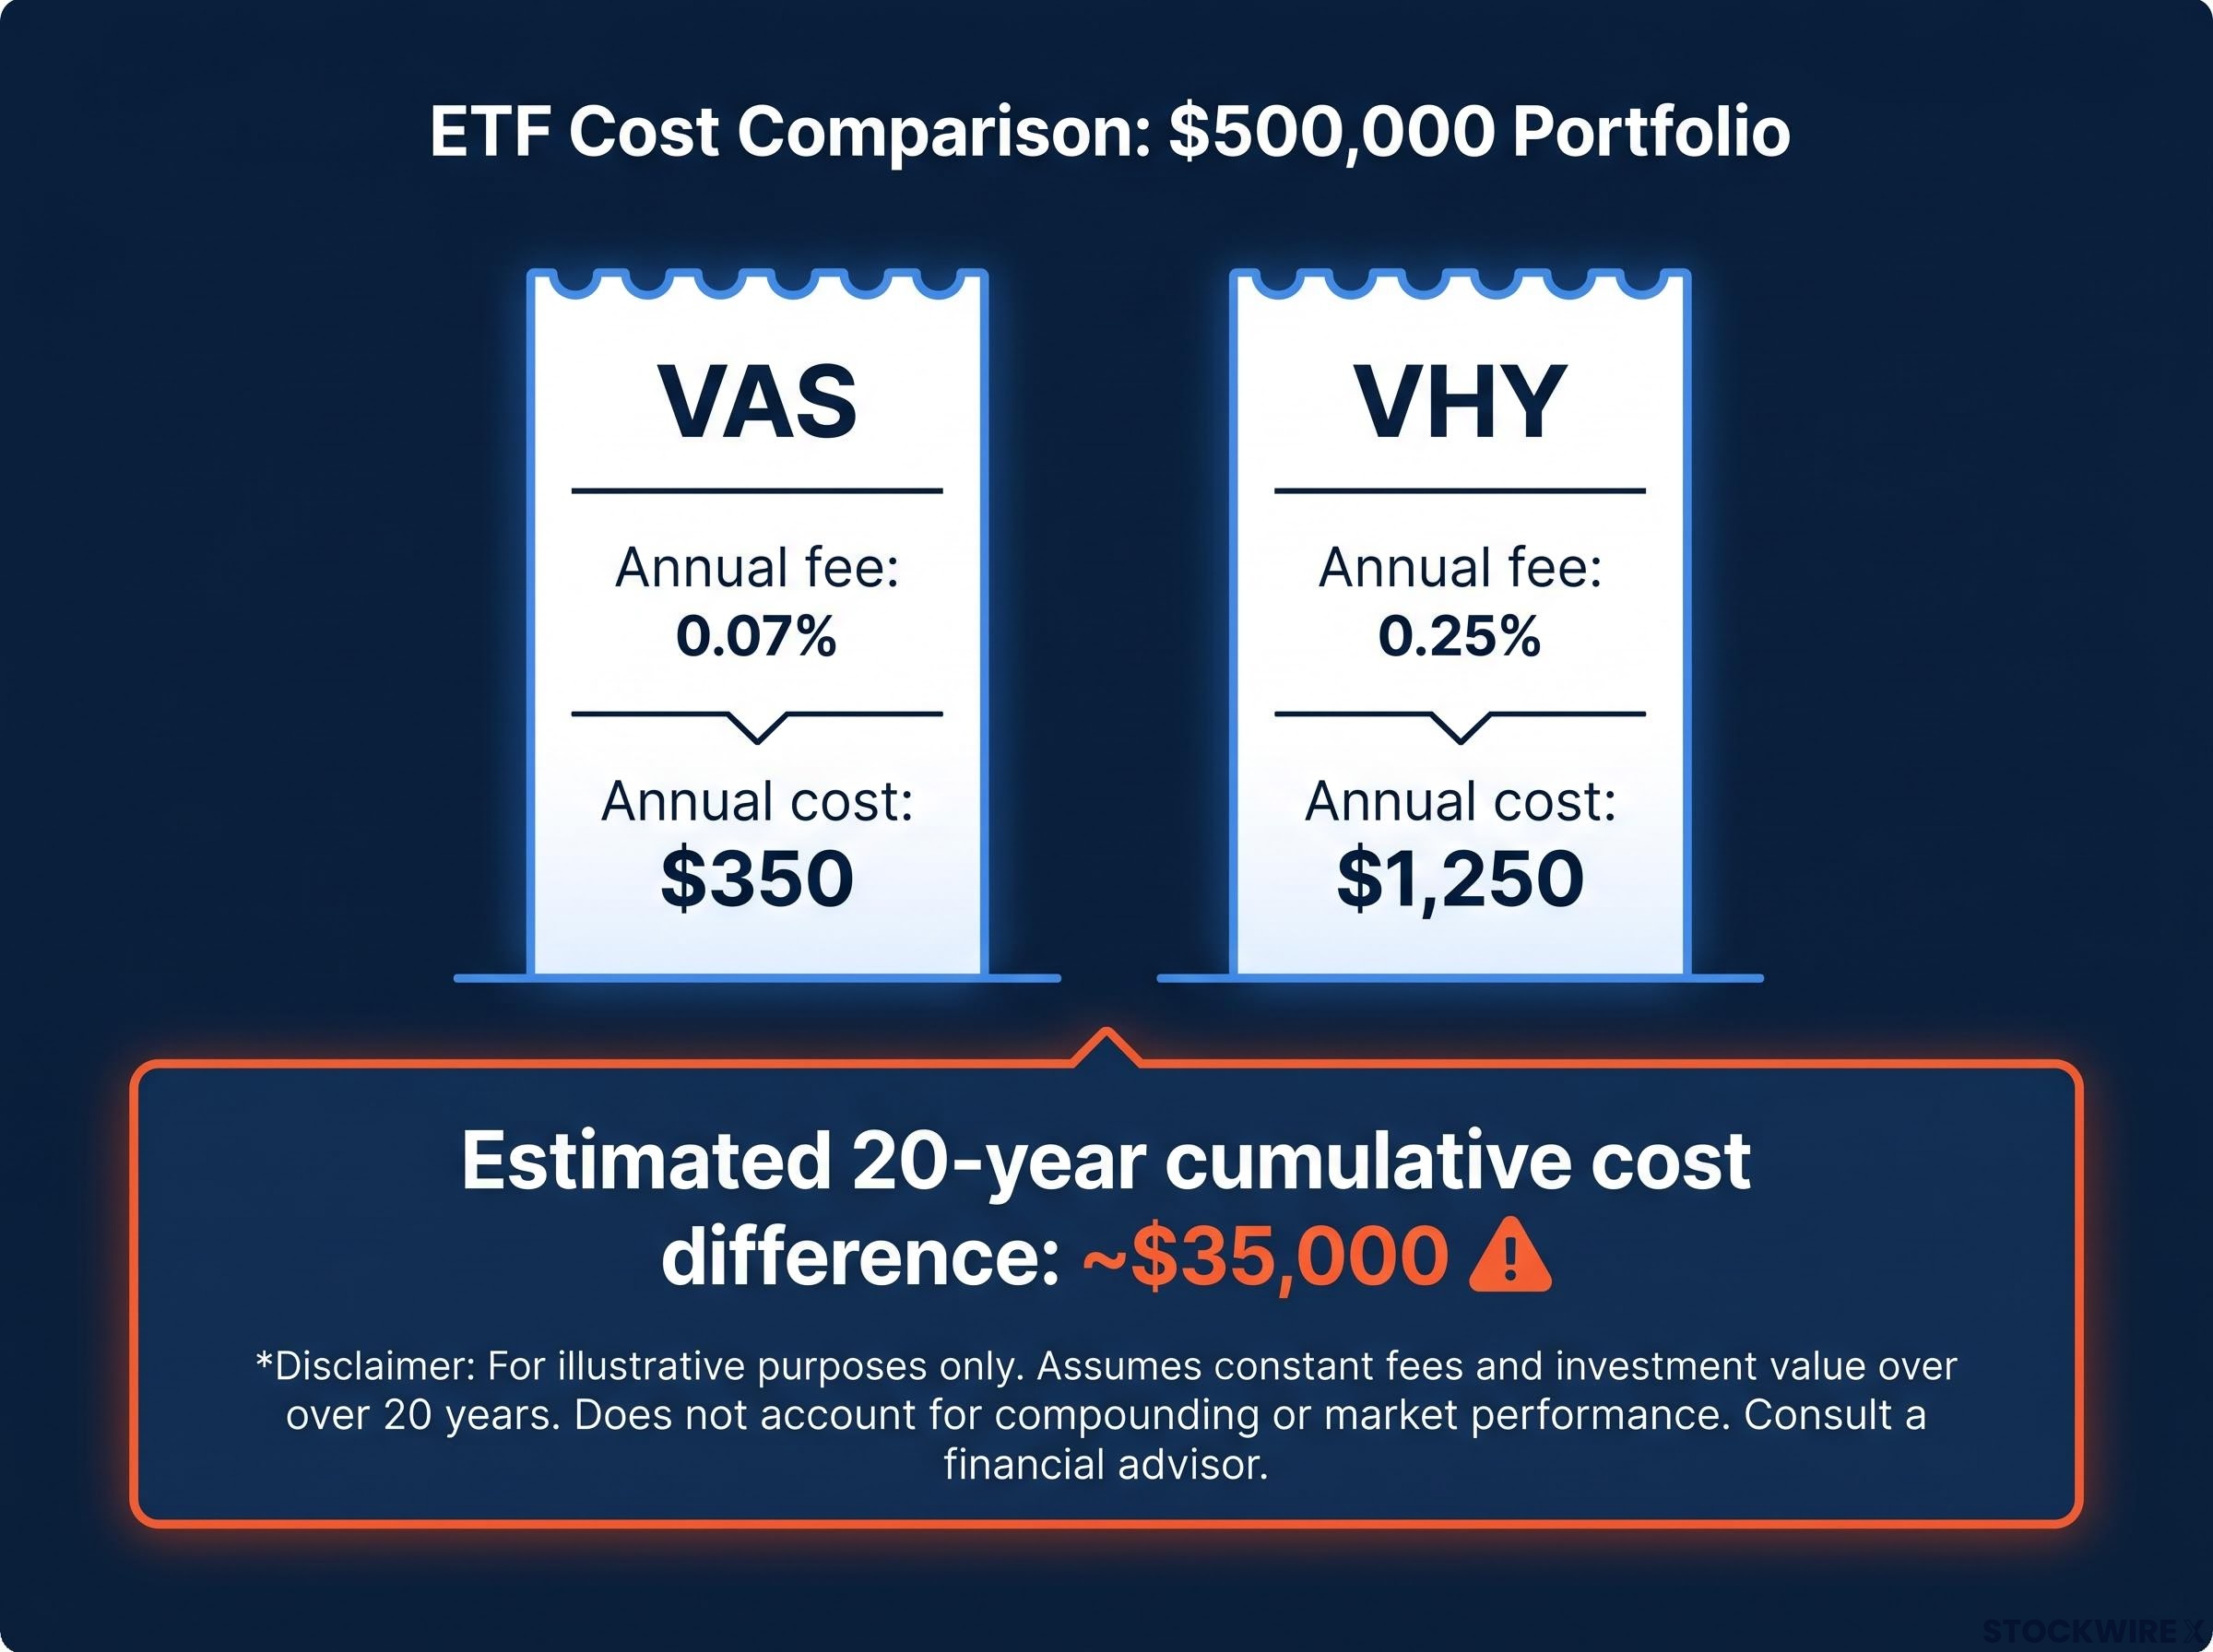
| Fund | Annual fee rate | Annual cost on $500,000 | Estimated 20-year cumulative cost |
|---|---|---|---|
| VAS | 0.07% | $350 | Lower baseline |
| VHY | 0.25% | $1,250 | ~$35,000 more than VAS |
Unlike yield or capital growth, fees are certain and recurring. They are the one guaranteed input in investment outcomes, paid every year regardless of whether markets rise or fall. For a retiree who is no longer contributing new capital, every dollar of unnecessary cost directly reduces the wealth pool supporting their income. That $35,000 is not a rounding error on a fixed income pool; it is roughly 18 months of VAS distributions, paid silently in the background while you watch your quarterly payments arrive.
Concentration risk and what it means when dividends get cut
VAS spreads your capital across approximately 300 ASX-listed companies, weighted by market capitalisation across all sectors. VHY concentrates it in approximately 73, with a structural tilt toward financials and materials driven by the yield-screen methodology.
The structural differences matter most when things go wrong:
- VAS: approximately 300 holdings across all ASX sectors
- VHY: approximately 73 holdings, overweight banks and miners
- VHY applies concentration limits (maximum 40% in any single sector, maximum 10% in any single stock) but excludes REITs entirely
- VHY’s yield screen mechanically directs capital toward sectors where dividend yields are highest, which in Australia means banks and resource companies
On the two occasions in the past decade when BHP reduced its dividend sharply, the broadly diversified VAS absorbed the impact across hundreds of holdings with minimal disruption, whereas VHY carried a meaningfully larger exposure to BHP and felt the income reduction far more acutely.
That is not a hypothetical risk. APRA (the Australian Prudential Regulation Authority, the body that regulates banks) has on multiple occasions imposed capital requirements that compressed bank dividends. When that happens, VHY’s income stream takes a disproportionate hit precisely because the fund’s construction tilts it toward the payers most exposed to regulatory and commodity-cycle pressure.
The concentration in VHY means its income stream is more vulnerable to the specific risks that affect Australian banks and miners. For a retiree seeking income stability across a 25-30-year horizon, that is the wrong risk profile.
The dividend trap mechanics at work inside a yield-screen index are worth examining closely: a rising headline yield frequently signals a falling share price rather than a generous payout, and on the ASX, where payout ratios average 70-75% of earnings against the 45-50% developed-market norm, that dynamic is more prevalent than most income-focused investors expect.
How portfolio turnover quietly erodes after-tax returns
Portfolio turnover measures how frequently a fund buys and sells its holdings. It matters because every sale can trigger a capital gain, and that gain creates a tax event for the investor, whether or not they asked for it.
Here is how VHY’s yield screen generates tax drag:
- A company’s forecast yield drops below the index threshold.
- The fund sells that company’s shares, often at a profit.
- The realised capital gain is distributed to investors.
- The investor receives a tax liability on income they may not have received as cash.
VAS, as a market-cap index tracker, trades primarily when the index composition changes. Its annual turnover sits below 5%. VHY’s rule-based yield screens force more frequent trading: recent data indicates turnover of approximately 21.5% per annum, with earlier estimates citing up to 37%.
Either figure is a multiple of VAS’s turnover, and the tax consequences are real.
Who bears the most tax drag from high turnover
The impact depends on where you hold the fund.
Retirees holding VHY outside superannuation, or in accumulation-phase super, bear the full marginal-rate capital gains tax on those distributed gains. Over years, this tax drag compounds quietly alongside the fee differential, creating a third cost layer that is only visible when the tax return arrives.
Retirees in pension-phase super are more insulated, because earnings in pension phase are generally tax-free. But even pension-phase investors should understand that higher turnover affects distribution patterns and planning complexity. The structural characteristic does not disappear inside super; it simply stops generating a tax bill.
The MoneySmart investing and tax guidance published by ASIC explicitly confirms that investment earnings within pension-phase superannuation are tax-free, which is why the turnover-driven capital gains tax drag that penalises VHY holders outside super does not apply in the same way once a member has commenced a retirement income stream.
For retirees holding VHY outside super, the turnover-driven tax drag sits on top of the fee differential and compounds over years, a cost that VAS’s low-turnover structure largely avoids.
What 15 years of performance data shows about total returns
Nemtsas’ review at Wattle Partners, published in The Golden Times, covered 10-year and 15-year periods that included mining cycles, bank regulatory changes, and the COVID-19 shock. The finding was clear.
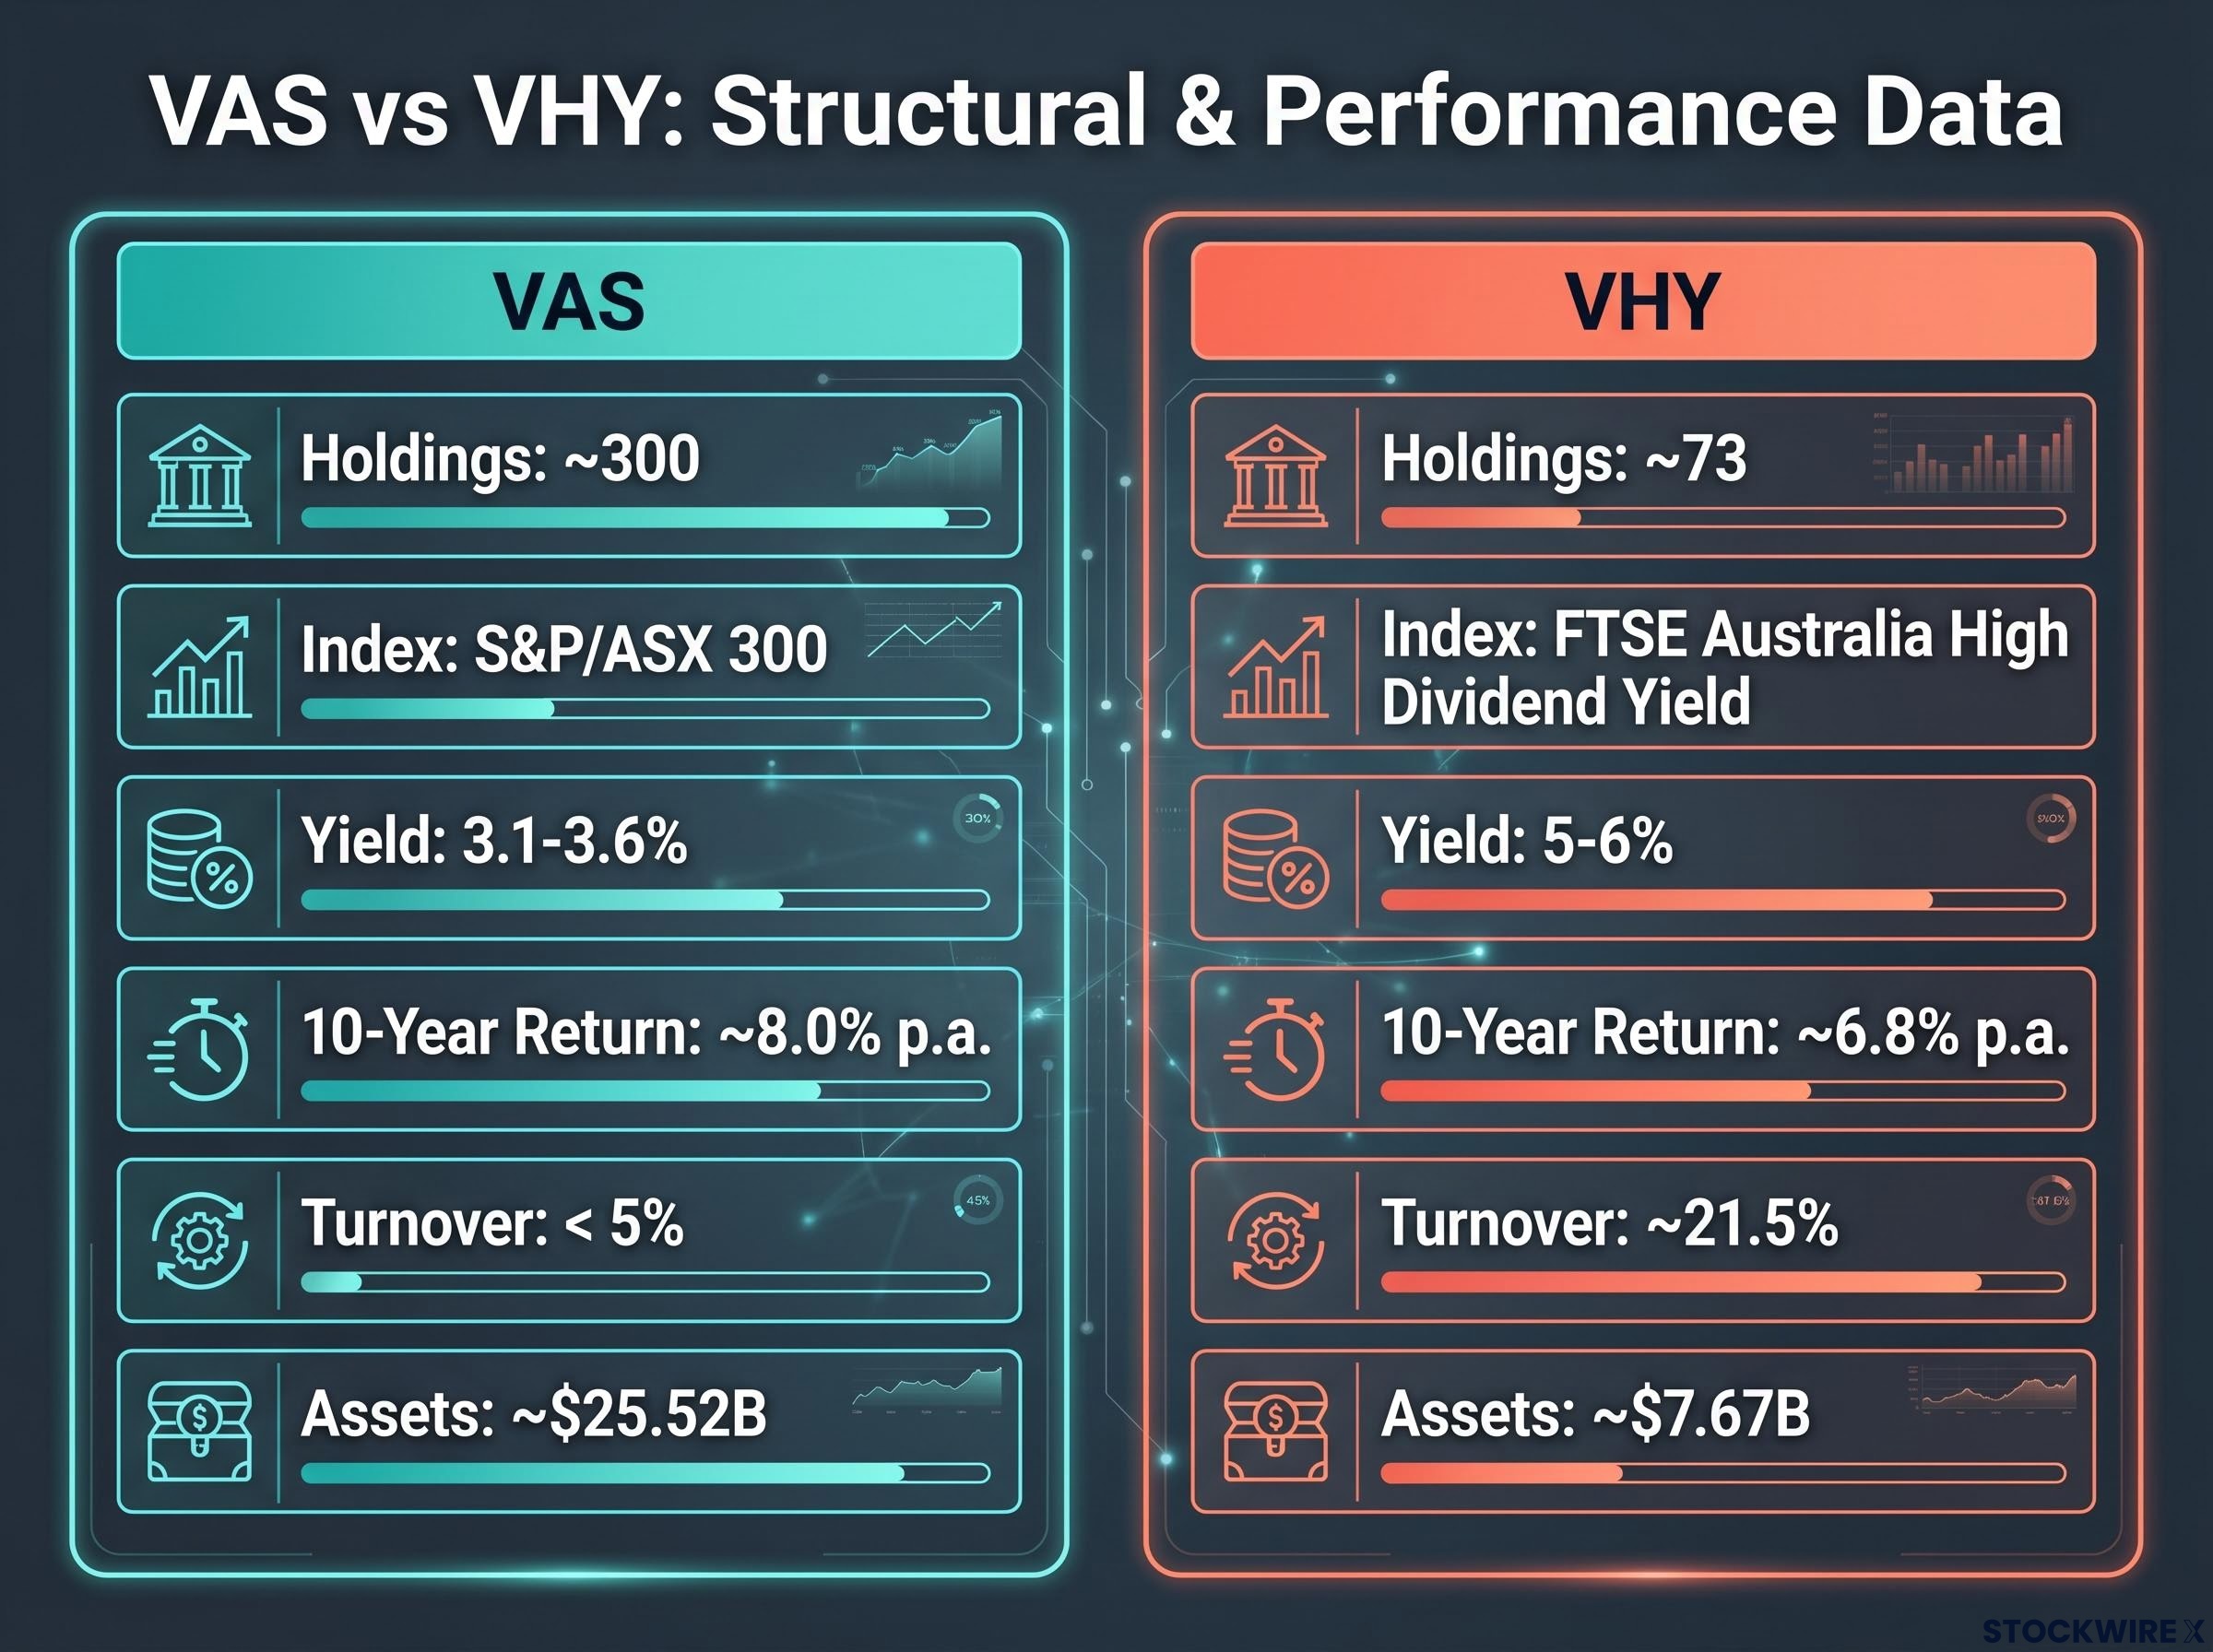
| Factor | VAS | VHY |
|---|---|---|
| Annual management fee | 0.07% | 0.25% |
| Number of holdings | ~300 | ~73 |
| Annual turnover | Below 5% | ~21.5% |
| 10-year average total return | ~8.0% p.a. | ~6.8% p.a. |
| Approximate dividend yield | 3.1-3.6% | 5-6% |
The decade-long data from Nemtsas’ work at Wattle Partners shows VAS averaging approximately 8.0% per annum in total returns against approximately 6.8% for VHY, a margin of around 1.2 percentage points annually that held up through genuine periods of market stress.
Two structural factors explain why VHY trails. First, shares carrying the highest projected dividend yields tend to attract that status precisely because the broader market has a pessimistic view of their prospects, and that pessimism, while occasionally misplaced, is more often vindicated than not. Second, VHY’s higher cash distributions come partly at the expense of capital growth, because companies paying out more of their earnings retain less for reinvestment.
On a $500,000 starting balance, a 1.2 percentage point annual return gap sustained over 20 years translates into a substantially different terminal wealth figure. That is not a coincidence of timing; it is structural evidence that the lower-yield, broader-market approach builds more total wealth over the periods that actually matter for your financial security.
How retirees can use VAS as an income vehicle without selling at bad times
The most common objection to VAS as a retirement fund is behavioural: retirees do not want to sell units. They want to live off income without touching capital. That preference is understandable, but it does not survive contact with the evidence.
The total-return withdrawal framework recommended for VAS investors works in three steps:
- Take the natural income from VAS distributions (dividends and franking credits) as your first layer of retirement income.
- Sell a small number of units quarterly if you need additional cash to meet a target withdrawal rate above the natural yield.
- Review your asset allocation periodically to ensure your withdrawal rate remains sustainable against the portfolio’s long-term return profile.
With VAS delivering approximately 8% per annum in long-run total returns, according to Nemtsas’ decade-long data, modest systematic withdrawals can be sustained without eroding capital over time.
VAS is not a low-income fund in absolute terms. Its portfolio includes significant positions in major fully-franked dividend payers, among them:
- Commonwealth Bank of Australia (CBA)
- BHP Group
- Macquarie Group
- Wesfarmers
Franking credit levels on VAS distributions have historically ranged from approximately 65-88% of net distribution amounts. Because VAS draws on the same core universe of large, fully-franked Australian companies, the gap in franking benefit between VHY and VAS is considerably smaller in practice than the headline yield difference implies.
Applying the grossed-up yield calculation to both funds narrows the cash income gap considerably: at 88.6% franking on VHY’s most recent distribution, the effective gross yield for an SMSF in pension phase rises substantially above the face rate, while VAS’s 65-88% franking range means the difference in true after-credits income is meaningfully smaller than the headline numbers suggest.
A retiree who chooses VHY to avoid selling units may find themselves selling anyway when dividend cuts hit a concentrated portfolio at a market low, having paid higher fees and accumulated less capital throughout. That is the worst of both outcomes.
For retirees wanting to stress-test the three-step withdrawal framework against adverse market timing, our deep-dive into sequence of returns risk models 10,000 portfolio simulations and identifies the structural levers that reduced the failure rate from 4.5% to approximately 0.1% when deployed before the first withdrawal.
What the evidence actually supports for most Australian retirees
The multi-factor case points in one direction. For most Australian retirees, VAS is the stronger core ETF choice, not because VHY is a bad fund, but because the structural advantages compound over the timeframes that matter:
- Lower fees: 0.07% versus 0.25%, saving an estimated $35,000 over 20 years on a $500,000 balance
- Broader diversification: approximately 300 holdings versus 73, reducing concentration risk in banks and miners
- Lower turnover: below 5% versus approximately 21.5%, improving tax efficiency
- Higher observed total returns: approximately 8.0% versus 6.8% per annum across Nemtsas’ 15-year review
- More reliable income across cycles: spread across all ASX sectors rather than concentrated in cyclically exposed high-yield payers
The evidence does not say income is irrelevant in retirement. It says the most reliable way to generate income over a 25-30-year horizon is to maximise the total wealth pool first, then withdraw from it systematically, rather than optimising for the highest quarterly cash payment today at the cost of slower capital accumulation.
There are circumstances where VHY may have a role. Investors in full pension-phase super, where turnover-related capital gains tax is eliminated, who have a specific cash-flow need for higher current income and who understand the concentration trade-off, may find VHY useful as a complement alongside a VAS core. It is not a core replacement.
Both funds will be affected by the trajectory of Australian bank regulation and commodity markets. The question is which structure is better equipped to absorb those shocks across a full retirement. VAS, with total assets of approximately $25.52 billion and 300 holdings, has the broader base. VHY, at approximately $7.67 billion and 73 holdings, carries the narrower risk profile.
The evidence, drawn from Nemtsas’ 15-year review at Wattle Partners, supports VAS as the stronger foundation for a retirement that needs to last decades, not quarters.
This article is for informational purposes only and should not be considered financial advice. Investors should conduct their own research and consult with financial professionals before making investment decisions. Past performance does not guarantee future results. Financial projections are subject to market conditions and various risk factors.
—