
What the Equity Risk Premium Says About US Stocks Right Now
5 hrs ago


A Dividend Discount Model valuation of Westpac can produce a fair value of A$17.89 or A$80.50 depending on the assumptions selected. Both figures come from the same formula, applied to the same stock, using the same base dividend. The only difference is the inputs.
With Westpac’s share price sitting at approximately A$36.55 in late May 2026, above both Morningstar’s fair value estimate of A$30.50 and the broader analyst consensus of A$34.16, income-focused investors are actively questioning whether ASX bank stocks are priced fairly. The Dividend Discount Model is one of the most commonly referenced valuation tools for dividend-paying equities, yet its mechanics and its sensitivity to input assumptions are rarely explained in plain terms. This article walks through the DDM step by step using Westpac as a current case study, explains how franking credits change the calculation for Australian investors, and shows exactly why the model’s output depends almost entirely on the assumptions fed into it.
Every six months, Westpac deposits a dividend into shareholder accounts. The DDM starts with that payment and asks a deceptively simple question: if a share is nothing more than a claim on every future dividend the company will ever pay, what is that stream of payments worth in today’s dollars?
The logic rests on a single principle. A dollar of dividend received ten years from now is worth less than a dollar received today, because money available today can be invested elsewhere in the interim. The DDM discounts each future dividend payment back to a present value, then adds them up. The total is the model’s estimate of what the share is worth.
For stable dividend-paying stocks like Australian banks, the version used in practice is the Gordon Growth Model. It assumes dividends grow at a constant rate indefinitely and compresses the calculation into a single formula.
The origins of the dividend discount model trace back to John Burr Williams in 1938, who built the framework as a direct response to the speculative excesses of the 1920s and the argument that dividends, not resale prices, represent the true foundation of investment value; that intellectual grounding explains why the model remains part of the CFA Institute curriculum and institutional equity strategy work today.
The Gordon Growth Model formula: Share price = D / (r – g)
Westpac’s most recent full-year dividend was A$1.66 per share, fully franked. The company pays dividends semi-annually, with the 2026 interim dividend set at 77 cents per share, 100% franked. These figures form the base inputs for the worked example that follows.
Understanding what the DDM is actually calculating, and why it uses a discount rate, is the prerequisite for interpreting any valuation output. Without it, DDM results are easily mistaken for facts rather than the product of assumptions.
Three inputs drive the entire model. Each one requires a judgement call, and each judgement call changes the output.
The dividend (D). The starting point is Westpac’s most recent full-year dividend of A$1.66 per share. This figure is sourced from the company’s actual payout history rather than from analyst forecasts, anchoring the model to observed data.
The required return (r). For an ASX bank stock, the discount rate is typically constructed by starting with a risk-free rate, anchored to the RBA cash rate, then adding an equity risk premium to compensate for stock market volatility, plus a bank-specific adjustment for financial leverage and earnings cyclicality. As of 6 May 2026, the RBA cash rate stands at 4.35% following a 25 basis point increase. This rate forms the reference floor. Analysts then layer premiums on top, producing required return assumptions that range from 6% to 11% depending on the risk tolerance applied.
The growth rate (g). This reflects the expected long-run annual rate at which dividends will grow. Conservative assumptions sit around 2%, roughly in line with long-run inflation. More optimistic scenarios push toward 4%, implying sustained earnings growth. The range applied in the Rask Education valuation matrix spans 2% to 4%.
A mid-range scenario uses an 8% required return and 3% dividend growth rate. The arithmetic is straightforward:
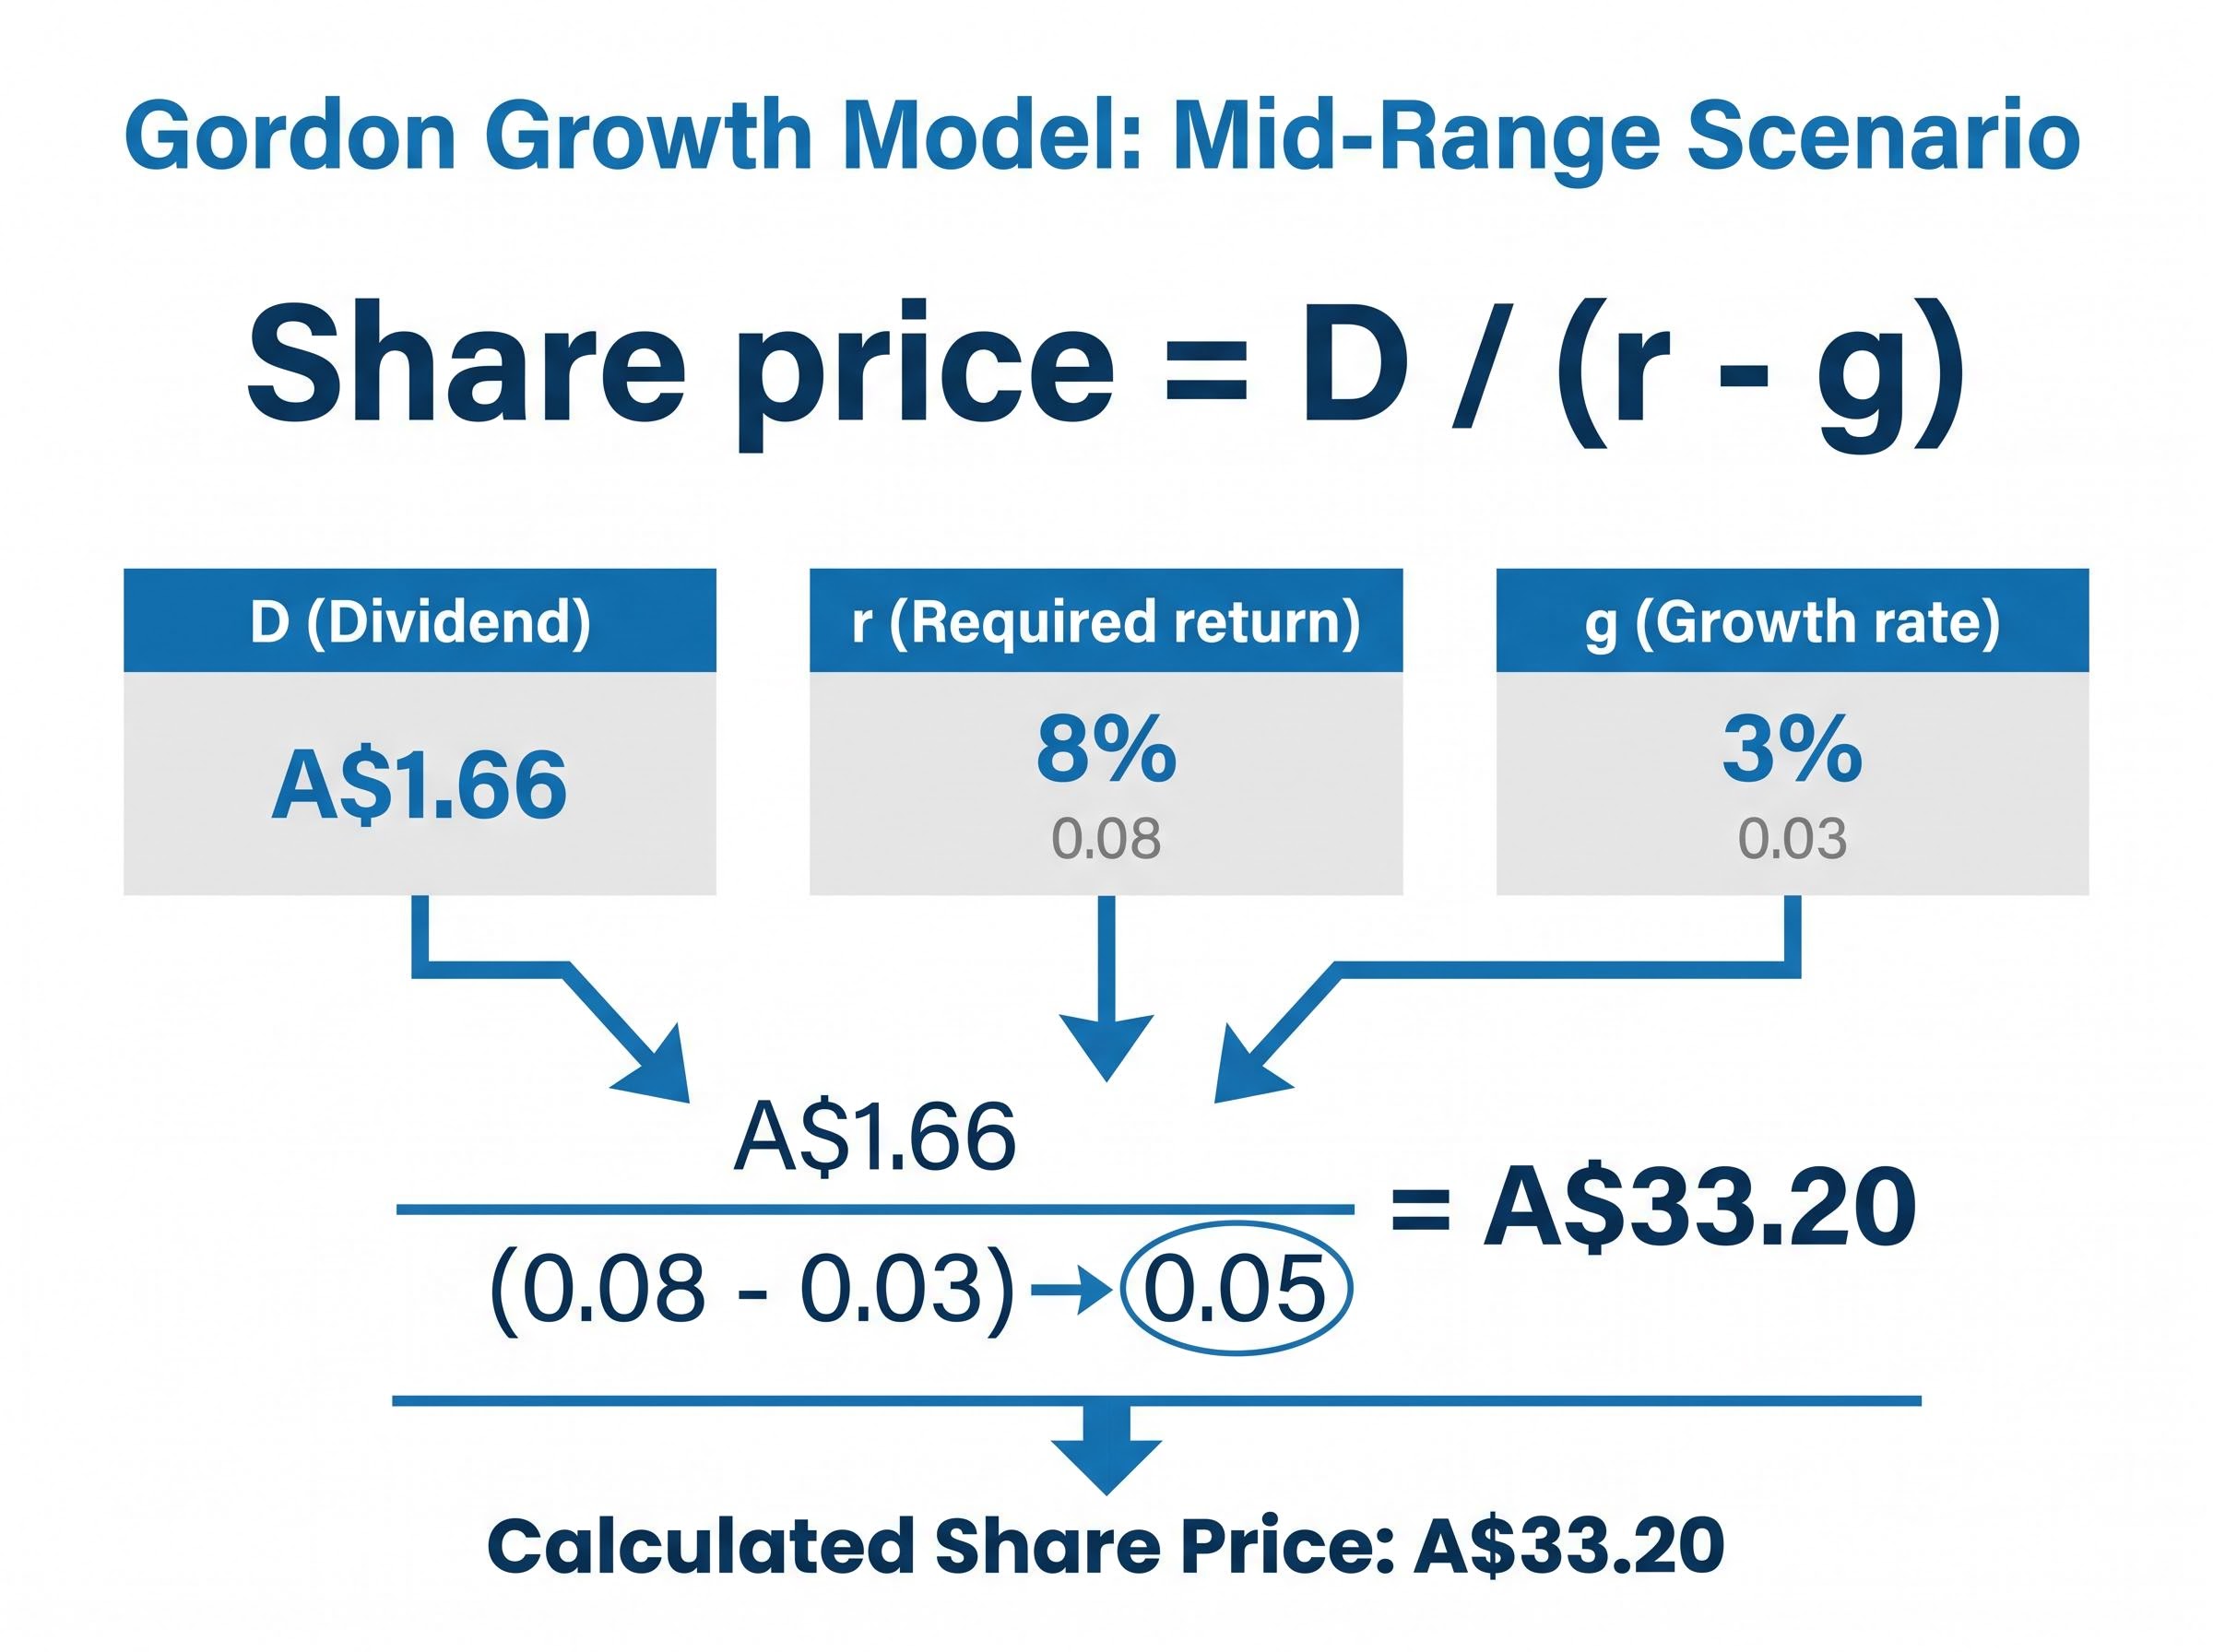
A$1.66 / (0.08 – 0.03) = A$1.66 / 0.05 = A$33.20
That single output sits close to both the matrix average of approximately A$35.10 and the broader analyst consensus of A$34.16, providing a useful cross-check. But it is one point on a far wider spectrum.
The full valuation matrix illustrates the range of outcomes when different input combinations are applied.
| Required Return | 2% Growth | 3% Growth | 4% Growth |
|---|---|---|---|
| 6% | A$41.50 | A$55.33 | A$83.00 |
| 8% | A$27.67 | A$33.20 | A$41.50 |
| 10% | A$20.75 | A$23.71 | A$27.67 |
| 11% | A$18.44 | A$20.75 | A$23.71 |
The matrix average across all scenarios lands at approximately A$35.10, compared to Westpac’s share price at the time of analysis of approximately A$36.74.
“Same stock, same formula, same dividend: the only difference is the assumptions. The DDM range for Westpac spans from A$17.89 to A$80.50.”
The arithmetic explains why. In the Gordon Growth Model, the denominator is (r – g). When the required return is 11% and growth is 2%, the denominator is 0.09, a relatively large number that produces a modest valuation. When the required return drops to 6% and growth rises to 4%, the denominator shrinks to 0.02. The dividend is divided by a number less than a quarter the size, and the output more than quadruples.
This is not a quirk. It is the core mathematical property of the model. As the two rates converge, the denominator compresses toward zero, and the fair value estimate accelerates toward infinity. Small input changes produce enormous output swings.
Three variables drive this sensitivity:
The discount rate channel that compresses DDM fair value estimates as the RBA cash rate rises operates through the same mechanism that reprices equity multiples globally: when risk-free rates increase, the present value of future cash flows falls even if those cash flows are unchanged, which is why the near-zero rate environment of 2020-2021 produced DDM outputs significantly above where they land today.
External anchors provide context. Morningstar’s fair value estimate of A$30.50 (updated November 2025) and Macquarie’s target of A$30 (published August 2025) both sit within the lower-to-mid band of the DDM range. The Investing.com analyst consensus of A$34.16, aggregated from 14 analysts as of May 2026, clusters in the mid-range of the sensitivity band.
The DDM’s output is a model output, not a fact. Its usefulness lies in mapping the range of plausible values and identifying which assumptions are doing the most work, not in anchoring to a single number.
Most valuation frameworks applied to dividend stocks globally ignore a component that materially affects Australian resident investors: franking credits. When Westpac pays a fully franked dividend, the company has already paid 30% corporate tax on the profits distributed. Australian resident shareholders receive a tax credit for that amount, which can offset their personal income tax liability.
For DDM purposes, this means the cash dividend landing in the account understates the total economic value received by a domestic investor. To capture the full value, the dividend input needs to be “grossed up” to its pre-corporate-tax equivalent.
The grossing-up calculation follows three steps:
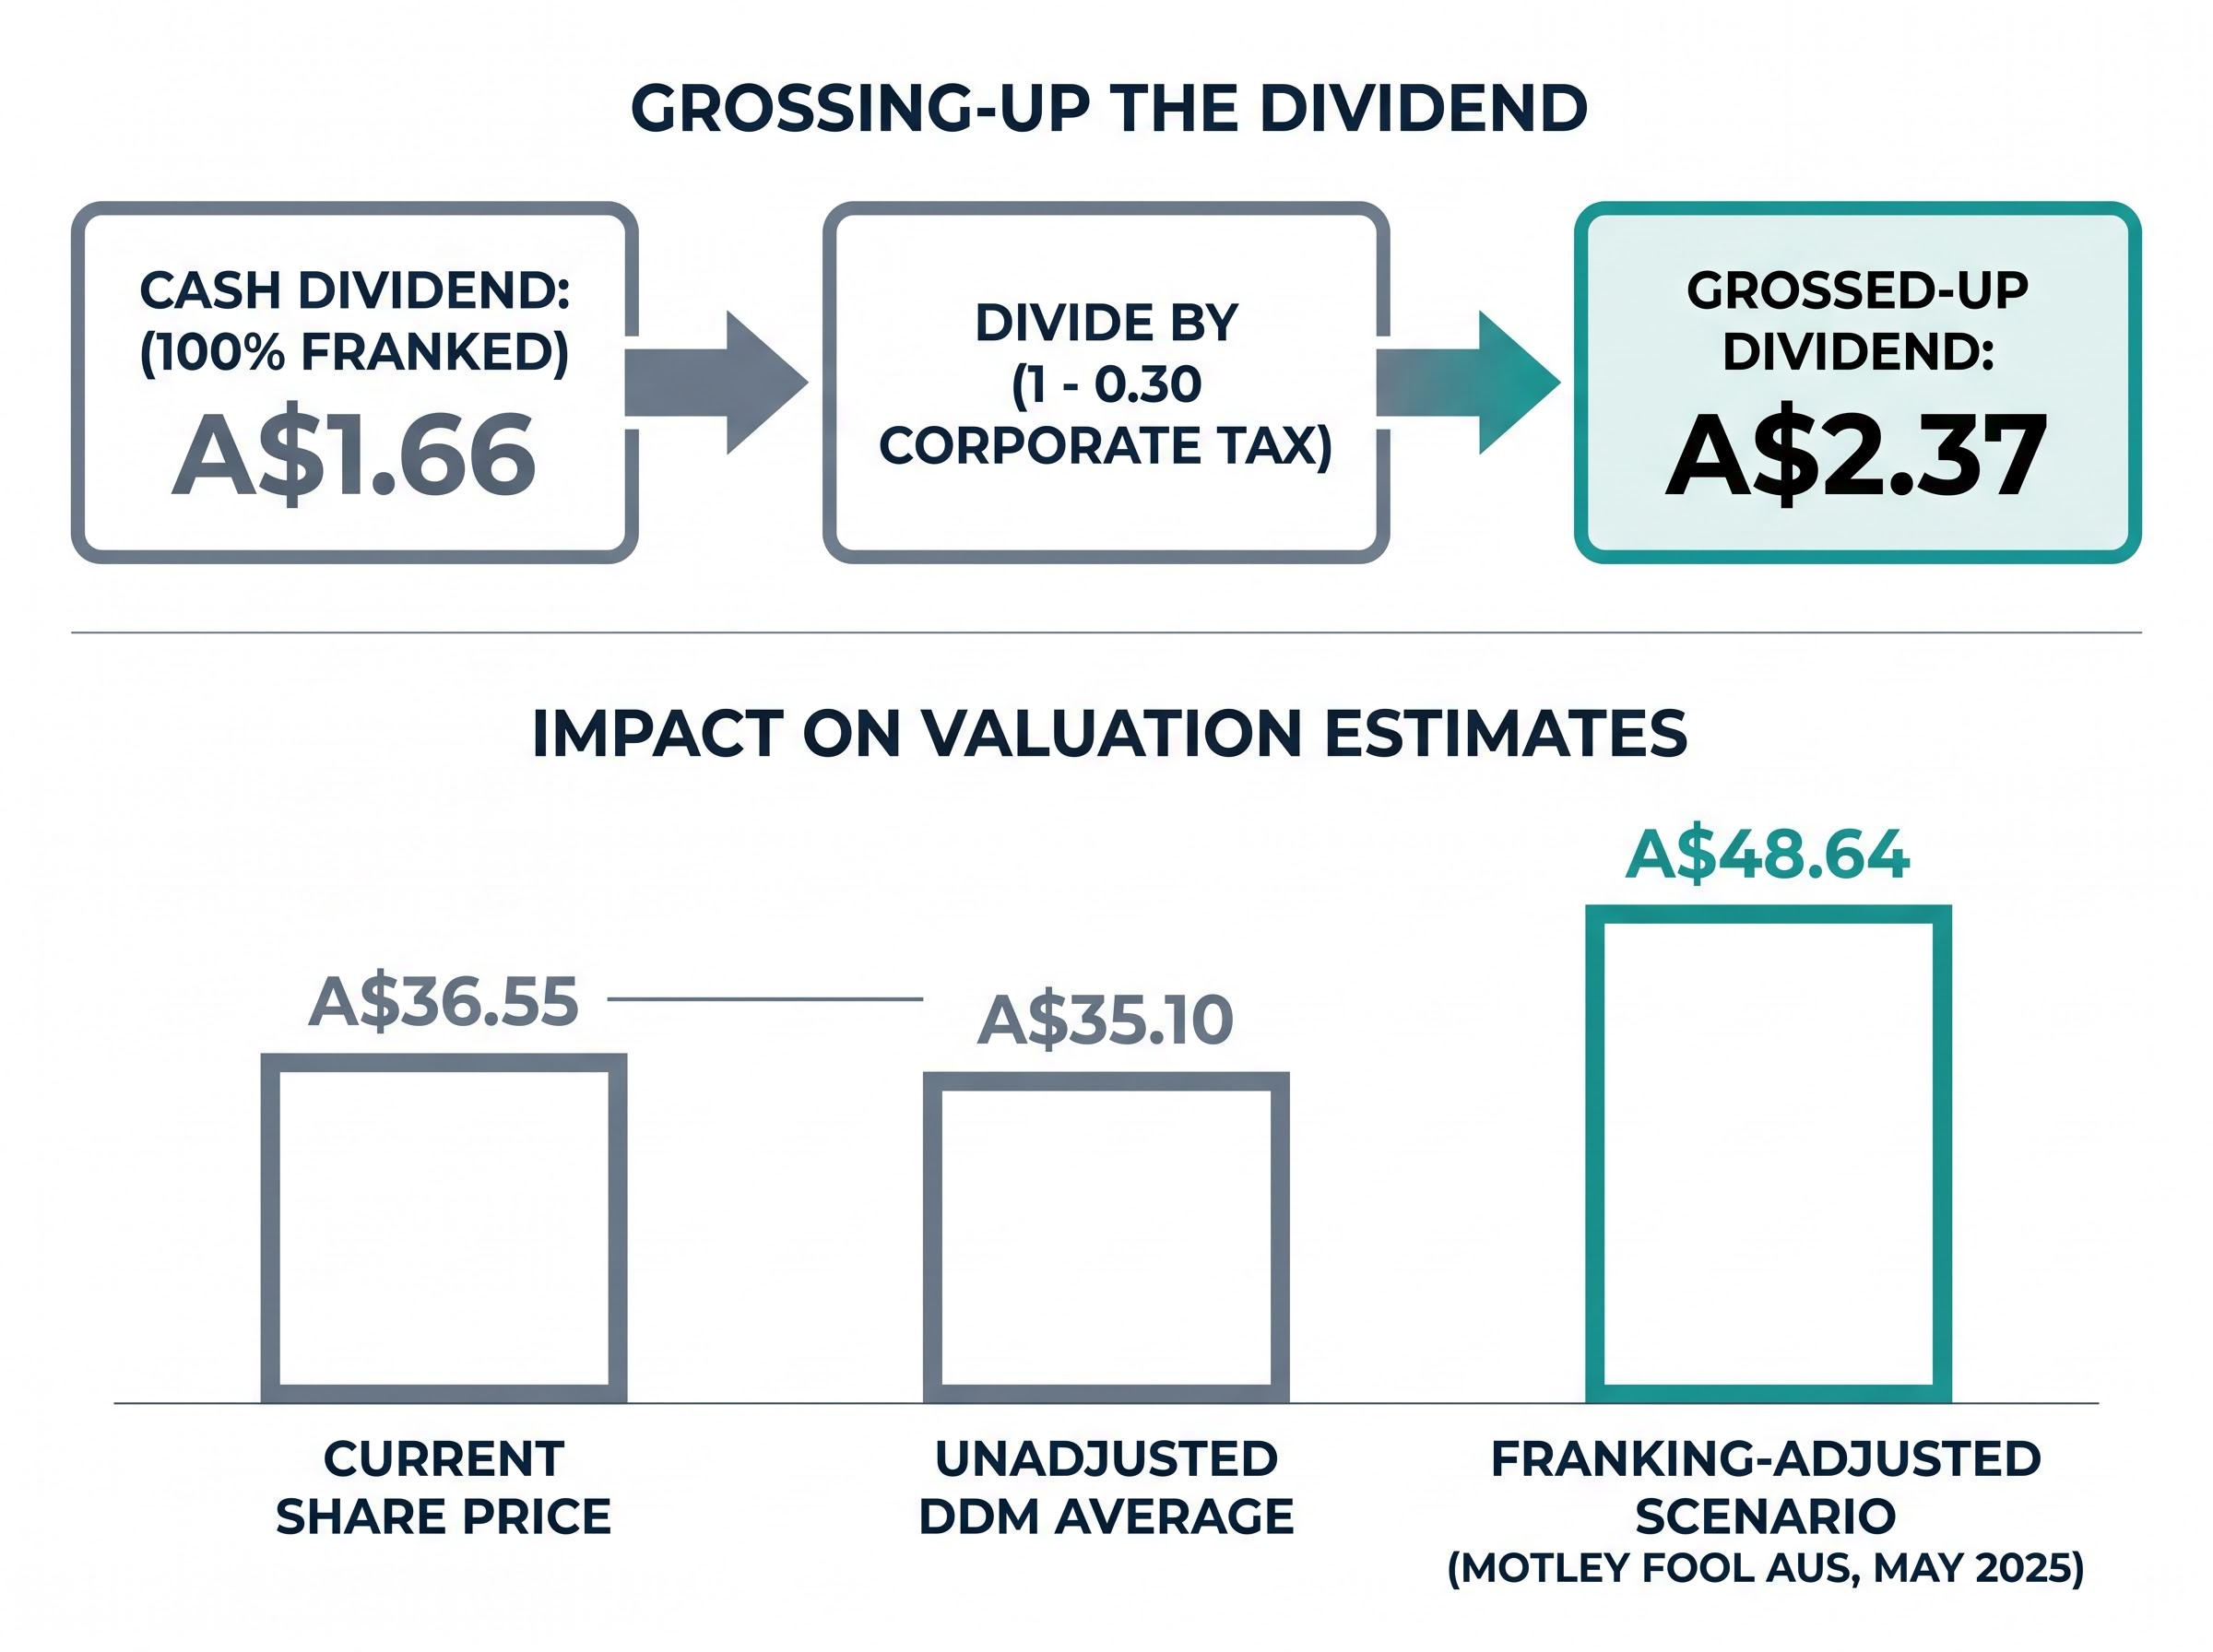
This adjustment is relevant only to Australian resident investors who can utilise franking credits. It does not apply to foreign investors or those in zero-tax positions.
For readers wanting to go deeper on the mechanics of calculating franking credit entitlement, including the 45-day holding period rule, the ATO’s automatic refund process introduced from 2025, and how SMSF pension-phase accounts can claim the credit as a cash refund, our dedicated guide to franking credits covers each step with worked examples across common income structures.
Analysis published by Motley Fool Australia in May 2025 applied this grossing-up approach to Westpac’s DDM and produced a franking-adjusted fair value estimate of approximately A$48.64 per share. Against the current share price of approximately A$36.55, this scenario implies the stock offers value relative to DDM-derived fair value for domestic investors who can fully utilise the credits.
The contrast with the unadjusted DDM average of approximately A$35.10 illustrates the magnitude of the franking credit uplift. Morningstar’s wide-moat assessment and mid-cycle return on equity (ROE) forecast of 12% for Westpac provide supporting context on longer-term earnings sustainability underpinning dividend capacity.
The A$48.64 figure reflects specific growth and discount rate assumptions within the sensitivity range. It should be interpreted as one scenario, not a definitive target.
The DDM assumes dividends grow at a constant rate indefinitely. For a bank subject to APRA capital requirements, economic cycles, and credit loss variability, that assumption is unrealistic over the long run. Dividends can be cut, suspended, or restructured in response to regulatory changes or deteriorating credit conditions.
Westpac does not issue formal forward dividend guidance. The growth rate assumption embedded in any DDM calculation is analyst-constructed rather than company-confirmed, adding a further layer of estimation uncertainty. When the forward dividend estimate is adjusted downward to A$1.61 per share, the DDM matrix average drops to approximately A$34.05, illustrating how even modest revisions to the dividend input shift the output.
The DDM works best as one tool alongside fundamental operating metrics that assess whether dividend capacity is sustainable:
APRA’s Prudential Standard APS 110 sets the minimum Common Equity Tier 1 ratio at 4.5% for authorised deposit-taking institutions, with capital conservation buffers applied on top, making Westpac’s reported CET1 of 12.5% a meaningful indicator of headroom above the regulatory floor.
These metrics give context on whether the dividend growth assumptions embedded in the DDM are realistic. A bank with a declining NIM or thin CET1 buffer may struggle to sustain the payout the model assumes.
“The DDM’s output is only as reliable as the growth and discount rate assumptions built into it.”
The DDM places Westpac in a defined range rather than at a single price. The unadjusted matrix average of approximately A$35.10 (or A$34.05 on forward estimates) suggests the stock is broadly at fair value to mildly above at A$36.55. The franking-adjusted scenario of A$48.64 implies potential upside for domestic investors who can fully utilise those credits. Neither figure is a buy or sell signal. Both are conditional on the assumptions selected.
The current share price sits above the consensus average of A$34.16, well above Morningstar’s A$30.50 and Macquarie’s A$30 target, and below the franking-adjusted DDM scenario. Where an investor lands within that range depends on the required return and growth rate they consider realistic.
The RBA cash rate is a live variable. Any future rate cut from the current 4.35% would mechanically increase DDM fair value estimates for bank stocks, all else equal.
The same DDM framework applies to Commonwealth Bank, NAB, and ANZ with identical input logic:
Franking credit status varies by stock and holding period. Investors should confirm whether dividends are fully, partially, or unfranked before applying the grossing-up adjustment. Cross-checking DDM outputs against analyst consensus targets (available through platforms such as Investing.com for each Big Four bank) provides a useful sanity check on assumption plausibility.
Rask Education notes that the DDM valuation exercise should be one component of broader research, not the sole basis for any investment decision.
The Dividend Discount Model does not produce a correct price. It produces a price conditional on the assumptions selected, and the discipline of making those assumptions explicit is where the model’s value lies. For Australian income investors assessing fully franked ASX bank stocks, the grossed-up DDM is more relevant than the unadjusted version; omitting franking credits systematically understates effective yield from a domestic investor’s perspective.
The DDM is the beginning of a valuation conversation, not its conclusion. Combining its output with fundamental operating metrics, analyst consensus data, and an honest assessment of assumption plausibility gives investors a more complete picture of fair value than any single number can provide.
For investors wanting to move beyond quantitative models entirely, our full explainer on qualitative factors in bank valuation covers how management track record, APRA compliance history, loan book quality, and governance structure each affect the credibility of the earnings assumptions that underpin any DDM or PE-based estimate, with ASIC research showing that retail investors systematically underweight these factors relative to their actual importance in outcomes.
This article is for informational purposes only and should not be considered financial advice. Investors should conduct their own research and consult with financial professionals before making investment decisions. Past performance does not guarantee future results. Financial projections are subject to market conditions and various risk factors.
The Dividend Discount Model (DDM) values a share by treating it as a claim on all future dividends the company will ever pay, discounting each payment back to today's dollars and summing the total. The most common version for stable dividend payers is the Gordon Growth Model, which uses the formula: share price equals the annual dividend divided by the difference between the required return and the expected dividend growth rate.
To calculate a DDM valuation for Westpac, divide the most recent full-year dividend (A$1.66 per share) by the difference between your required return and your assumed long-run dividend growth rate. Using an 8% required return and 3% growth rate as a mid-range scenario produces a fair value estimate of approximately A$33.20 per share.
The DDM is highly sensitive to its inputs because the denominator in the formula is the difference between the required return (r) and the growth rate (g). When those two rates are close together, the denominator shrinks toward zero and the fair value estimate rises sharply, meaning even a 1% change in either assumption can shift the output by 30% or more.
Australian resident investors who can utilise franking credits should gross up the dividend input before applying the DDM, dividing the cash dividend by (1 minus the 30% corporate tax rate) to reflect the full economic value received. For Westpac's A$1.66 fully franked dividend, this produces a grossed-up figure of approximately A$2.37, which when used as the DDM input raises the franking-adjusted fair value estimate to around A$48.64 per share in one published scenario.
Investors should cross-check DDM outputs against net interest margin (NIM), return on equity (ROE), and the Common Equity Tier 1 (CET1) capital ratio to assess whether the dividend growth assumptions embedded in the model are realistic. For Westpac, these metrics currently stand at a NIM of 1.93%, ROE of 9.7%, and a CET1 ratio of 12.5%, each providing context on the bank's capacity to sustain its dividend.