Valuing ASX Bank Stocks: What the Ratios Don’t Tell You
58 mins ago

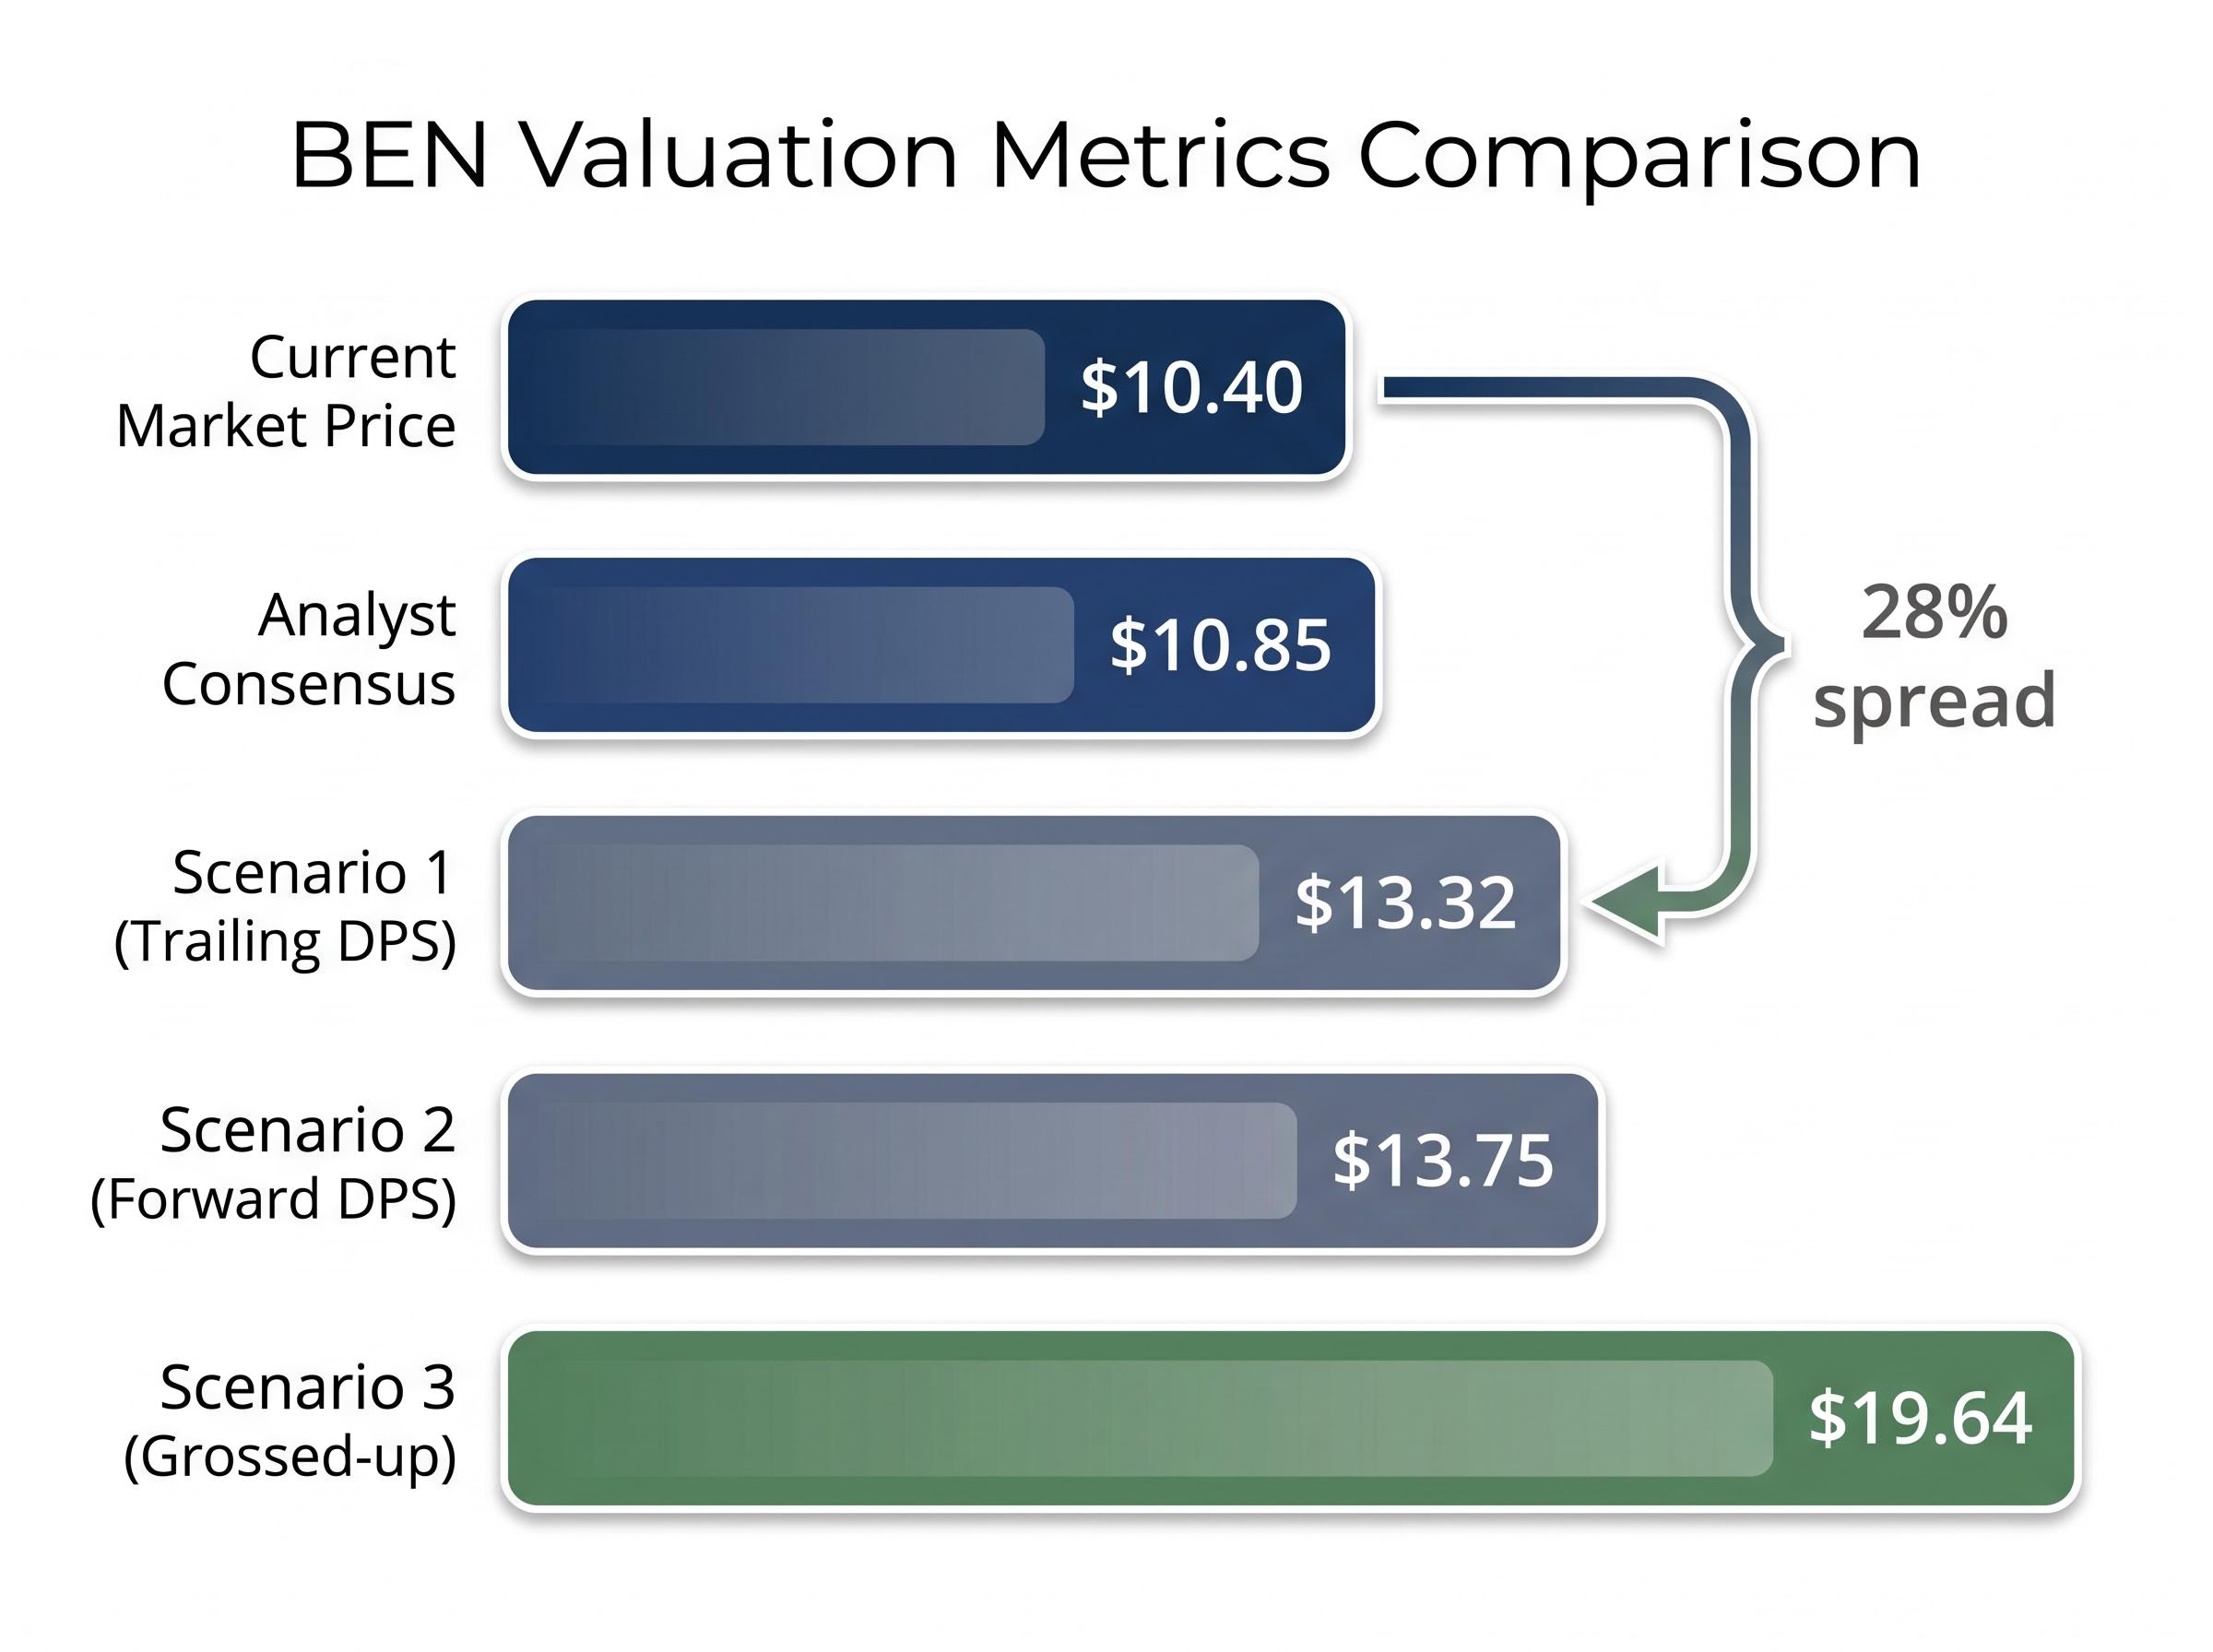
A dividend discount model applied to Bendigo and Adelaide Bank (ASX: BEN) produces three separate intrinsic value estimates, ranging from $13.32 to $19.64, against a market price of $10.40. The spread between the lowest estimate and the market price is 28%. That gap deserves explanation, and the model behind it deserves scrutiny.
With the RBA cash rate sitting at 4.35% following the May 2026 increase, Australian income investors are reassessing which dividend-paying stocks offer genuine value versus which merely appear cheap. Regional banks like BEN sit at an interesting intersection: fully franked dividends, a stable payout policy, and a business model mature enough to make dividend forecasting tractable. This article walks through the dividend discount model step by step using BEN as a live worked example, covering three scenarios (trailing dividend, forward dividend, and grossed-up with franking credits), explains what the outputs mean, and surfaces the assumptions that can make or break the model. By the end, readers will understand how to replicate this analysis on any dividend-paying ASX stock.
Before running a valuation model, the first question is whether the model fits the stock. The dividend discount model (DDM) requires a company that pays stable, predictable, recurring dividends from a mature business. A high-growth company reinvesting all earnings fails this test. So does a company with an erratic payout history.
BEN clears each qualifying condition:
BEN’s NIM of 1.9% exceeds the ASX major bank average of 1.78%, positioning it competitively within its peer group on margin quality despite its smaller scale.
Within the ASX regional bank cohort, BEN is neither a high-growth disruptor nor a distressed payer. Its trailing annual dividend per share (DPS) of approximately $0.63 and a share price of $10.40 at the time of this analysis place it squarely in the income-vehicle category. One qualitative flag worth noting: a workplace culture score of 2.9 versus a sector benchmark of 3.1, though this carries limited weight in a quantitative valuation exercise.
Understanding why a model fits a stock before running the numbers is the first discipline of valuation.
A dividend yield and a share price appear on every broker screen. They tell an investor what a stock paid last year as a percentage of today’s price. What they do not tell is whether the current price fairly reflects the stream of dividends the company is expected to pay in the future. That is the question the DDM answers.
The dividend discount model was developed by John Burr Williams in 1938 as a direct response to the speculative excesses of the 1920s bull market, grounding stock valuation in future income rather than price momentum, a discipline that remains in active use in the CFA Institute curriculum and institutional equity research today.
The Gordon Growth Model, the most widely used perpetuity form of the DDM, rests on a single idea: a share is worth the present value of all the dividends it will ever pay. If those dividends grow at a constant rate forever, the maths simplifies to a clean formula.
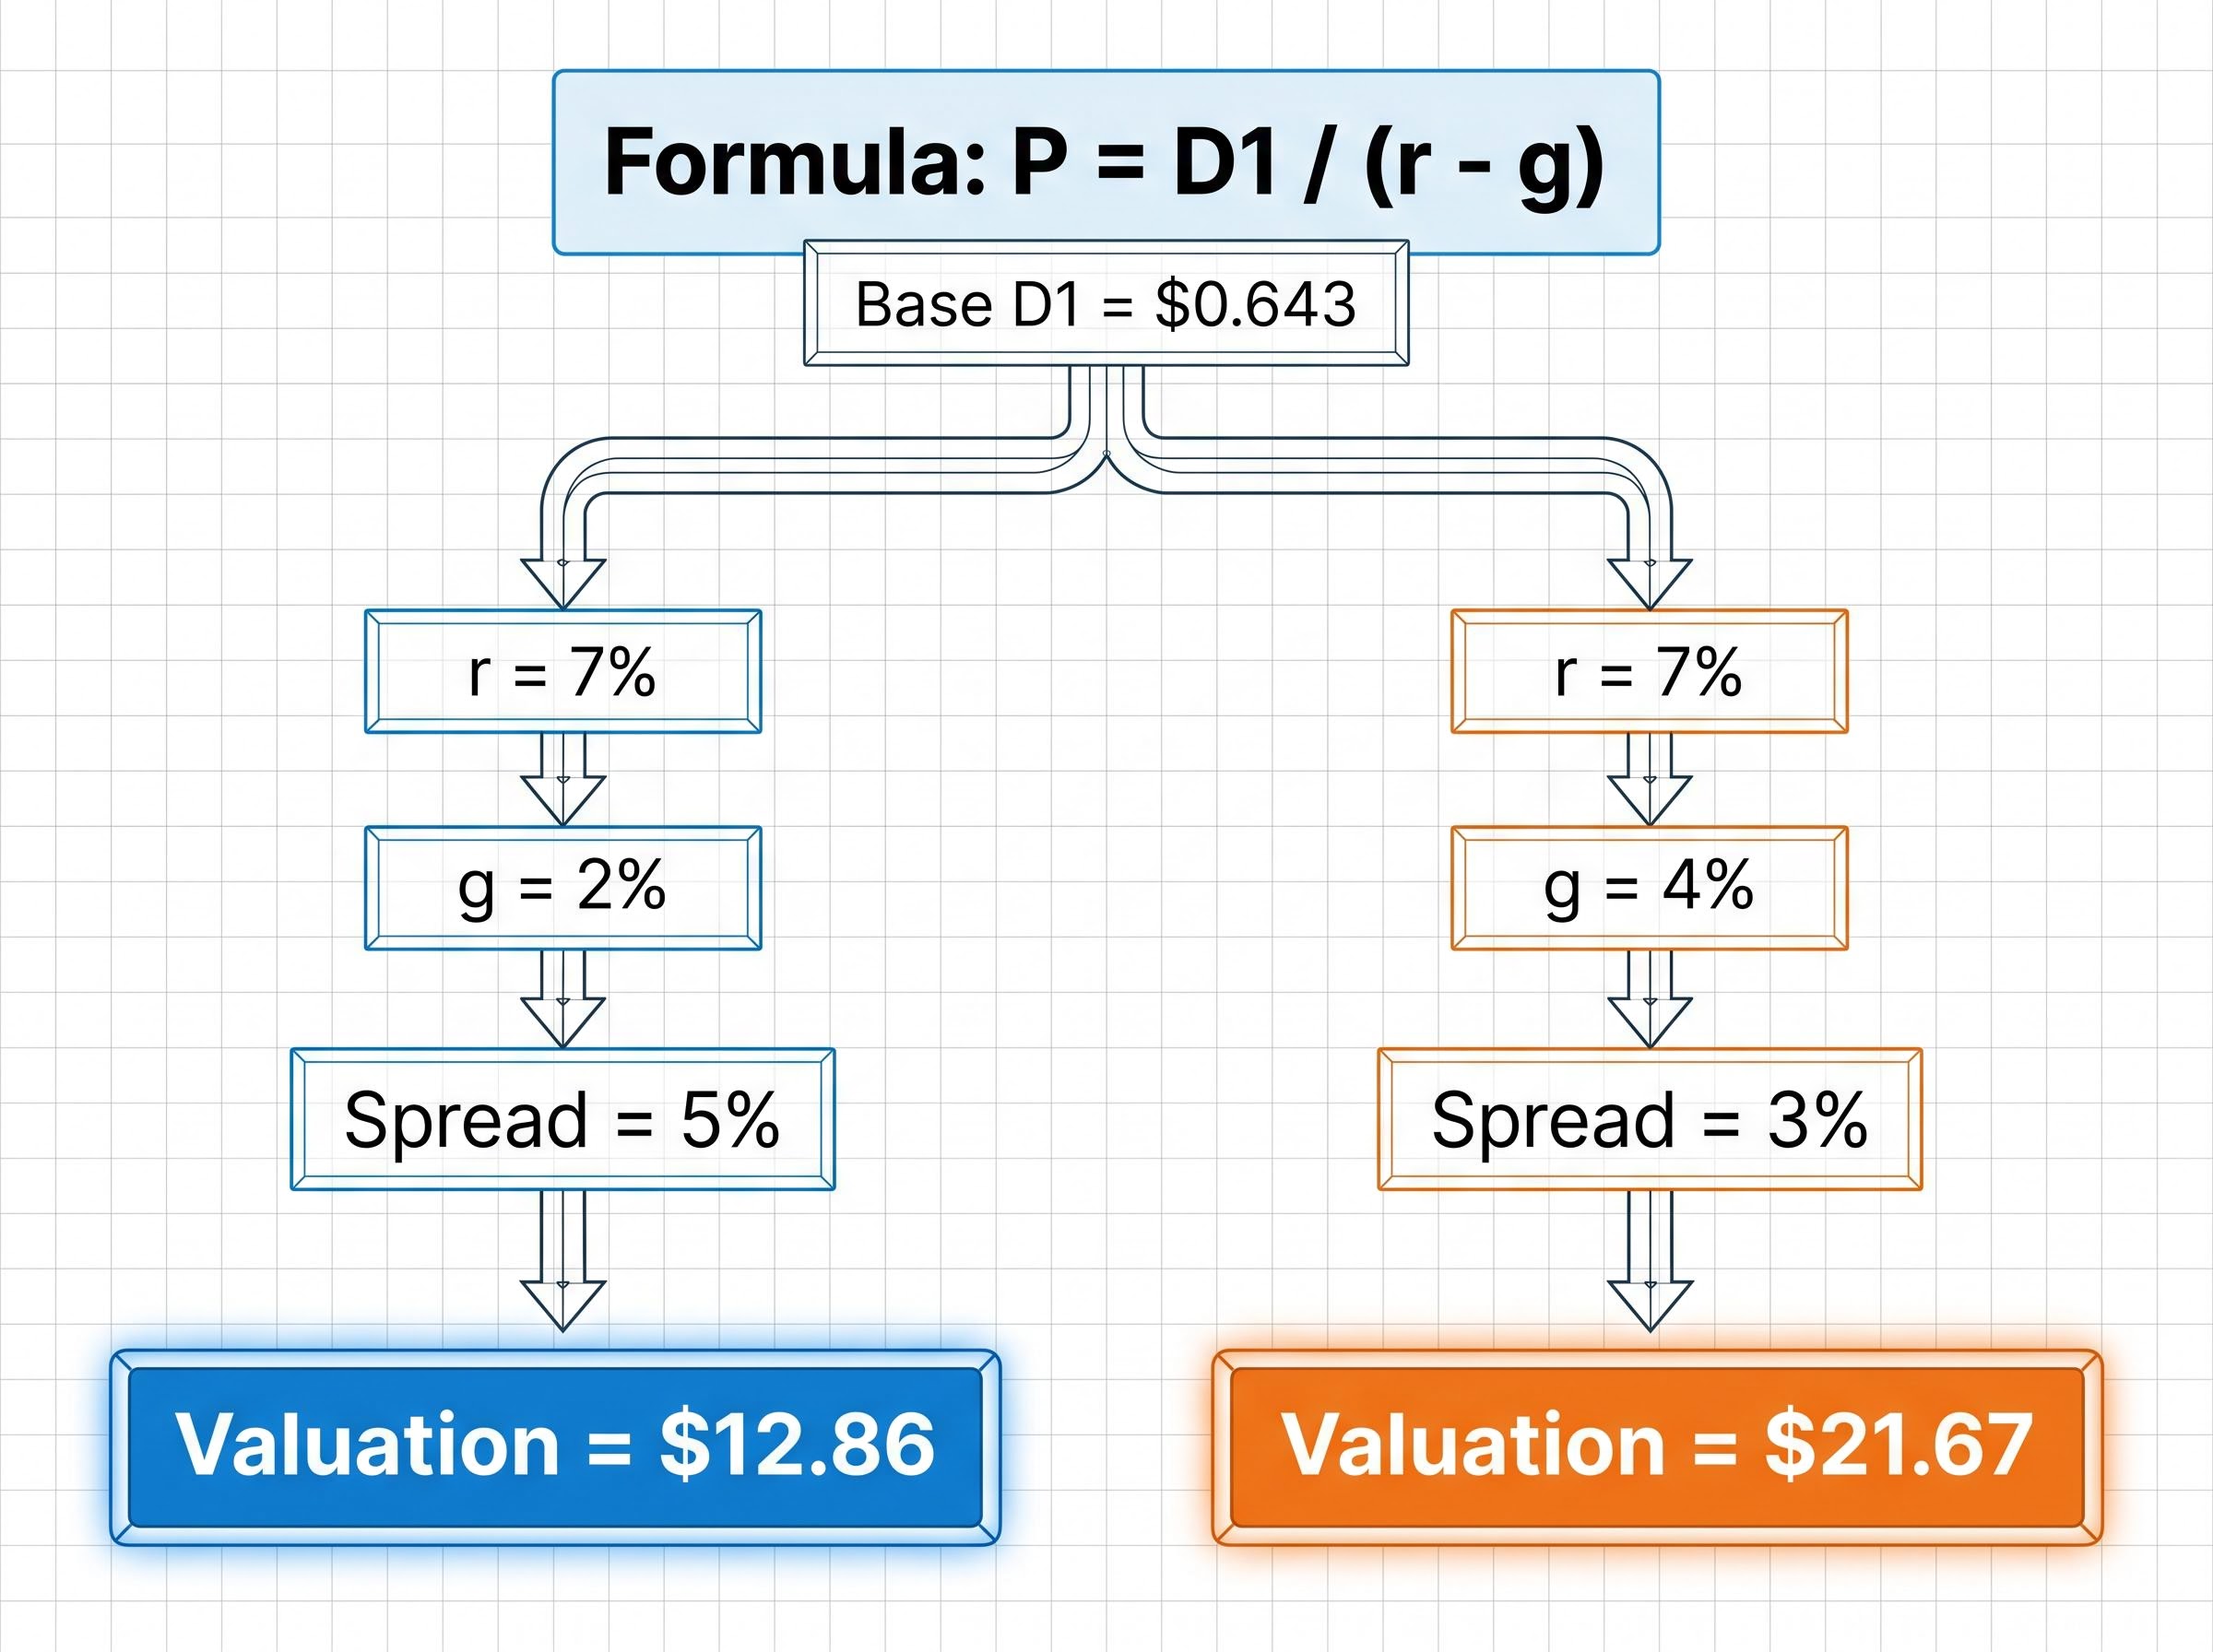
P = D1 / (r – g)
Each variable carries a specific meaning:
For BEN, the starting point is a trailing DPS of $0.63. The January 2026 Rask Media analysis used a 2% growth assumption and a 7% required return as its base case inputs, producing D1 of approximately $0.643 ($0.63 multiplied by 1.02).
The denominator, r minus g, is where the model’s sensitivity lives. A smaller spread between the required return and the growth rate produces a higher valuation. This is not a minor technicality; it is the single assumption that most affects the output.
Consider a concrete example. If r equals 7% and g equals 2%, the spread is 5%, and the valuation is $0.643 divided by 0.05, producing approximately $12.86. Change g from 2% to 4% while holding r constant. The spread shrinks to 3%, and the valuation jumps to approximately $21.67. A two-percentage-point change in the growth assumption nearly doubled the output.
That fragility is not a flaw in the formula. It is information. It tells the analyst exactly where to focus scrutiny.
The DDM produces a single number for a given set of inputs. Running multiple scenarios across a realistic input range produces something more useful: a valuation band.
Scenario 3 grosses up the dividend for franking credits. Because BEN‘s dividends are 100% franked, Australian resident shareholders receive an imputation credit worth 30% of the grossed-up dividend. The grossing-up calculation divides the cash dividend by (1 minus the 30% corporate tax rate), lifting the effective dividend input. This scenario produces an estimated intrinsic value of approximately $19.64 per share, the most generous of the three, and the most relevant to resident individual investors within their tax-free or low-tax thresholds.
Scenario 1 applies the trailing historical DPS of $0.63. With growth assumptions ranging from 2% to 4% and risk rates from 6% to 11%, averaging across these combinations produces an estimated intrinsic value of approximately $13.32 per share.
Scenario 2 substitutes the projected forward DPS of $0.65, reflecting analyst expectations rather than rear-looking data. Forward dividends are the analytically preferred input because the model values future cash flows, not past ones. Under the same assumption ranges, this scenario produces an estimated intrinsic value of approximately $13.75 per share.
| Scenario | Dividend Input Used | Key Assumptions | Estimated Intrinsic Value |
|---|---|---|---|
| 3. Grossed-up (franking) | $0.90 (franking-adjusted) | g: 2-4%, r: 6-11% | ~$19.64 |
| 1. Trailing DPS | $0.63 (historical) | g: 2-4%, r: 6-11% | ~$13.32 |
| 2. Forward DPS | $0.65 (projected) | g: 2-4%, r: 6-11% | ~$13.75 |
Under the franking-adjusted scenario, the DDM implies a fair value of approximately $19.64 per share, against a market price of $10.40.
The spread between $13.32 and $19.64 is not noise. It reflects the progressive inclusion of Australian-specific value, from raw cash dividends to analyst-adjusted forward expectations to the full pre-tax benefit delivered through imputation. Professional analysts use DDM and discounted cash flow tools in exactly this way: not to land a single price target, but to define a range.
The three scenarios above look compelling on the surface. Every estimate sits above the market price of $10.40. The question is whether the growth and return assumptions that generated those numbers are grounded in BEN‘s actual financial profile.
Start with the 2-4% dividend growth assumption. BEN‘s ROE of 7.76% (H1 FY26) places a ceiling on sustainable earnings growth. A bank cannot persistently grow dividends faster than its earnings grow, and earnings growth for a mature regional bank with a 64% payout ratio is constrained by retained earnings available for reinvestment. A 2% growth rate sits comfortably within this constraint. A 4% rate pushes against it.
The NIM of 1.92%, while up 4 basis points half-on-half, reflects a stabilising margin rather than an expanding one. And BEN‘s Common Equity Tier 1 (CET1) ratio of 11.3% sits below the sector average, the capital buffer available to absorb losses or fund growth. CET1 is the measure of a bank’s highest-quality capital relative to its risk-weighted assets; a lower ratio limits a bank’s flexibility to maintain dividends through stress periods.
| Metric | BEN (H1 FY26) | Sector Context |
|---|---|---|
| NIM | 1.92% | Above major bank avg of 1.78% |
| ROE | 7.76% | Below major banks |
| CET1 | 11.3% | Below sector average |
| Dividend Yield | ~6.1% | Above major banks |
12 analysts covering BEN in May 2026 carry a Neutral consensus with an average 12-month price target of $10.85.
That consensus, comprising 2 Buy, 7 Hold, and 3 Sell ratings, sits well below even the most conservative DDM estimate of $13.32. The RBA cash rate of 4.35% following the May 2026 increase forms the macro backdrop, compressing the margin environment and raising the opportunity cost of holding equities. The market, in other words, is pricing in constraints that the DDM’s optimistic assumptions may underweight.
Running the model is one step. Pressure-testing the inputs against the company’s actual financials is the step that separates a useful analysis from an optimistic spreadsheet exercise.
Every DDM output comes with embedded assumptions, and each assumption has a failure mode. Knowing them by name is what allows an investor to use the model within its valid range rather than either dismissing it or over-relying on it.
Franking credits represent corporate tax already paid at the company level and pass through to shareholders as a direct offset against personal tax liability; for zero-tax investors and SMSFs in pension phase, the full credit is refundable in cash from the ATO, converting a $70 cash dividend into $100 of total pre-tax value at the 30% corporate rate.
APRA’s APS 110 capital adequacy standard sets out the specific CET1 buffer ranges at which an authorised deposit-taking institution faces automatic constraints on capital distributions, including dividends, giving regulatory teeth to the theoretical ceiling that CET1 ratios place on payout sustainability.
Standard DDM formulas published internationally make no provision for imputation credits. For an Australian resident shareholder, the grossed-up yield on a 100% franked dividend is materially higher than the headline cash yield. This affects both the dividend input (D1) and, arguably, the required return (r), since the after-tax return is enhanced by the credit.
The $19.64 scenario in this analysis explicitly accounts for franking. A DDM output sourced from an international publication or tool that uses only the cash dividend will, by construction, understate value for Australian resident investors.
The DDM is a starting point, not a verdict. Its value lies in the structure it imposes on valuation thinking, not in the precision of its single-number output.
Under every DDM scenario applied, BEN‘s market price of $10.40 sits below the estimated intrinsic value. The spread is real. But it is explained partly by the market pricing in the model’s limitations, including NIM compression risk, below-average CET1, and a Neutral analyst consensus at $10.85, rather than a simple mispricing.
The framework is replicable. For any ASX dividend-paying stock:
DDM application on ASX-listed dividend payers requires franking credit adjustments as a standard step, not an optional refinement, given that fully franked dividends at the 30% corporate tax rate produce a grossed-up yield materially above the headline cash figure for resident investors.
The DDM is one lens. The analyst consensus at $10.85 is another. The grossed-up DDM at $19.64 is a third. Investors benefit from holding all three simultaneously and asking what each implies about the assumptions embedded in the current market price.
“The model does not tell you what a stock is worth. It tells you what a stock is worth if your assumptions are correct. The discipline is in the assumptions.”
This article is for informational purposes only and should not be considered financial advice. Investors should conduct their own research and consult with financial professionals before making investment decisions. Past performance does not guarantee future results. Financial projections are subject to market conditions and various risk factors.
—
The dividend discount model (DDM) values a share by calculating the present value of all future dividends it is expected to pay. The most common form, the Gordon Growth Model, uses the formula P = D1 / (r - g), where D1 is the next expected dividend, r is the required rate of return, and g is the assumed constant dividend growth rate.
Franking credits represent corporate tax already paid at the company level, and Australian resident shareholders can use them to offset personal tax liability. In a DDM, grossing up the dividend input to include franking credits produces a materially higher intrinsic value estimate, as shown in the BEN analysis where the franking-adjusted scenario lifted the estimate from $13.32 to $19.64.
The DDM denominator is r minus g, so a small increase in the growth rate (g) shrinks the denominator significantly and causes the valuation to rise sharply. For example, raising g from 2% to 4% while holding r at 7% nearly doubles the estimated intrinsic value, which is why analysts test a range of growth assumptions rather than relying on a single figure.
Investors should examine the bank's return on equity (ROE), net interest margin (NIM), payout ratio, and Common Equity Tier 1 (CET1) capital ratio. A low CET1 relative to peers, as seen with BEN at 11.3%, signals limited buffer before regulators could constrain dividend payments, which directly challenges the perpetual growth assumption built into the DDM.
Start by identifying the annual dividend per share (trailing or forward), adjust for franking credits if applicable, set a required return informed by the risk-free rate and stock risk, then calculate P = D1 / (r - g). Run multiple combinations of r and g to produce a valuation band rather than a single number, and cross-check the result against analyst consensus targets.