For decades, the market rulebook read simply enough: triple-digit oil and record-breaking industrial metals were the express route to an equity sell-off. Higher input costs squeezed margins, inflation forced central banks to tighten, and stocks paid the price.
That rulebook is not working right now.
As of early September 2026, Brent crude has reclaimed the $100 mark, front-month WTI is trading in the mid-$90s, and COMEX copper has smashed every record on the books. Yet major US equity indices are sitting near all-time highs. The two events are not supposed to coexist.
This simultaneous rally lives at the intersection of two forces that rarely peak together: acute geopolitical risk in energy markets and the structural pull of the global electrification build-out.
The analysis ahead unpacks the mechanics of this dual breakout. Here is the framework for understanding how sticky inflation data and the modern composition of the stock market are quietly reshaping the risks inside your portfolio.
Unpacking the physical reality of the breakout
Before treating these prices as abstract lines on a screen, it helps to ground them in something tangible. These are not paper moves detached from the physical world. They are repricings of the raw material that builds and powers the economy.
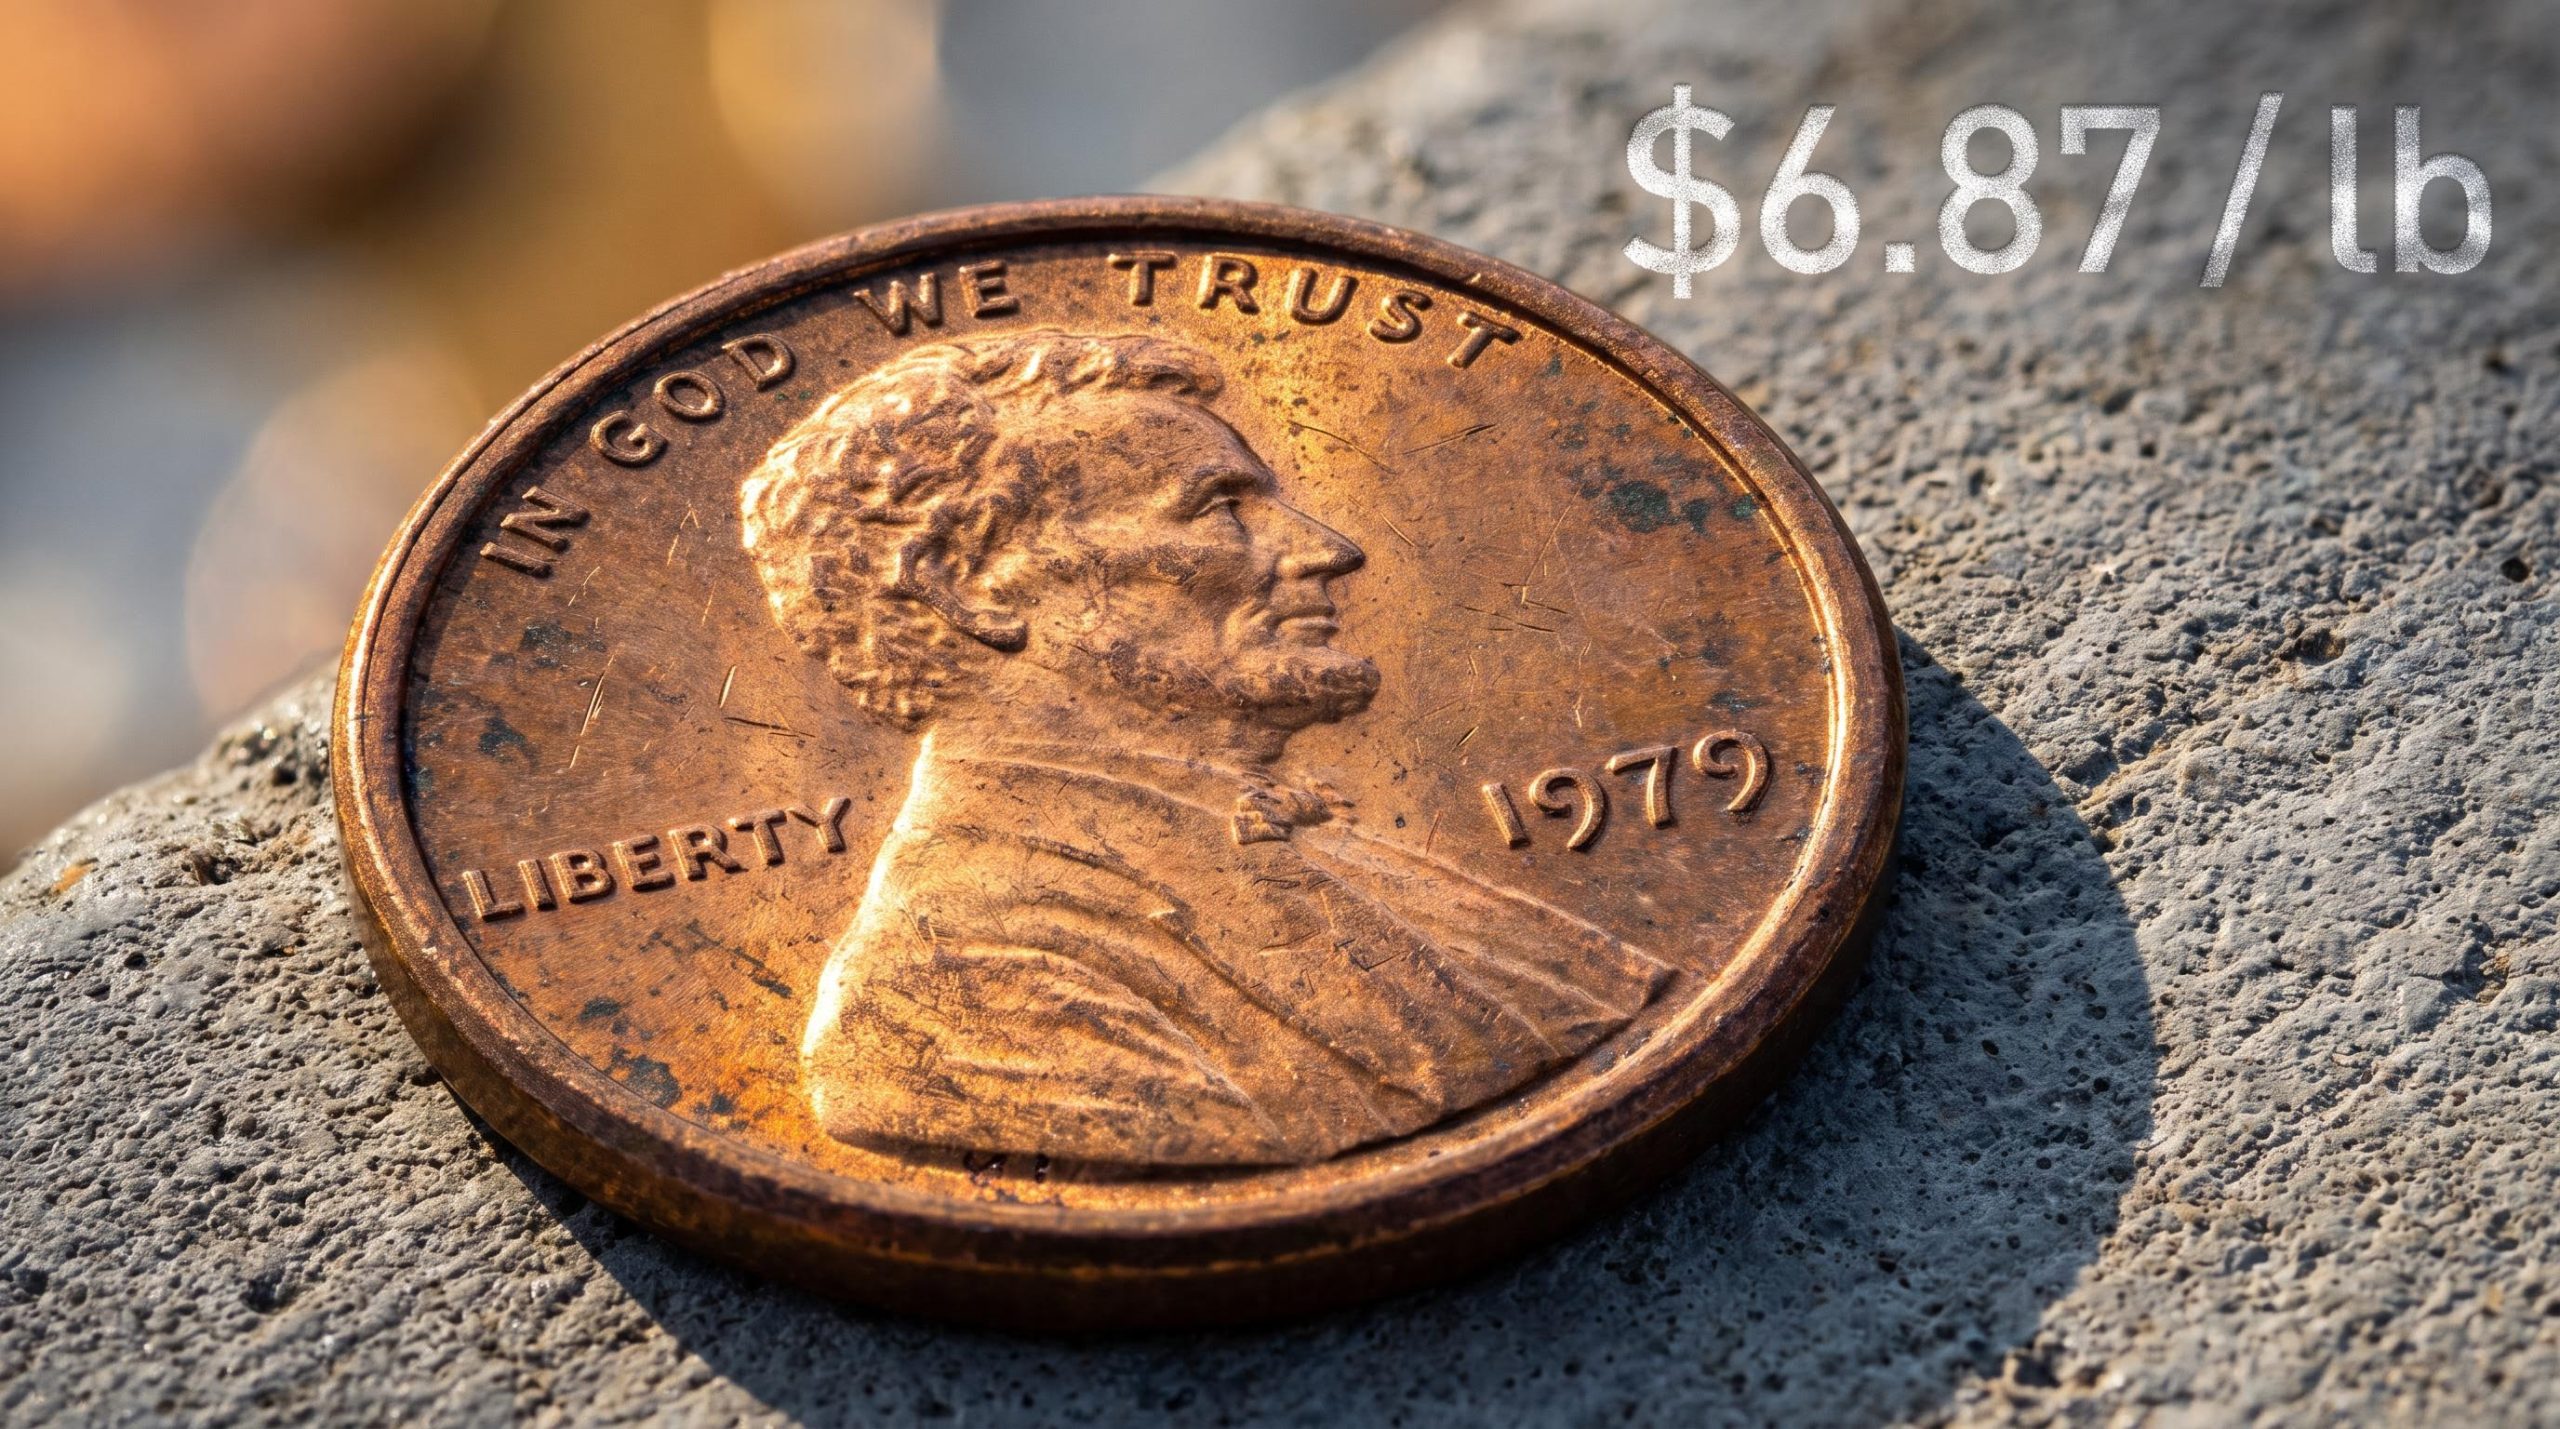
Start with copper. On 8 September 2026, COMEX copper touched an intraday all-time high of US$6.87 per pound, breaking a run of records that had stacked up through the summer.
To grasp what that number means outside a trading pit, look in an old coin jar.
The penny that outgrew its face value At current prices, the intrinsic copper content of a pre-1982 US penny is worth roughly 4.5 cents. The melt value of a one-cent coin is now closing in on that of a nickel. When the metal inside a coin approaches five times its stamped value, the repricing has moved well beyond the abstract.
Crude oil tells a similar story of physical extremes, and the chart mechanics behind the move matter. On 9 September 2026, Trading Economics recorded Brent at $100.45 per barrel, up 2.58% on the day, while the Wall Street Journal reported front-month WTI at $94.95 per barrel.
What sits underneath those prices is a technical regime change worth understanding. For years, a long-term trend line on the crude oil chart acted as resistance, a ceiling that repeatedly capped rallies. After an explosive geopolitical spike, a sharp collapse, and a decisive bounce, that same line has flipped to function as structural support.
A trend line converting from resistance into support is not a technical footnote. It signals that the market has accepted a higher baseline as the new floor rather than the old ceiling.
For you, that distinction changes the planning horizon. This looks less like a temporary spike that reverses in a quarter and more like a structural repricing your portfolio has to live with, meaning energy costs are now anchored at a higher level for the foreseeable future.
When big ASX news breaks, our subscribers know first
Divergent drivers funding a unified cycle
The scale of these moves is settled. The more useful question is why both commodities are surging at once, because they are being pushed by very different engines.
Copper is a demand story. Oil is a supply story. Understanding that split is the key to reading the entire cycle.
Copper’s run is built on structural, long-dated demand. Electric vehicles, renewable energy infrastructure, and the electricity-hungry build-out of AI data centres all consume enormous quantities of the metal. On the other side of the ledger, supply is barely growing.
Copper demand projections from industry analysts point to roughly a 50% increase by 2040, driven by AI hyperscale data centres consuming 15,000 or more tonnes of copper per facility, a demand stream structurally distinct from GDP-correlated industrial cycles because it is locked into multi-year capex commitments.
According to industry projections, global copper mine supply growth is expected to be near zero in 2025 and just over 1% in 2026. That squeeze was tightened further by a localised disruption at Indonesia’s Grasberg mine, which removed more than 500,000 tonnes of production from the market.
Oil is a different animal entirely. The International Energy Agency (IEA) projects global oil demand growth in the 700-800 kb/d range for both 2025 and 2026, a solid but unspectacular figure that, on its own, points to an underlying market surplus rather than scarcity.
What is driving crude higher is fear, not fundamentals. Tensions in the Middle East, particularly threats to the Strait of Hormuz, have embedded a large risk premium into crude futures by threatening to remove barrels from the market at any moment.
The scale of the Hormuz supply disruption places it in a different category from typical geopolitical premiums: with an estimated 10-14 million barrels per day of Gulf crude stranded and OPEC spare capacity at roughly 0.5 million barrels per day, the gap between the disruption and the available offset is structurally irreparable through conventional market adjustment.
| Commodity | Price (Sept 2026) | Primary demand catalyst | Primary supply constraint |
|---|---|---|---|
| Crude oil (Brent) | $100.45/barrel | Steady global growth (700-800 kb/d) | Geopolitical risk premium (Strait of Hormuz) |
| Copper (COMEX) | US$6.87/pound | Electrification, EVs, AI data centres | Near-zero mine supply growth, Grasberg loss |
The distinction is what should shape your read on durability. Copper is being pulled higher by the infrastructure of the next decade, a shortage that persists for years. Oil is currently held hostage by immediate geopolitical friction, a premium that could evaporate on a single de-escalation headline.
The inflationary feedback loop
Rising commodity prices do not stay in the commodity pits. They bleed into fuel, freight, manufacturing, and eventually the inflation numbers that decide the interest rate on your mortgage and the valuation of your growth stocks.
That transmission is already visible in the data. As of July 2026, the picture from the US inflation reports looked like this:
- Headline Consumer Price Index (CPI) rose 0.1% month-over-month, taking the annual rate to 3.4%.
- Core CPI, which strips out food and energy, rose 2.5% year-over-year.
- Energy prices were up 14.7% year-over-year.
- The Personal Consumption Expenditure (PCE) price index, the Federal Reserve’s preferred inflation gauge, climbed to an annual rate of 3.7%.
The gap between those numbers tells the story. Headline inflation running at 3.4% while core sits at 2.5% shows the pressure is concentrated in exactly the place the commodity rally lives: energy, up nearly 15% on the year.
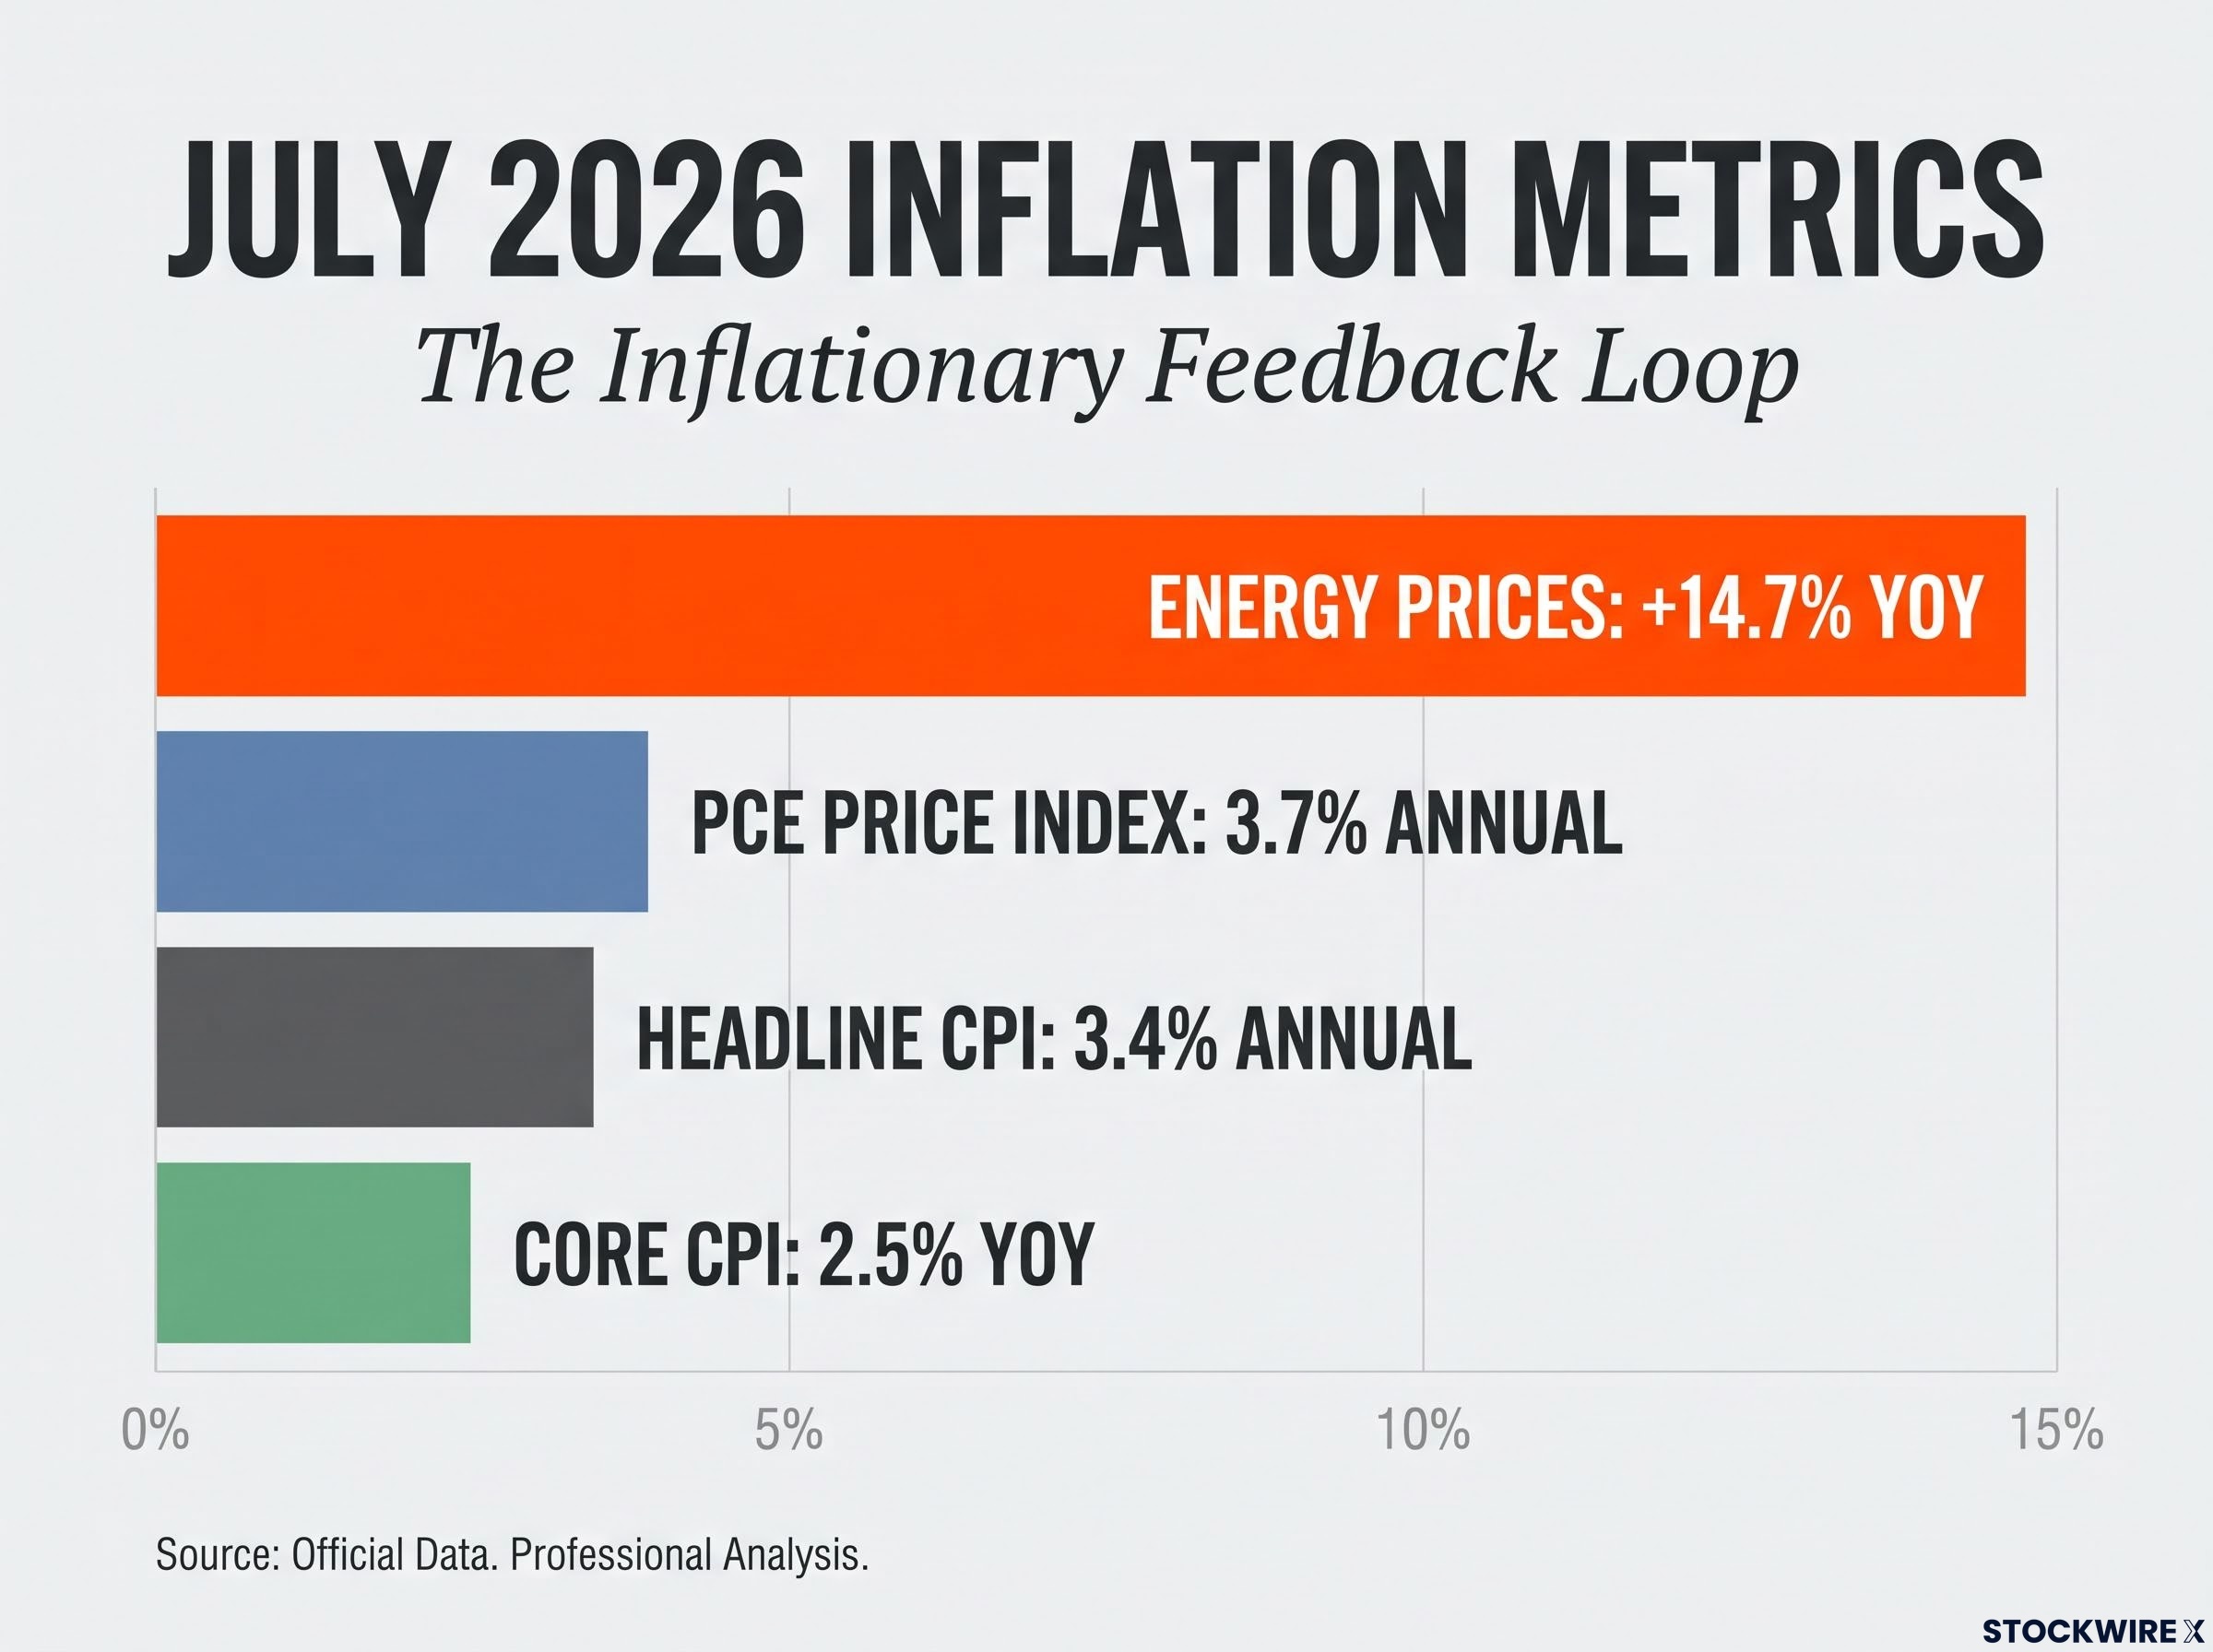
For you, the stubbornness of that energy-driven CPI is the signal that matters. It suggests interest rates stay restrictive for longer, which weighs directly on yield-sensitive holdings and growth stocks whose valuations depend on cheaper money arriving.
Federal Reserve policy pressures
The Federal Reserve faces an awkward problem. Its tools, higher interest rates, work by cooling demand. But this inflation is being driven by supply, by geopolitical risk premiums and mine shortages that no rate hike can fix.
Raising rates to fight a supply-driven price surge risks slowing the economy without meaningfully touching the source of the inflation.
That dilemma is why markets are recalibrating rate expectations around a higher commodity baseline. With the PCE running at 3.7%, well above the central bank’s 2% target, the market read is that the path to lower rates has been pushed further out, keeping the restrictive environment in place longer than many investors had positioned for.
FOMC committee divisions have widened alongside the commodity rally, with the largest dissenting bloc since 1992 reflecting exactly the dilemma described above: three members wanted hike signalling added to the statement while one pushed for a cut, a fracture that makes forward guidance less reliable as a tool for investors calibrating rate exposure.
The BEA’s July 2026 PCE release confirmed the PCE price index at 3.7% annually, a reading that sits nearly double the Federal Reserve’s 2% target and has materially narrowed the window for rate cuts that growth-oriented portfolios were pricing in through mid-year.
The equity market paradox
Here is the puzzle that should be nagging at you. Oil has crossed the dreaded $100 threshold, copper is at a record, inflation is sticky, and yet the S&P 500 is near an all-time high. History says that combination should have triggered a sell-off. It has not.
The resolution lies in the maths of how the modern market is built, and it comes down to four structural factors.
- Lower oil intensity. The US economy is far more services-heavy and energy-efficient than it was during the 1970s shocks. It takes less oil to produce each dollar of output, so high crude prices inflict less damage on corporate margins and consumer wallets than they once did.
- Sector offsets. The energy sector’s expanded share of market capitalisation means high oil prices generate enormous earnings for producers, which counterbalance the margin compression felt by airlines, chemicals, and consumer discretionary names.
- Low historical correlation. Since 1990, the correlation between oil prices and the US stock market has been a modestly positive 0.15, far from the tight negative relationship many investors assume exists.
- Central bank credibility. With inflation contained in the mid-3% range rather than double digits, investors remain confident that a 1970s-style wage-price spiral will be avoided.
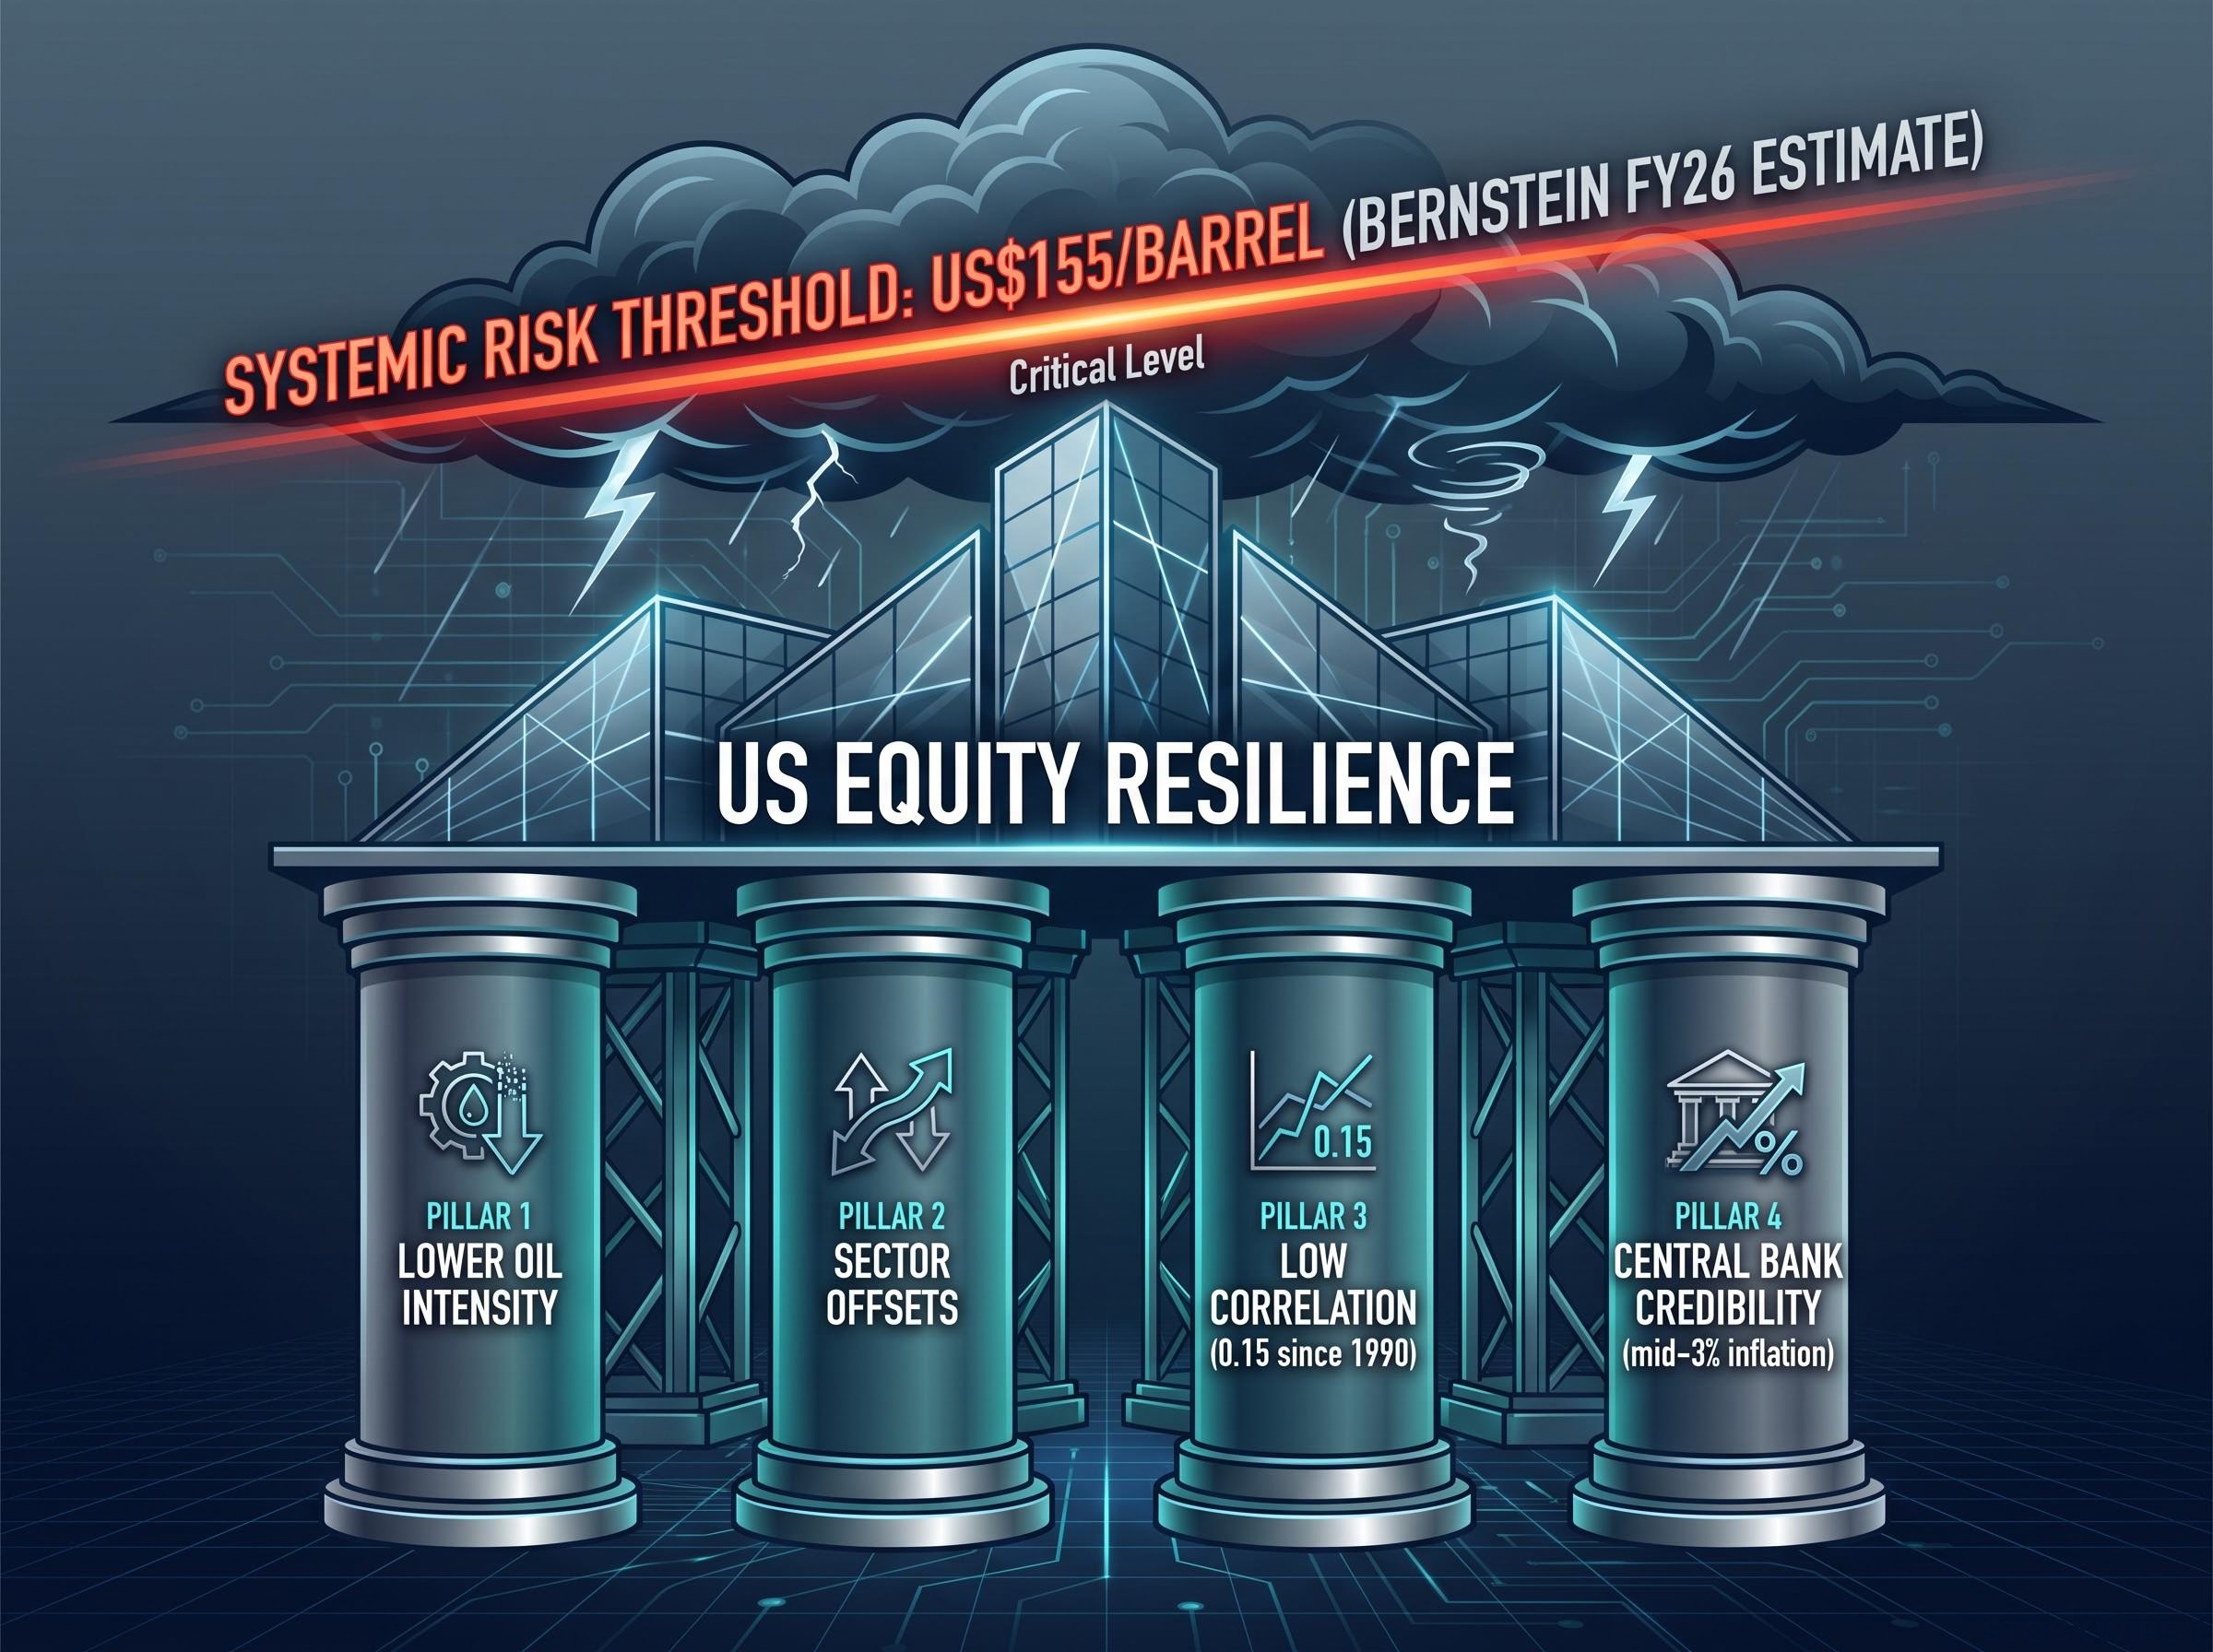
That correlation figure is the quiet key. A reading of 0.15 means oil and equities barely move together, which explains why triple-digit crude can coexist with record stock indices.
There is a mathematical ceiling to this resilience, though. Bernstein estimates that oil would need to average roughly US$155 per barrel in FY26 to recreate the severe demand-destruction burden of the 2007-2008 cycle. At $100-$120, crude squeezes consumers without crossing that systemic threshold.
None of this means the market shrugs off every spike. When Brent broke above $100 in late July 2026, the S&P 500 fell 1.2%, the Dow dropped 1%, and the Nasdaq lost 2.2% in a single session.
The lesson for you is that diversification now works differently than the old rulebook assumed. Heavy weightings in energy producers can insulate a broad index from the very shock that would once have devastated it, which is a strong argument against panic-selling on an oil headline alone.
Monitoring the demand destruction threshold
Step back, and the pattern echoes the demand-driven commodity supercycle of the 2000s, when tight supply and structural demand pushed both oil and copper sharply higher over an extended run. That parallel is the context for reading what comes next.
The single biggest risk to this rally is demand destruction: the point at which prices climb so high that buyers are forced to cut consumption outright, often dragging the economy into recession. Bernstein’s US$155 per barrel figure marks where that danger becomes systemic, and today’s oil sits well below it.
The opposite risk is a rapid unwind. Much of crude’s strength rests on a geopolitical premium. If tensions ease and normal transit through the Strait of Hormuz resumes, or if mine disruptions like Grasberg are resolved, those premiums could evaporate and pull prices back toward long-term fundamentals fast.
For a practical watch list, keep two markers in view: the $155 per barrel demand-destruction line on the upside, and any sign of easing geopolitical friction or recovering mine supply on the downside. Those two variables will decide whether this cycle extends or reverses.
For investors wanting to stress-test the downside scenarios in more depth, our full explainer on the global oil supply shock details why emergency SPR releases failed to halt inventory drawdowns and why the IEA saw no rebalancing scenario before October 2026.
This article is for informational purposes only and should not be considered financial advice. Investors should conduct their own research and consult with financial professionals before making investment decisions. Past performance does not guarantee future results. Financial projections are subject to market conditions and various risk factors.