Two of the most talked-about stocks of the August 2026 reporting season delivered record results. Both were sold off hard the same day they reported. That is the puzzle worth solving.
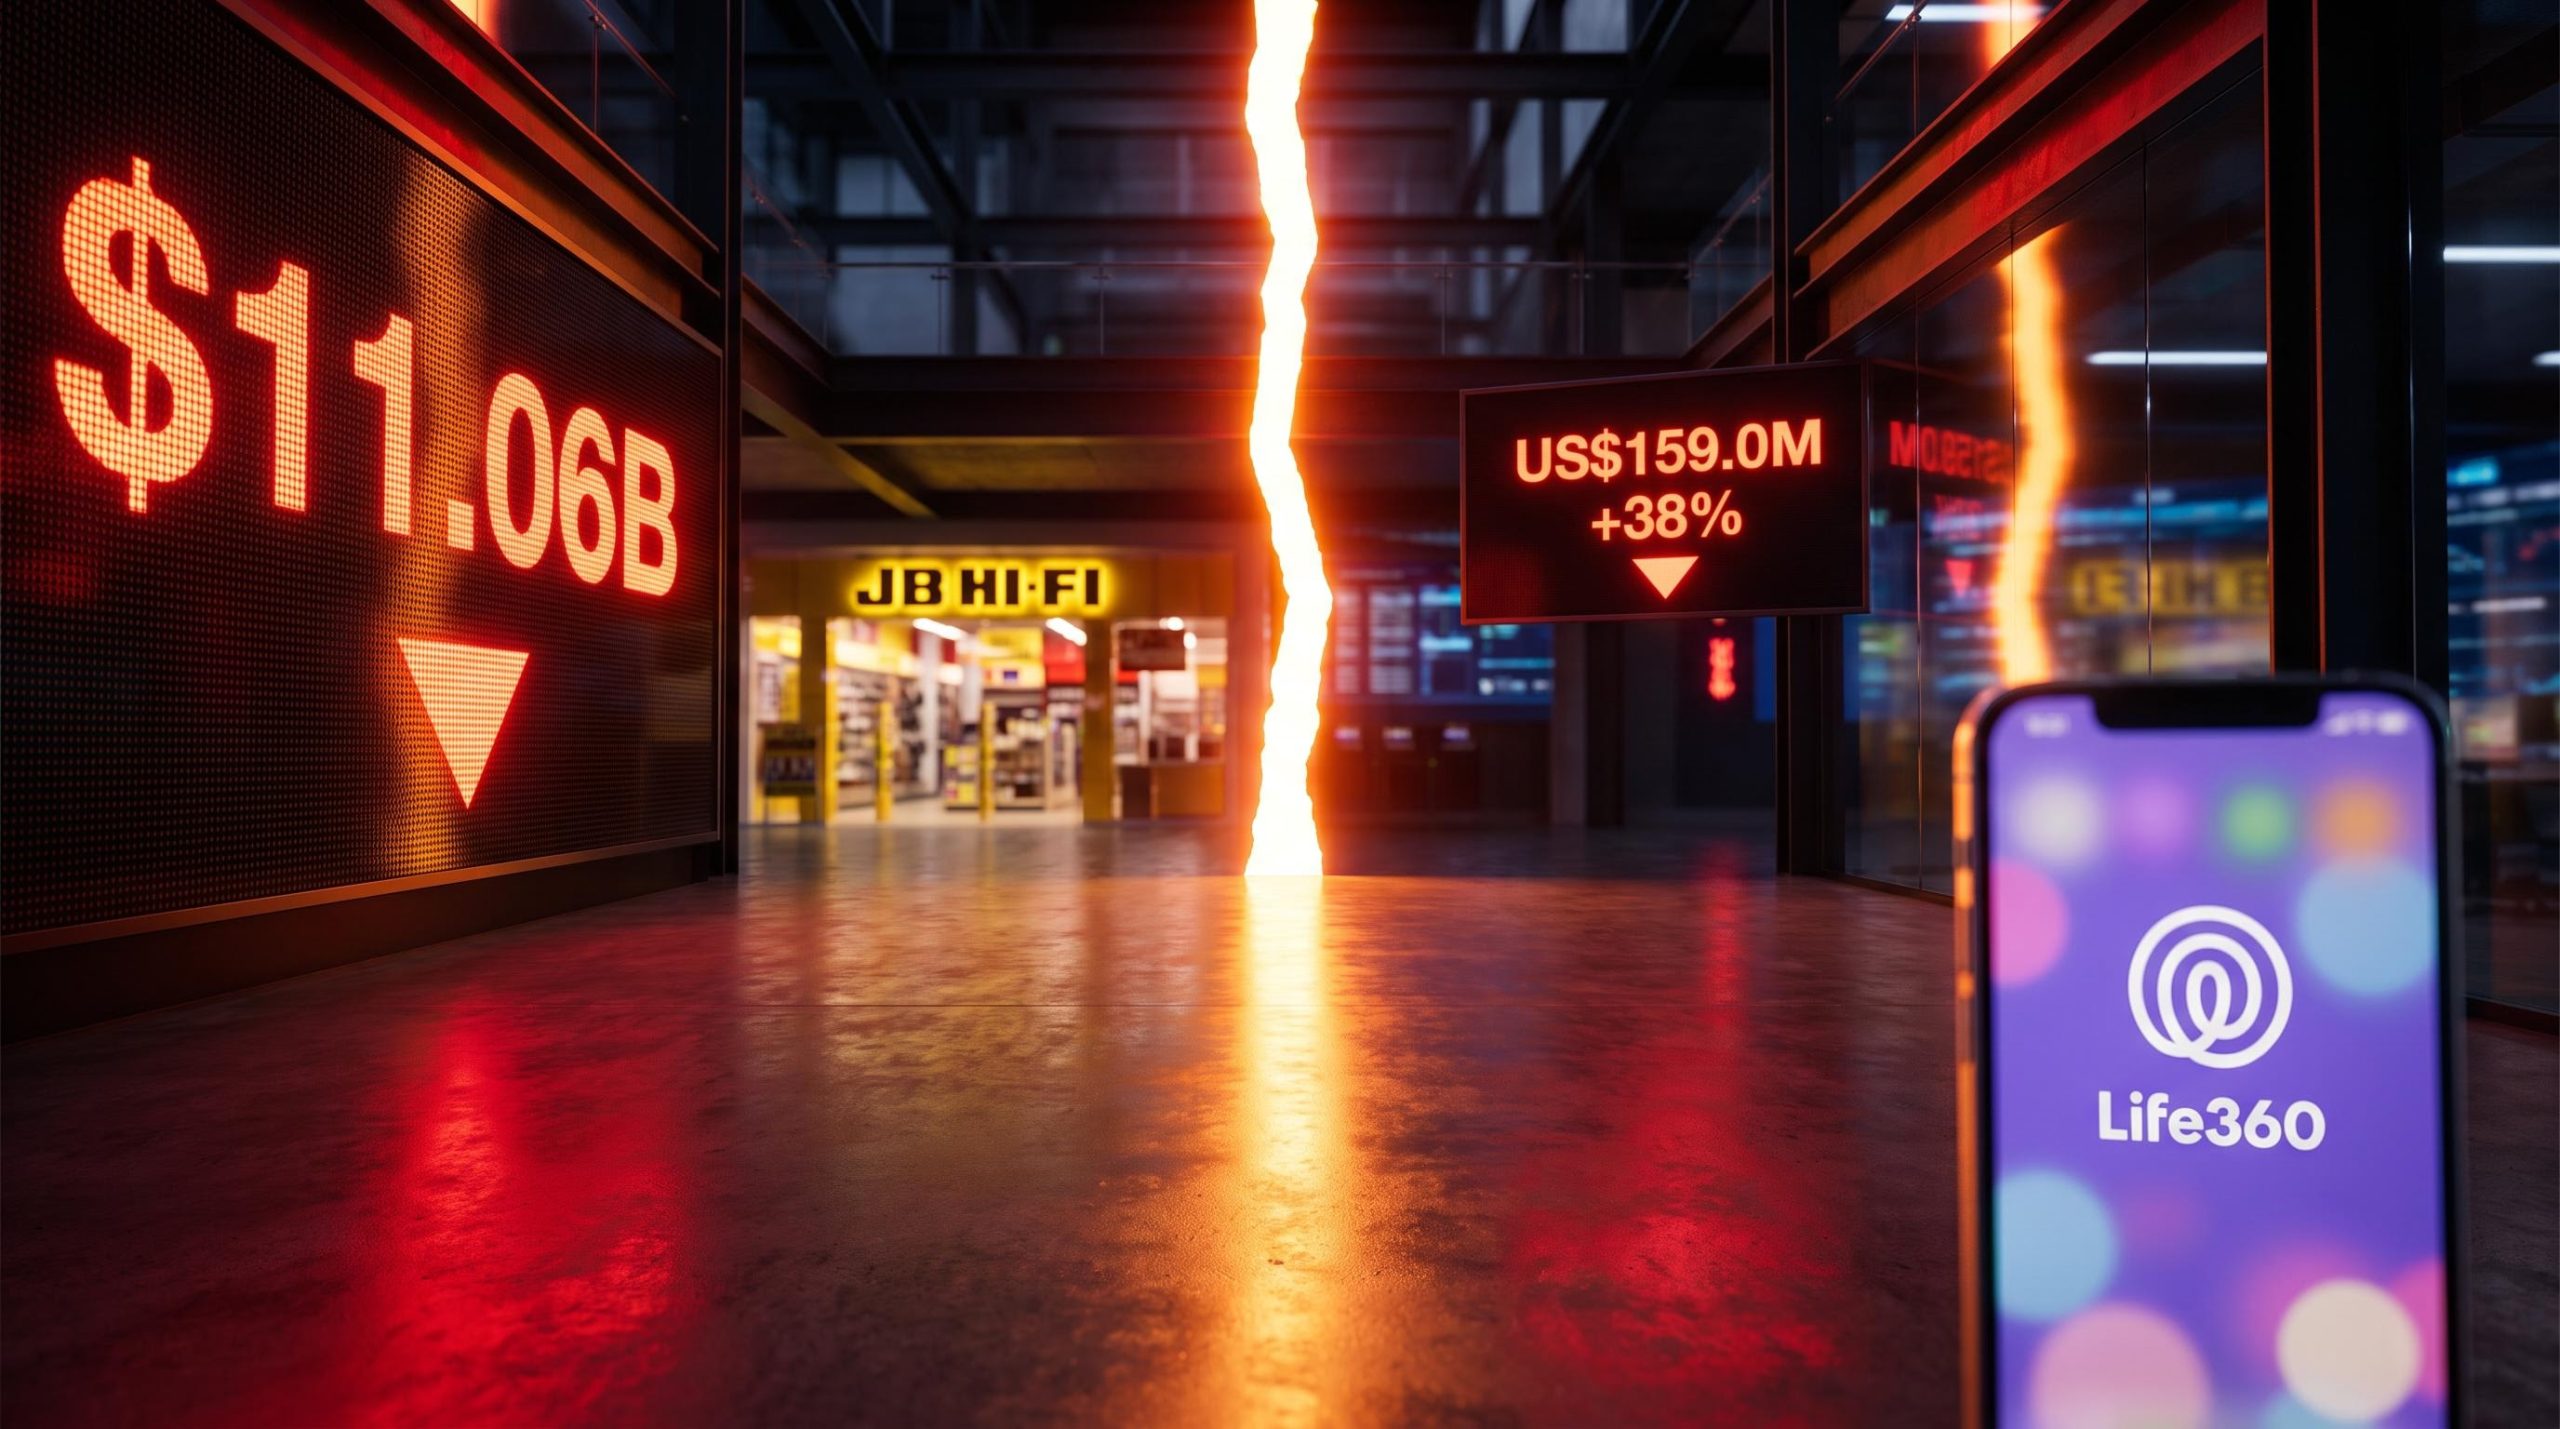
JB Hi-Fi posted record annual sales and profit, then fell more than 10%. Life360 posted record quarterly revenue and earnings, then fell up to 20% on the ASX and more than 23% on the Nasdaq.
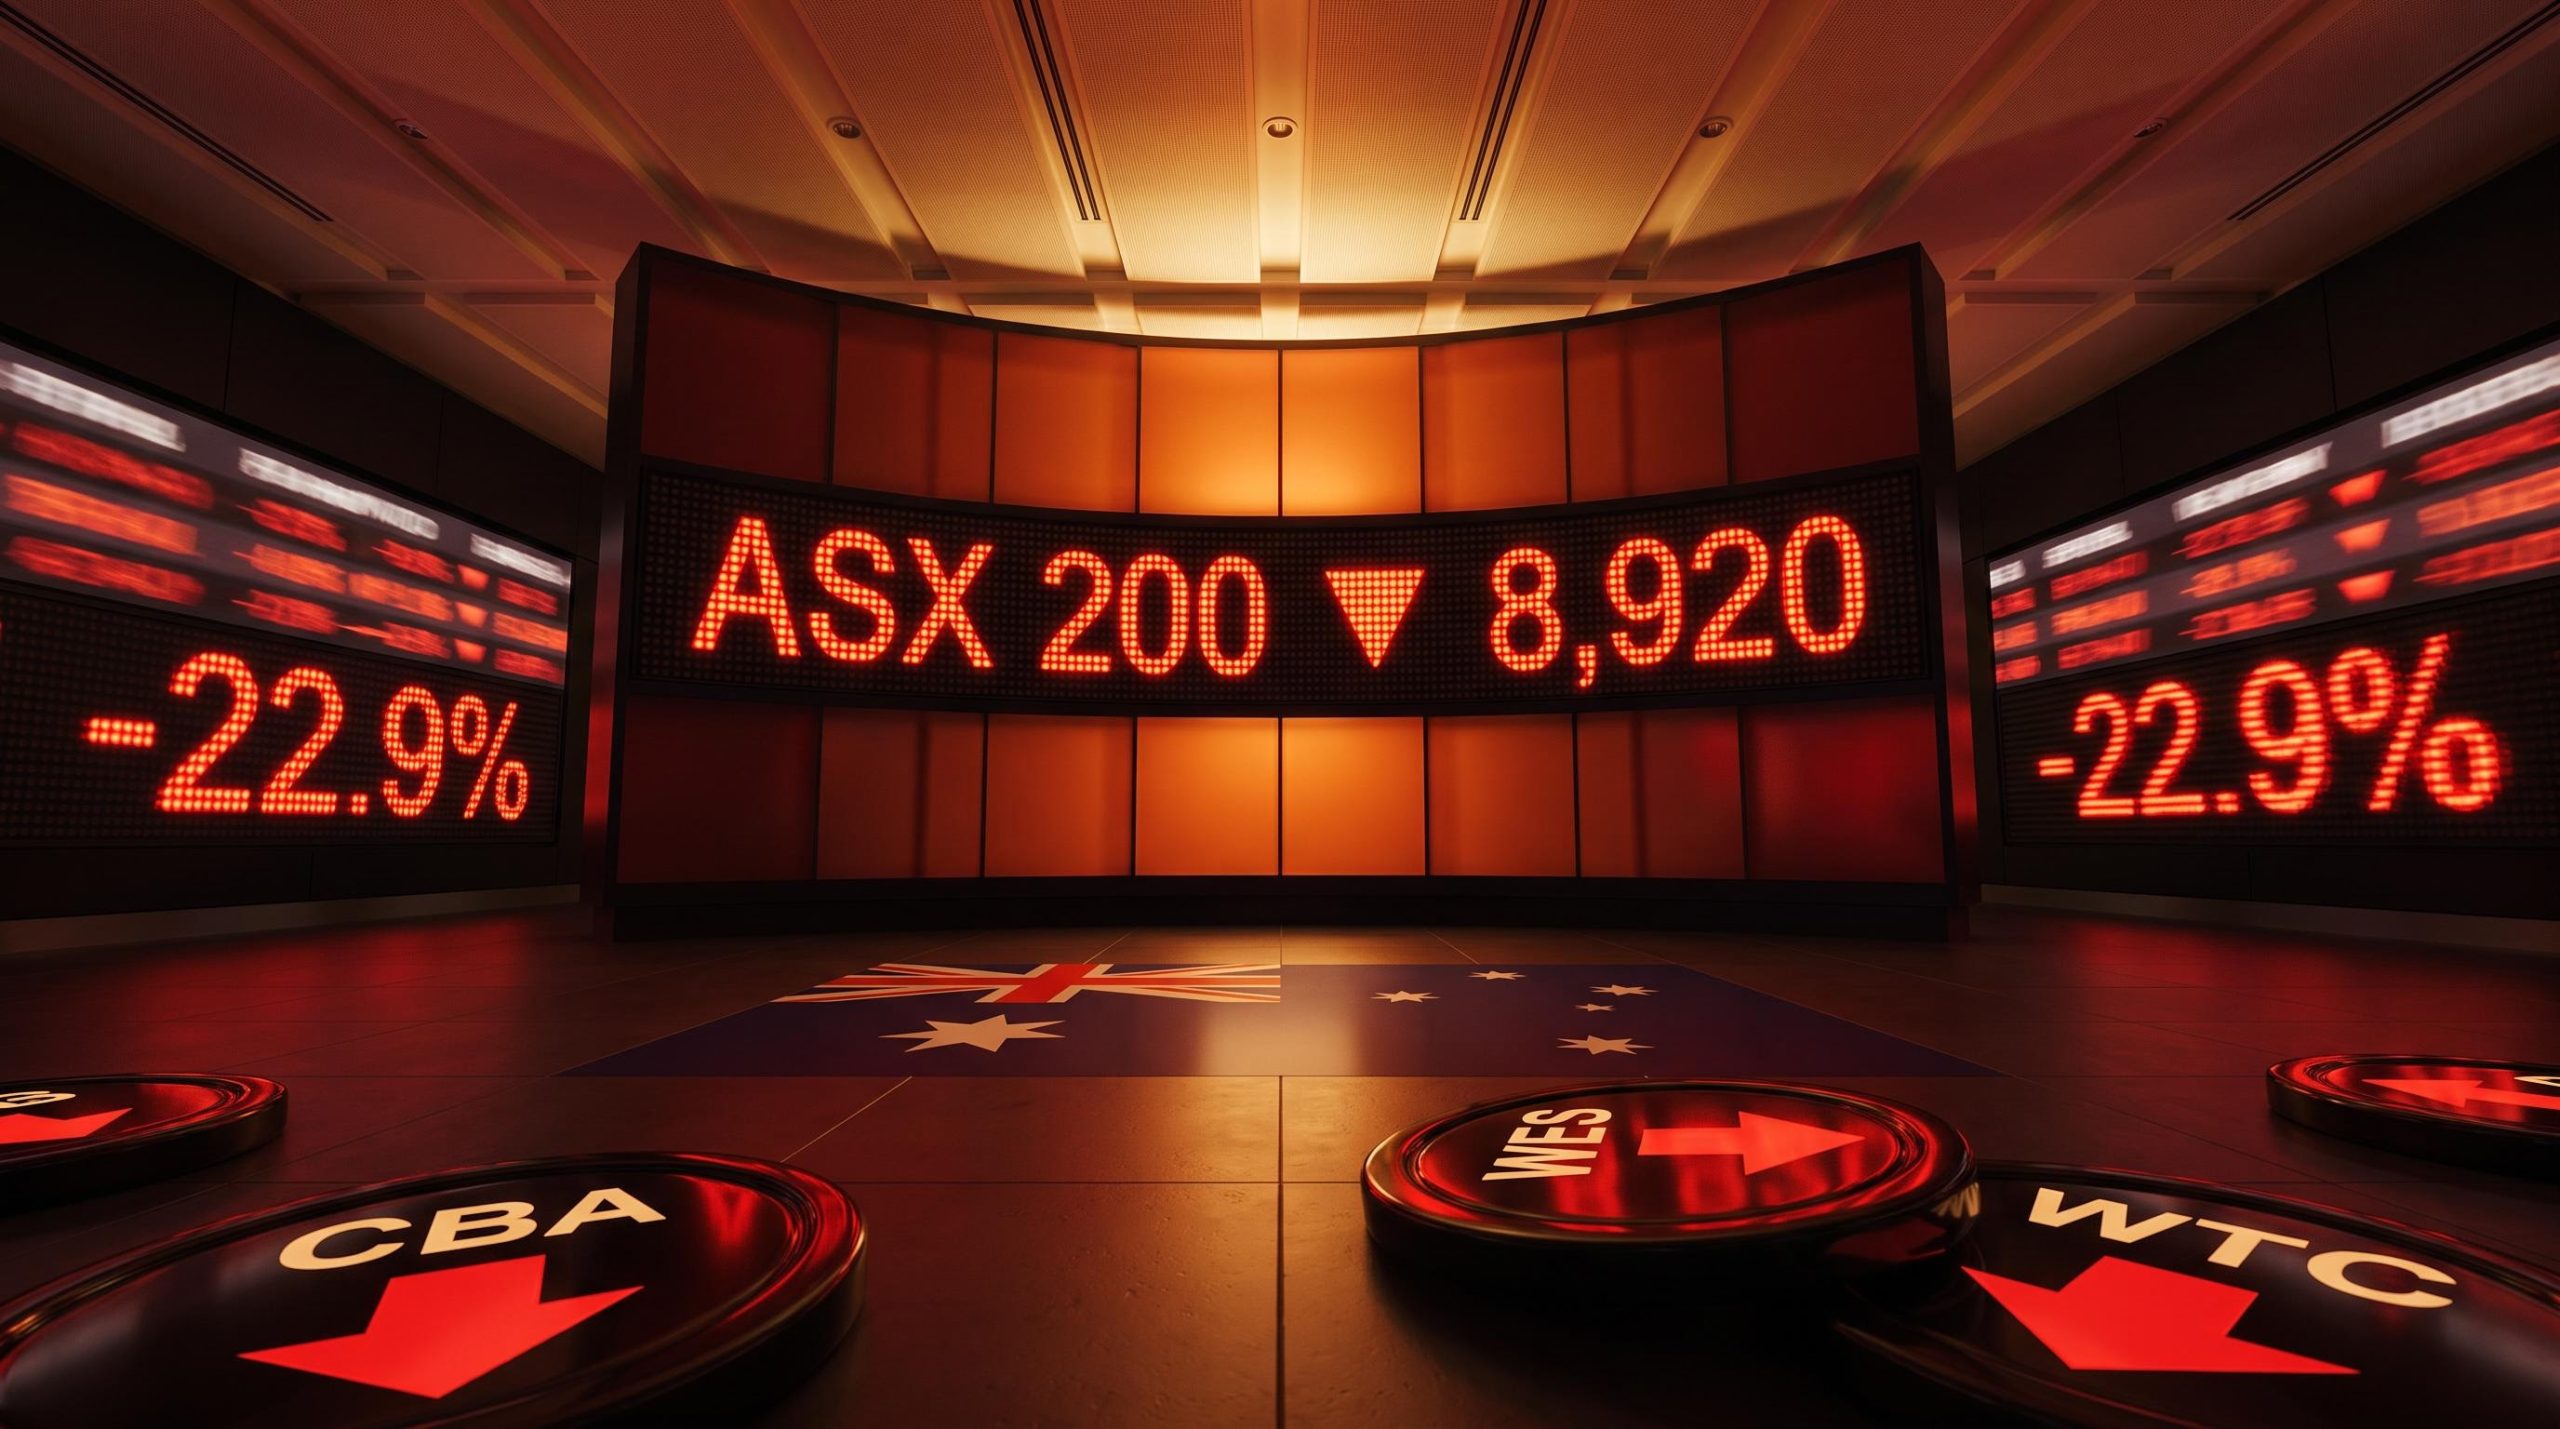
Both names muscled their way onto the ASX top 20 most-traded list in August 2026, not because of what they earned but because of how the market reacted to it. That fits the broader shape of the season: Jefferies data showed 38% of reporters beat expectations, yet consumer-facing names were punished for anything short of confident guidance.
So what happened here? After this, you will know whether the falls in JBH and 360 reflect genuine deterioration in each business or a pricing and sentiment reset, and what Morningstar’s sharply contrasting star ratings actually signal for anyone deciding whether to act.
Record numbers, falling prices: what actually drove the August selloffs
On the surface, the two stories look identical. Record results, double-digit falls, same reporting season. Look closer and the identical surface hides two very different investor verdicts.
JB Hi-Fi reported FY26 total sales of $11.06 billion, up 4.8%, and net profit after tax of $489.9 million, up 6.0%. On results day, 17 August 2026, the stock fell roughly 10.5% to 12%. The problem was not the year that had just closed; it was the quarter that ended it. Australian sales were approximately flat year-on-year through the June 2026 quarter, and momentum kept fading into July. Management declined to promise a recovery, and the market treated that silence as the story.
Life360 told the opposite version of the same trap. Q2 FY26 revenue hit US$159.0 million, up 38%, with adjusted EBITDA of US$31.1 million, up 53%. The stock still fell around 15% to 20% on the ASX and 23% to 26% on the Nasdaq around 11 August 2026. Here the trigger was not the headline numbers, which beat, but the outlook. Maintained FY26 guidance trailed analyst estimates, and quarterly earnings per share of US$0.06 missed the US$0.08 consensus.
| Metric | JB Hi-Fi (FY26) | Life360 (Q2 FY26) |
|---|---|---|
| Results release | 17 August 2026 | 10 August 2026 (US time) |
| Revenue / sales | $11.06 billion (+4.8%) | US$159.0 million (+38%) |
| Profit metric | $489.9 million NPAT (+6.0%) | US$31.1 million adj. EBITDA (+53%) |
| Share price fall (results day) | ~10.5-12% | ~15-20% ASX; ~23-26% Nasdaq |
| Primary trigger | Q4 slowdown, no FY27 recovery narrative | Guidance trailed estimates, modest EPS miss |
Both falls were a repricing of forward expectations, not a verdict on whether these are good or bad businesses. That distinction matters for you, because the size of a drop tells you nothing on its own. Knowing which driver applies to each stock is the first step toward judging whether the move was rational or an overreaction you can use.
When big ASX news breaks, our subscribers know first
JB Hi-Fi’s valuation gap and what the margin maths requires
Here is where JBH gets interesting. Even after the fall, Morningstar still thinks the stock is expensive.
JBH valuation multiples tell a consistent story across multiple points in 2026: even after a 26% drawdown from early-year highs, the price-to-sales ratio remained approximately 16% above its five-year historical average, which is why Morningstar’s two-star rating after the August fall is the continuation of a view held well before results day rather than a reactive call.
Morningstar’s fair value estimate sits at $58.00 per share, roughly 15% below the market price as of 9 September 2026. The rating is two stars, and Morningstar assigns no economic moat, meaning it sees no durable competitive advantage protecting JB Hi-Fi’s returns from rivals over the long run.
The heart of the argument is a single number most investors never see. For the current share price to be justified, Morningstar calculates that JB Hi-Fi’s EBIT margins (operating profit as a share of sales) would need to average 7.5% over the next decade.
The margin maths that drives the two-star rating JBH delivered a 6.6% underlying EBIT margin in FY26. The current price assumes the business can sustain 7.5% for ten years, roughly 90 basis points higher. The stock is priced for a margin it has not yet demonstrated.
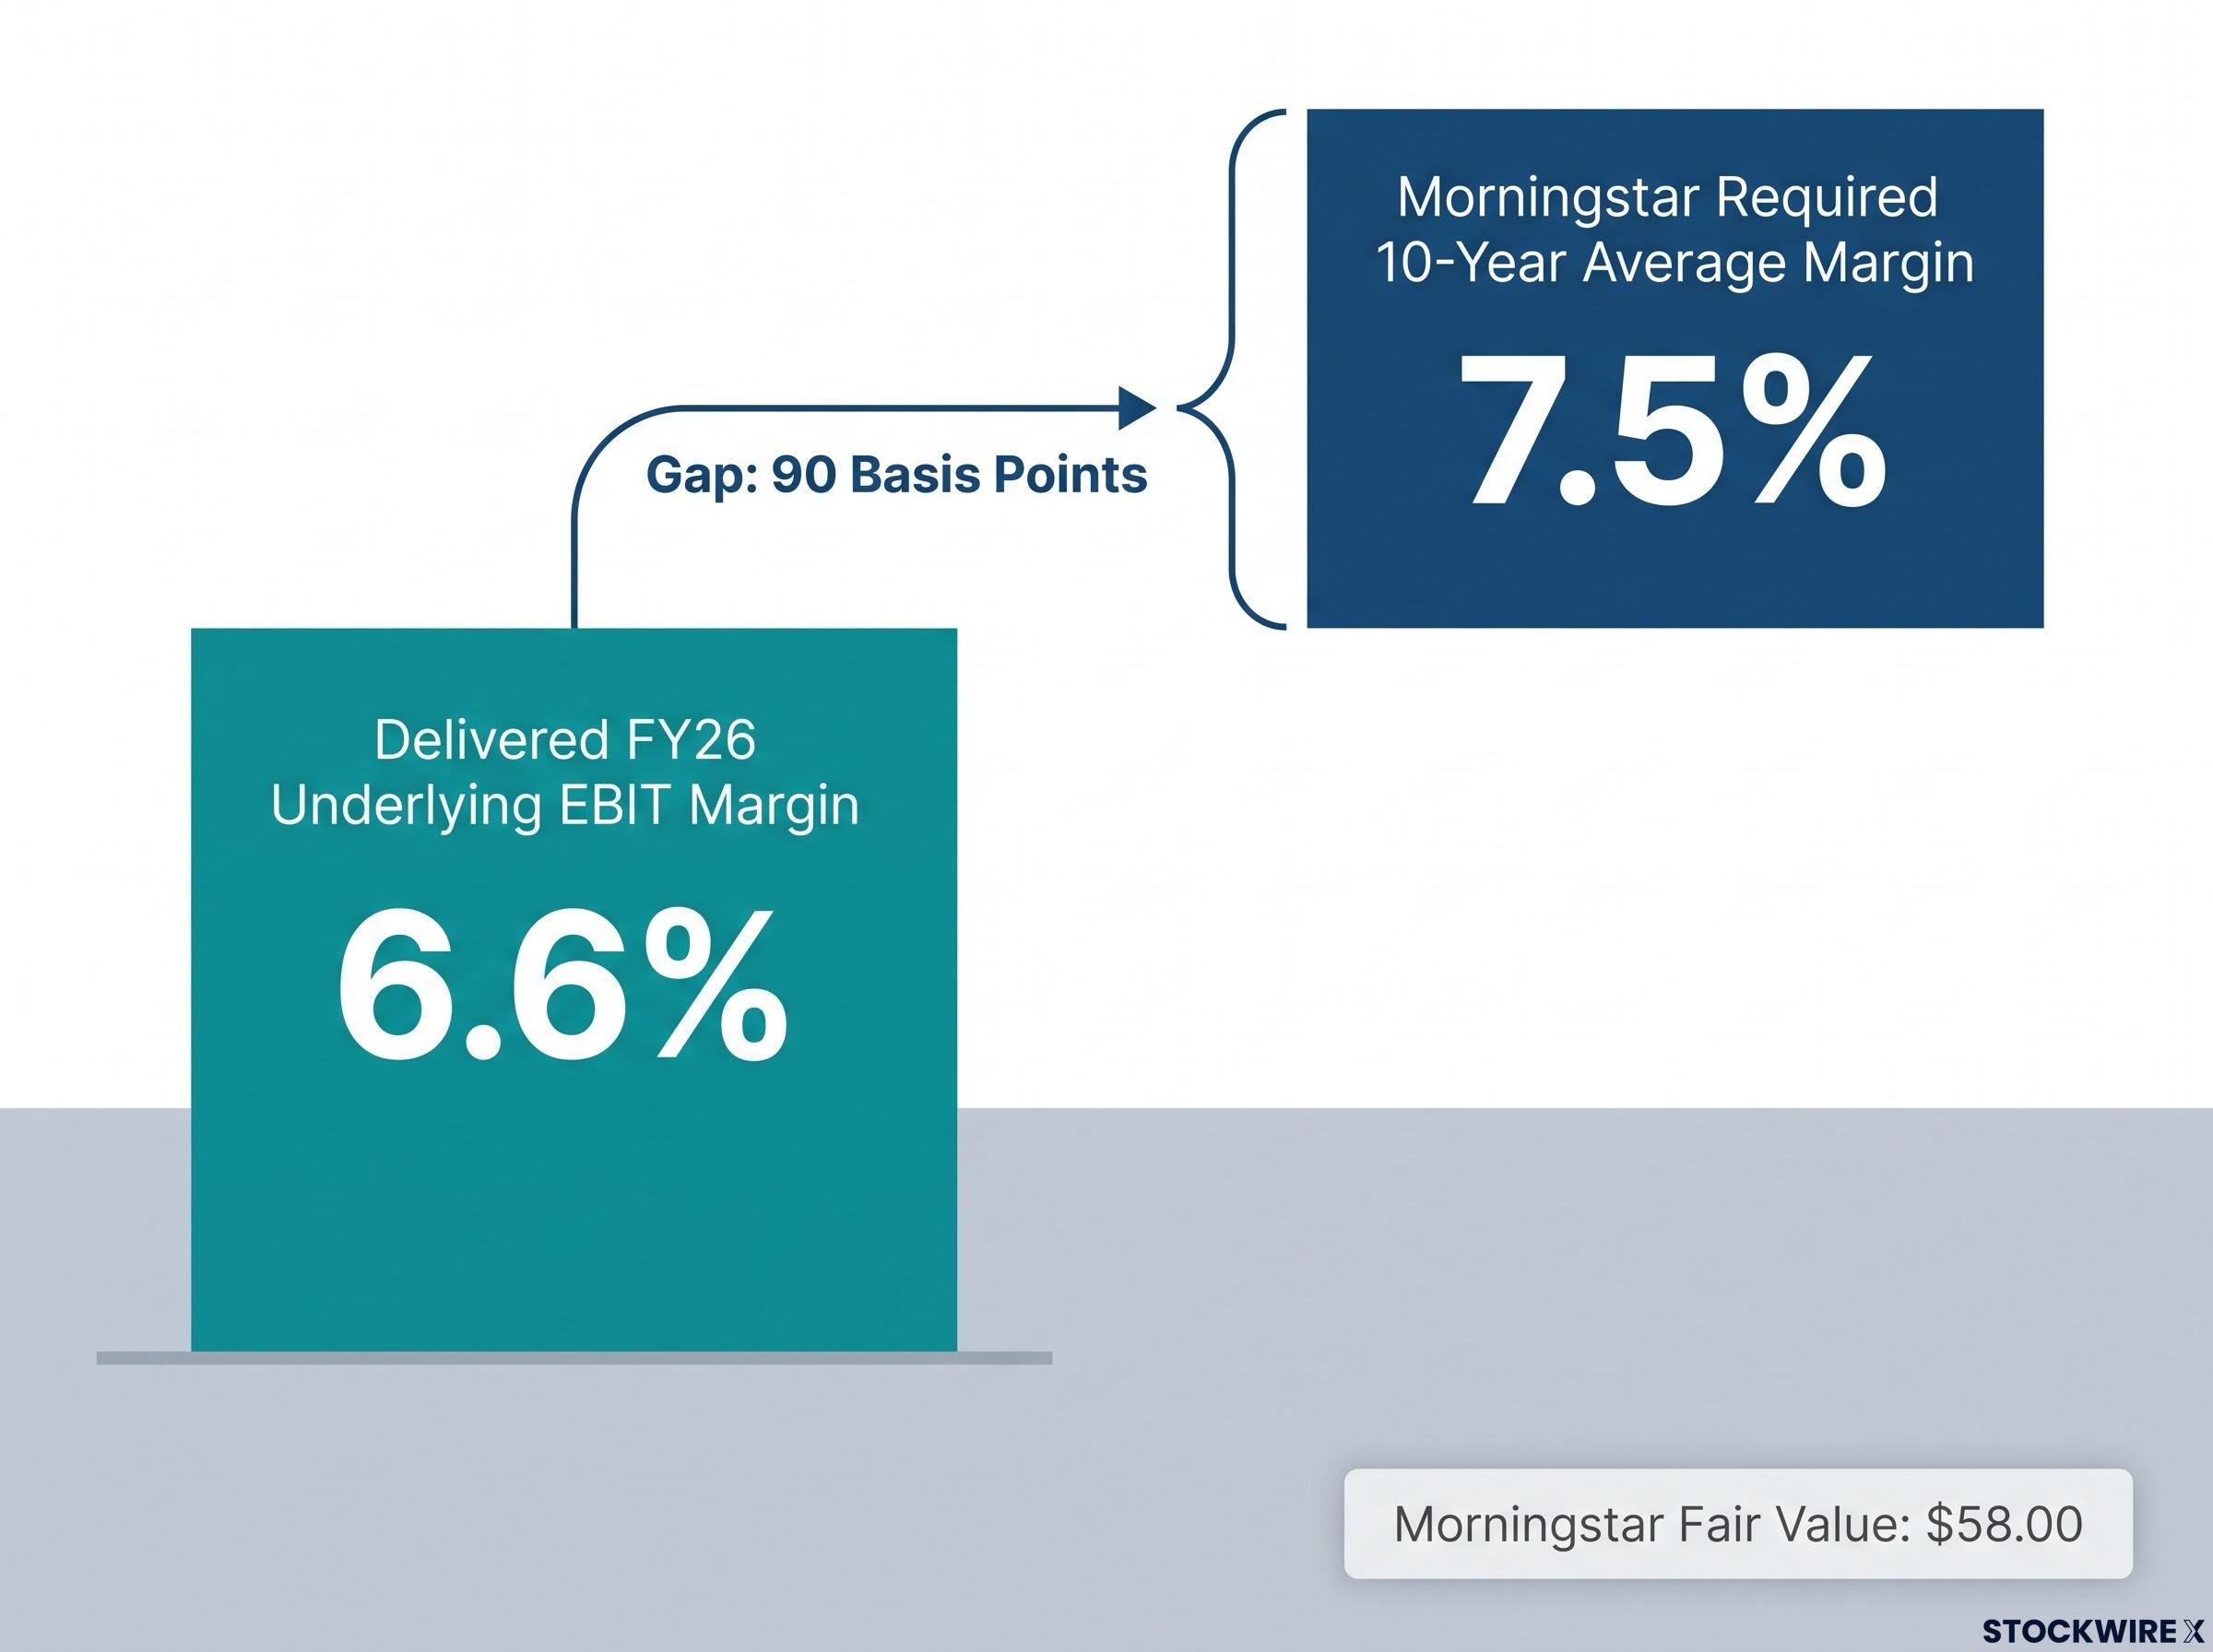
That gap is the whole thesis. And the near-term backdrop makes closing it harder, not easier. Three structural headwinds sit in the way:
- Competitive pressure across consumer electronics and appliances, which points to more promotional activity and thinner margins.
- Cost-of-living strain, as rising inflation and higher interest rates squeeze household budgets and dampen demand for discretionary purchases.
- Memory chip price increases, driven by data centre demand, being passed through to buyers who are resisting higher computer prices.
None of this means JB Hi-Fi is heading for a fall. Morningstar still projects group sales growth of around 4% in FY27, supported by growing household incomes. The FY26 dividend held up strongly too: a final dividend of 127.0 cents per share, up 21%, and a total ordinary dividend of 337.0 cents, up 22.5%, or 75% of NPAT.
JB Hi-Fi investor relations disclosures, including the FY26 annual results presentation, provide the primary source for the margin and dividend figures that underpin valuation arguments on both sides of the current debate.
For you, the two-star rating reframes the question. It is not “was FY26 a good result?” It clearly was. It is “does the price already assume a better result than FY26 delivered?” On Morningstar’s numbers, it does, and the current environment makes that assumed improvement harder to reach.
Life360’s valuation discount and why the growth thesis remains intact
Life360 forces the opposite conclusion, and to understand why, you have to sit with the one number that spooked the market: user growth is slowing, and it has been for two years.
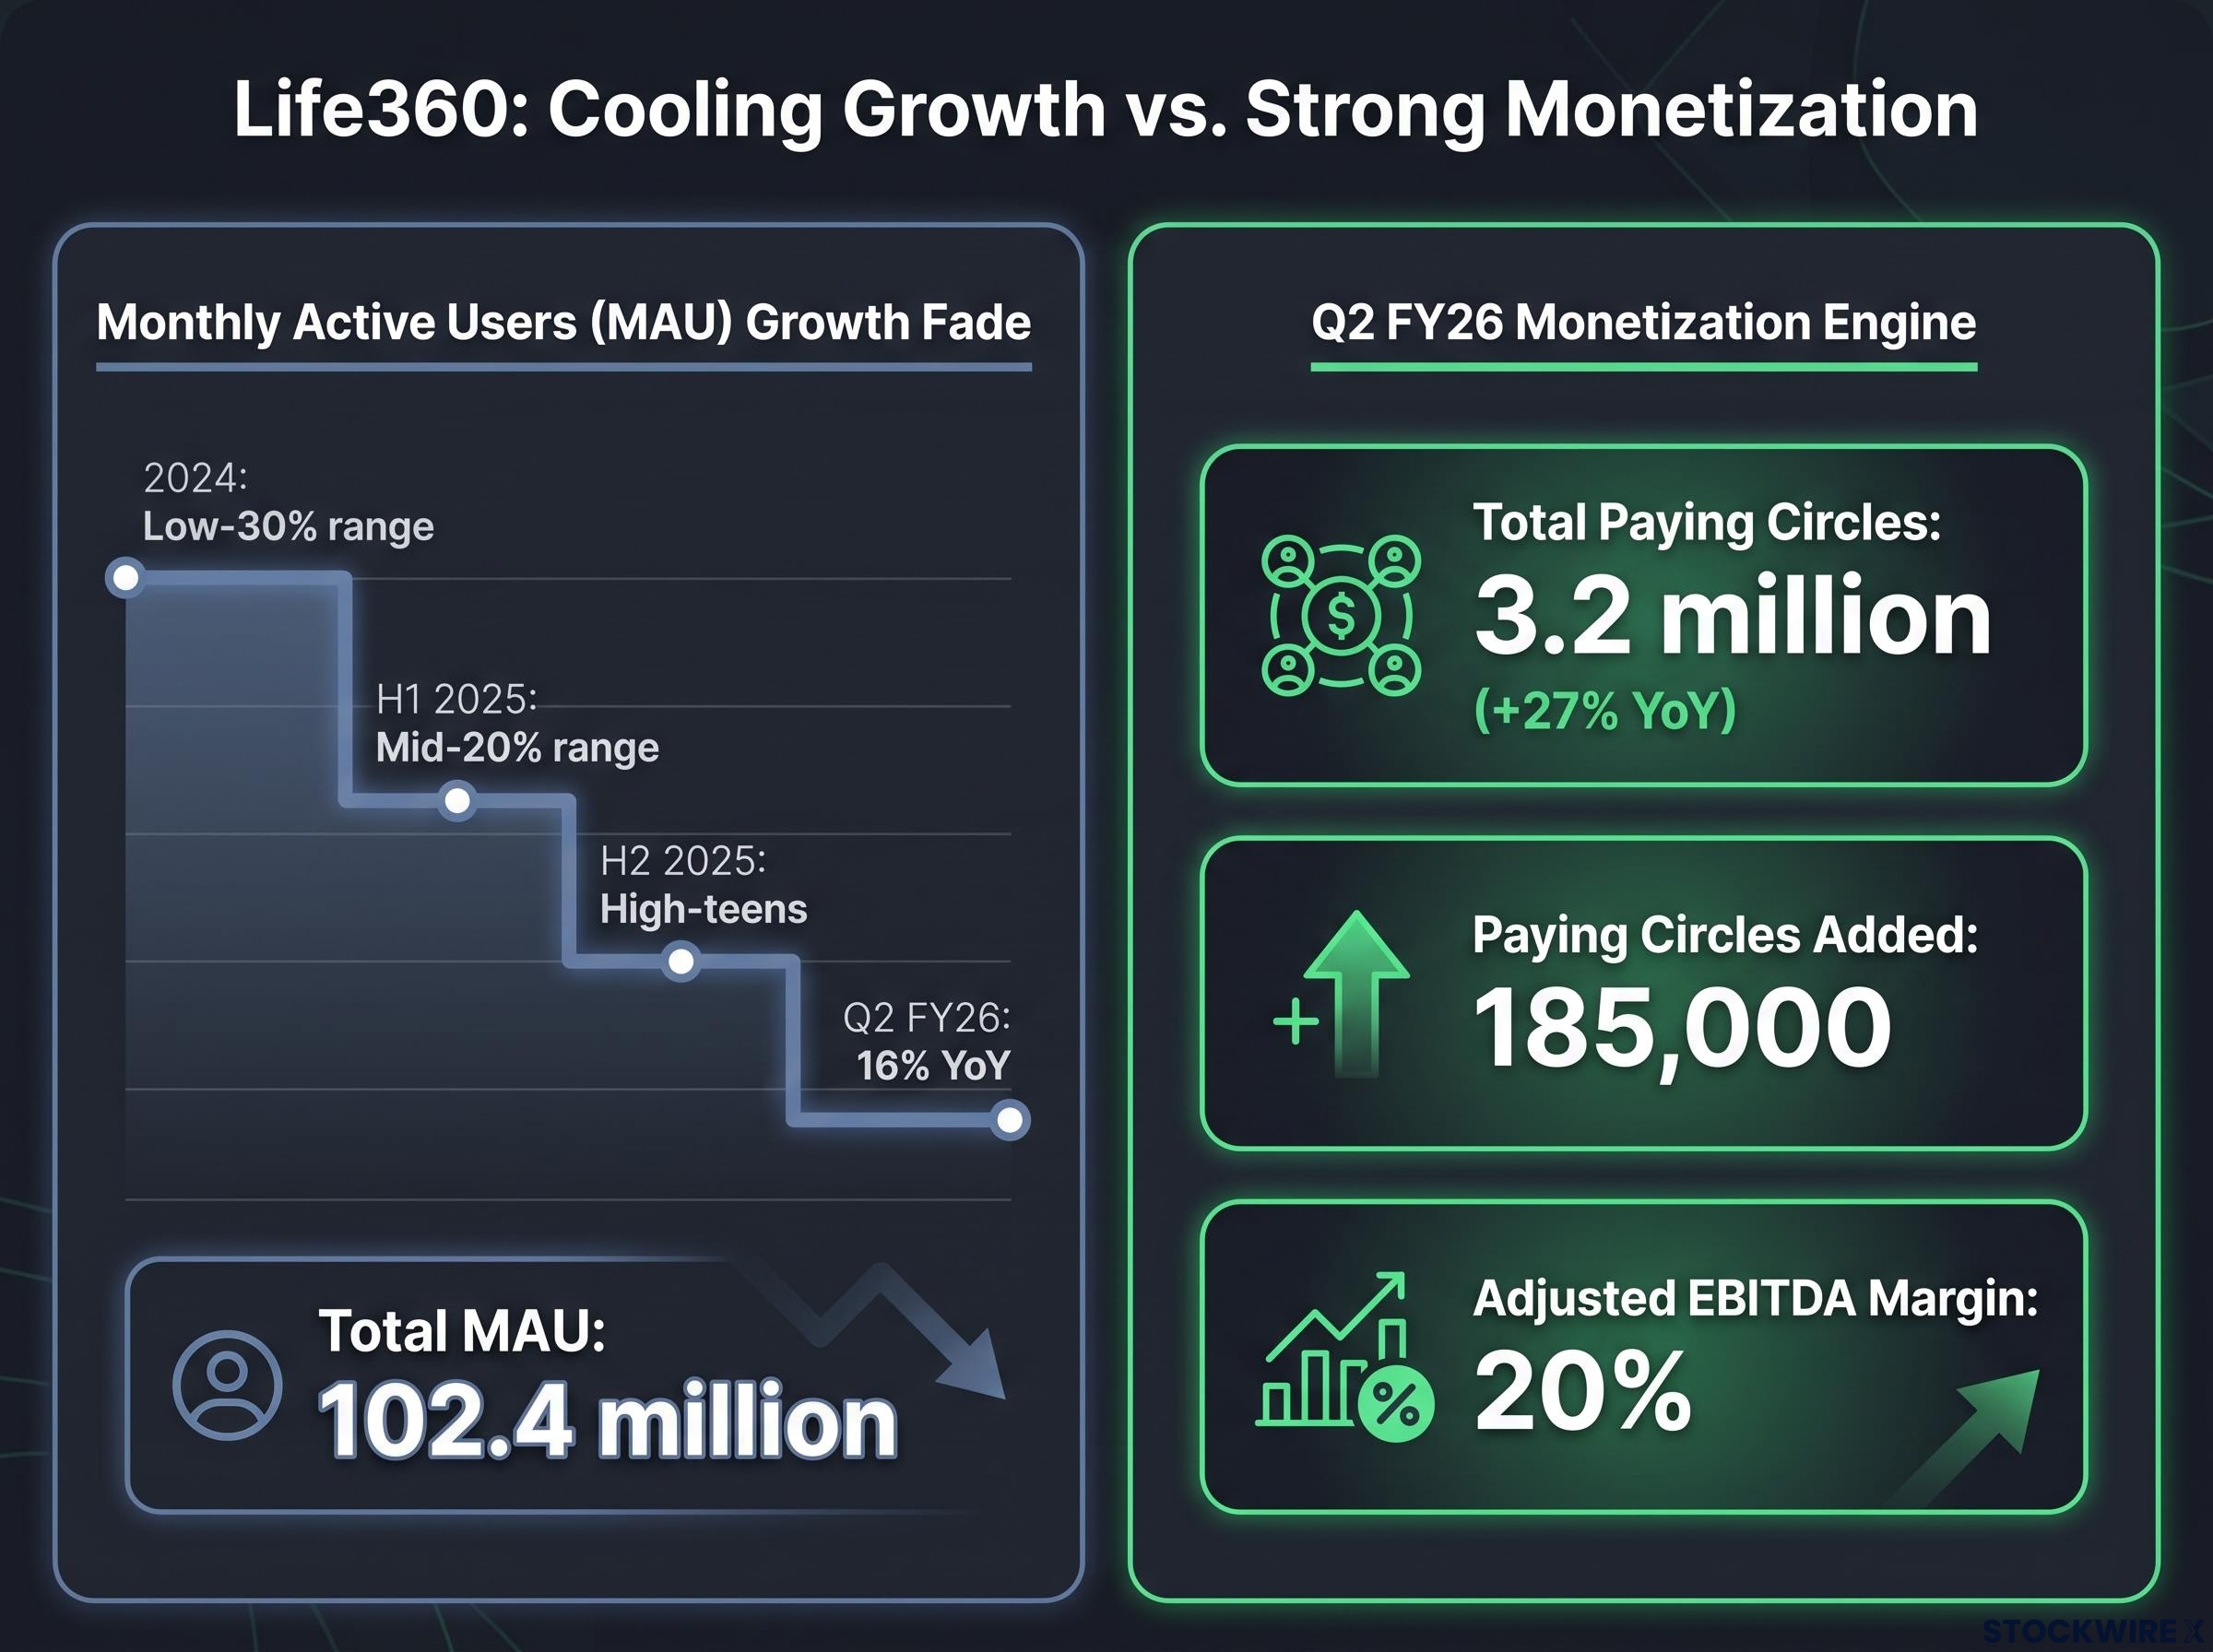
The deceleration in monthly active users (the count of people using the app each month) is not subtle when you lay it out:
- Low-30% range in 2024.
- Mid-20% range in the first half of 2025.
- High-teens in the second half of 2025.
- 16% year-on-year in Q2 FY26, at 102.4 million total MAU.
That is a clear, sustained fade, and for a stock whose valuation leans on future user expansion, it is a legitimate concern rather than noise. The market saw the trend line and repriced accordingly.
Yet Morningstar has not moved. It rates Life360 four stars with a fair value of $25.50, roughly 20% below the market price as of 9 September 2026, and it has kept its 10-year assumption of a 12% MAU compound annual growth rate unchanged after the quarter.
The Life360 profitability inflection that Morningstar is anchoring its four-star rating to was confirmed at the FY25 result: adjusted EBITDA surged 105% and operating cash flow rose 172% in a single year, establishing the freemium model as genuinely scalable before the Q2 FY26 guidance wobble reopened the debate about execution pace.
Why hold firm? Because the underlying business kept performing. Paying circles (the family groups paying for a subscription) added a record 185,000 in the quarter, reaching 3.2 million, up 27% year-on-year. Adjusted EBITDA margin came in at 20%, and average revenue per paying circle rose about 5% year-on-year. The engine monetising users is running, even as raw user growth cools.
GuruFocus tied the single-day fall of nearly 26% to valuation concerns and insider selling, arguing the stock’s prior strength left no room for even a small guidance wobble. By 26 August 2026, Motley Fool Australia reported Life360 shares at $20.67, down roughly 56% from their 2026 peak.
A four-star rating after a 56% drawdown is Morningstar saying the market has overshot to the downside. Before you treat that as an endorsement, the honest test is this: what would have to go permanently wrong with the growth story to make Morningstar wrong? That question is the whole investment case.
International runway and the bull case for 360
The bull case rests on two penetration figures. In the US, Life360’s market penetration nearly tripled between 2020 and 2026 to roughly 17%, with some high-engagement states approaching 25%. In Europe, penetration rose fivefold over the same span to just 2%.
That European number is the point. Two percent leaves an enormous runway if the app travels the way it has in the US.
Management attributed the early-quarter slowdown to temporary technical issues and pointed to a shift in marketing spend into the third quarter, expecting user growth to reaccelerate in the second half. Morningstar has accepted that explanation, which is why its 12% MAU CAGR assumption survived the quarter intact.
One caveat you should weigh. Independent named-analyst confirmation of the European expansion thesis, beyond Morningstar’s own assessment and the company’s guidance, was not found in the research. Treat the international story as primarily company-guided and Morningstar-assessed rather than backed by broad analyst consensus.
What the August 2026 reporting season reveals about reading post-earnings reactions
Step back from these two stocks and a pattern comes into focus that explains both.
The asymmetry documented across February 2026 reporting season underpins the post-earnings repricing mechanics that made August 2026 so punishing for consumer names: FactSet data showed large-cap ASX misses were penalised approximately 2.3 times harder than beats were rewarded, which explains why a maintained guidance line landed as a de facto downgrade for Life360.
More than 250 companies reported FY26 results in August. ASX 200 earnings per share grew around 11%, but almost all of that came from resources. Jefferies data put the split at 38% beating and 19% missing, a season one commentator called solid but uneven.
The dividing line was not the numbers. It was the tone. BHP rewarded shareholders with underlying attributable profit growth of 30% on the back of strong commodity results, with none of the guidance sensitivity that punished consumer names. CSL even surged 17% in a single session, a move attributed more to benchmark positioning than to the quality of its earnings.
Consumer-facing stocks got the harshest treatment.
DiscoveryAlert on the season’s weak spot Consumer discretionary was described as “the season’s most consistently difficult segment,” with management teams unwilling to forecast a recovery their own order books could not yet support. JB Hi-Fi’s caution fit that mould exactly.
JBH and Life360 both entered the ASX top 20 most-traded list in August 2026, per Sharesight data, precisely because earnings-day activity dominated the tape. The lesson for you is a repeatable framework you can apply to the next reporting season:
- Distinguish the trigger. Was the selloff caused by guidance tone, a headline miss, or a valuation reset? These are not the same thing and do not carry the same weight.
- Check the fair value gap. Compare an analyst’s fair value against the current price to see whether the move has opened a genuine discount or simply removed an overvaluation.
- Assess thesis integrity. Decide whether the structural story is intact or actually impaired. A cooling growth rate is not automatically a broken thesis.
The takeaway is simple to state and hard to practise. After any large post-earnings move in a high-priced consumer or growth stock, the first question is not “how big was the fall?” It is “what caused it?”
Two stocks, two verdicts, one decision for investors
This is where the two cases part ways, and neither offers a tidy answer.
Morningstar rates JB Hi-Fi two stars, fair value $58, roughly 15% below market as of 9 September 2026. The read is that the 10% to 12% fall did not go far enough, because the price still assumes a 7.5% long-run EBIT margin against the 6.6% delivered in FY26. Life360 sits at four stars, fair value $25.50, about 20% below market, and roughly 56% below its 2026 peak. There the read is that the market overshot, conditional on the 12% MAU growth assumption holding.
One detail the star contrast can hide: neither stock has an economic moat in Morningstar’s view. That is a shared risk factor, and it means both fair values are starting points for your own due diligence, not conclusions to lean on.
Morningstar’s economic moat framework classifies competitive advantages across five sources: intangible assets, switching costs, network effects, cost advantage, and efficient scale, and assigning no moat to JBH means the analyst team sees none of these operating durably enough to protect margins from a competitor willing to price aggressively in consumer electronics.
Here is the decision laid bare:
- JB Hi-Fi, the bear case the market is pricing: the stock still assumes a margin recovery FY26 did not show. The question you must answer: does the dividend yield at current prices compensate you for the missing moat and the margin uncertainty?
- Life360, the bull case the market is pricing out: a 56% drawdown may have overshot the real deterioration in the growth story. The question you must answer: is the international expansion thesis credible enough to accept that drawdown and a management-guided recovery without independent analyst consensus behind it?
Answer those two questions honestly and you have done the work that a star rating alone cannot do for you.
This article is for informational purposes only and should not be considered financial advice. Investors should conduct their own research and consult with financial professionals before making investment decisions. Past performance does not guarantee future results. Financial projections are subject to market conditions and various risk factors.