The DXY has just posted its fourth consecutive losing session, the 14-day RSI is sitting at roughly 37, and the index is trading below both of its key exponential moving averages. For anyone watching the dollar, that technical posture lands on the worst possible timing.
August PPI drops today at 8:30 a.m. ET, August CPI follows tomorrow, and the Federal Reserve convenes in five days. The chart is weak, but the macro backdrop is genuinely unresolved.
Here is the tension at the heart of it. Markets are pricing a better-than-even chance of a September rate hike, while 90% of surveyed economists expect the Fed to stay exactly where it is. That gap does not cancel out; it compresses into the next 48 hours of data. Here is the full picture before the data lands: the chart reality, the structural pressures beneath it, and the scenario framework that lets you hold both the bull and bear cases at once ahead of Friday’s close.
What the chart is telling traders right now
Start with the cleanest read of the evidence. The dollar index closed at 98.84 on Tuesday, 8 September 2026, according to MarketWatch, and traded near 98.70 during Asian hours on Thursday. That is a pullback of roughly 3 percentage points from the 52-week high near 101.80, and it puts the index at its weakest level in four months.
The dollar index “fell to around 98.6 on Wednesday, sliding for the third straight session to its weakest level in four months,” according to TradingEconomics.
One indicator alone would be noise. The problem for dollar bulls is that the signals are stacking in the same direction.
The current DXY technical posture closely mirrors the setup documented ahead of the July CPI release, when the index was pressing the 100 handle with RSI in the high-30s and MACD below zero, and the subsequent soft print drove a slide toward 100.7 that validated the bearish moving-average structure rather than reversing it.
- Four straight losing sessions, with the index sitting near 98.70 against a 52-week high of about 101.80
- The short-term EMA has crossed below the longer-term EMA, an arrangement that points momentum lower rather than simply marking where price sits
- The 14-day RSI at approximately 37, deep in bearish territory but not yet oversold
- Clustered resistance overhead at the nine-day and 50-day EMAs
- A potential demand zone below 98.75, with no clearly defined support beneath it
- The FXS Fed Sentiment Index near 125.72, a secondary signal of some stabilisation
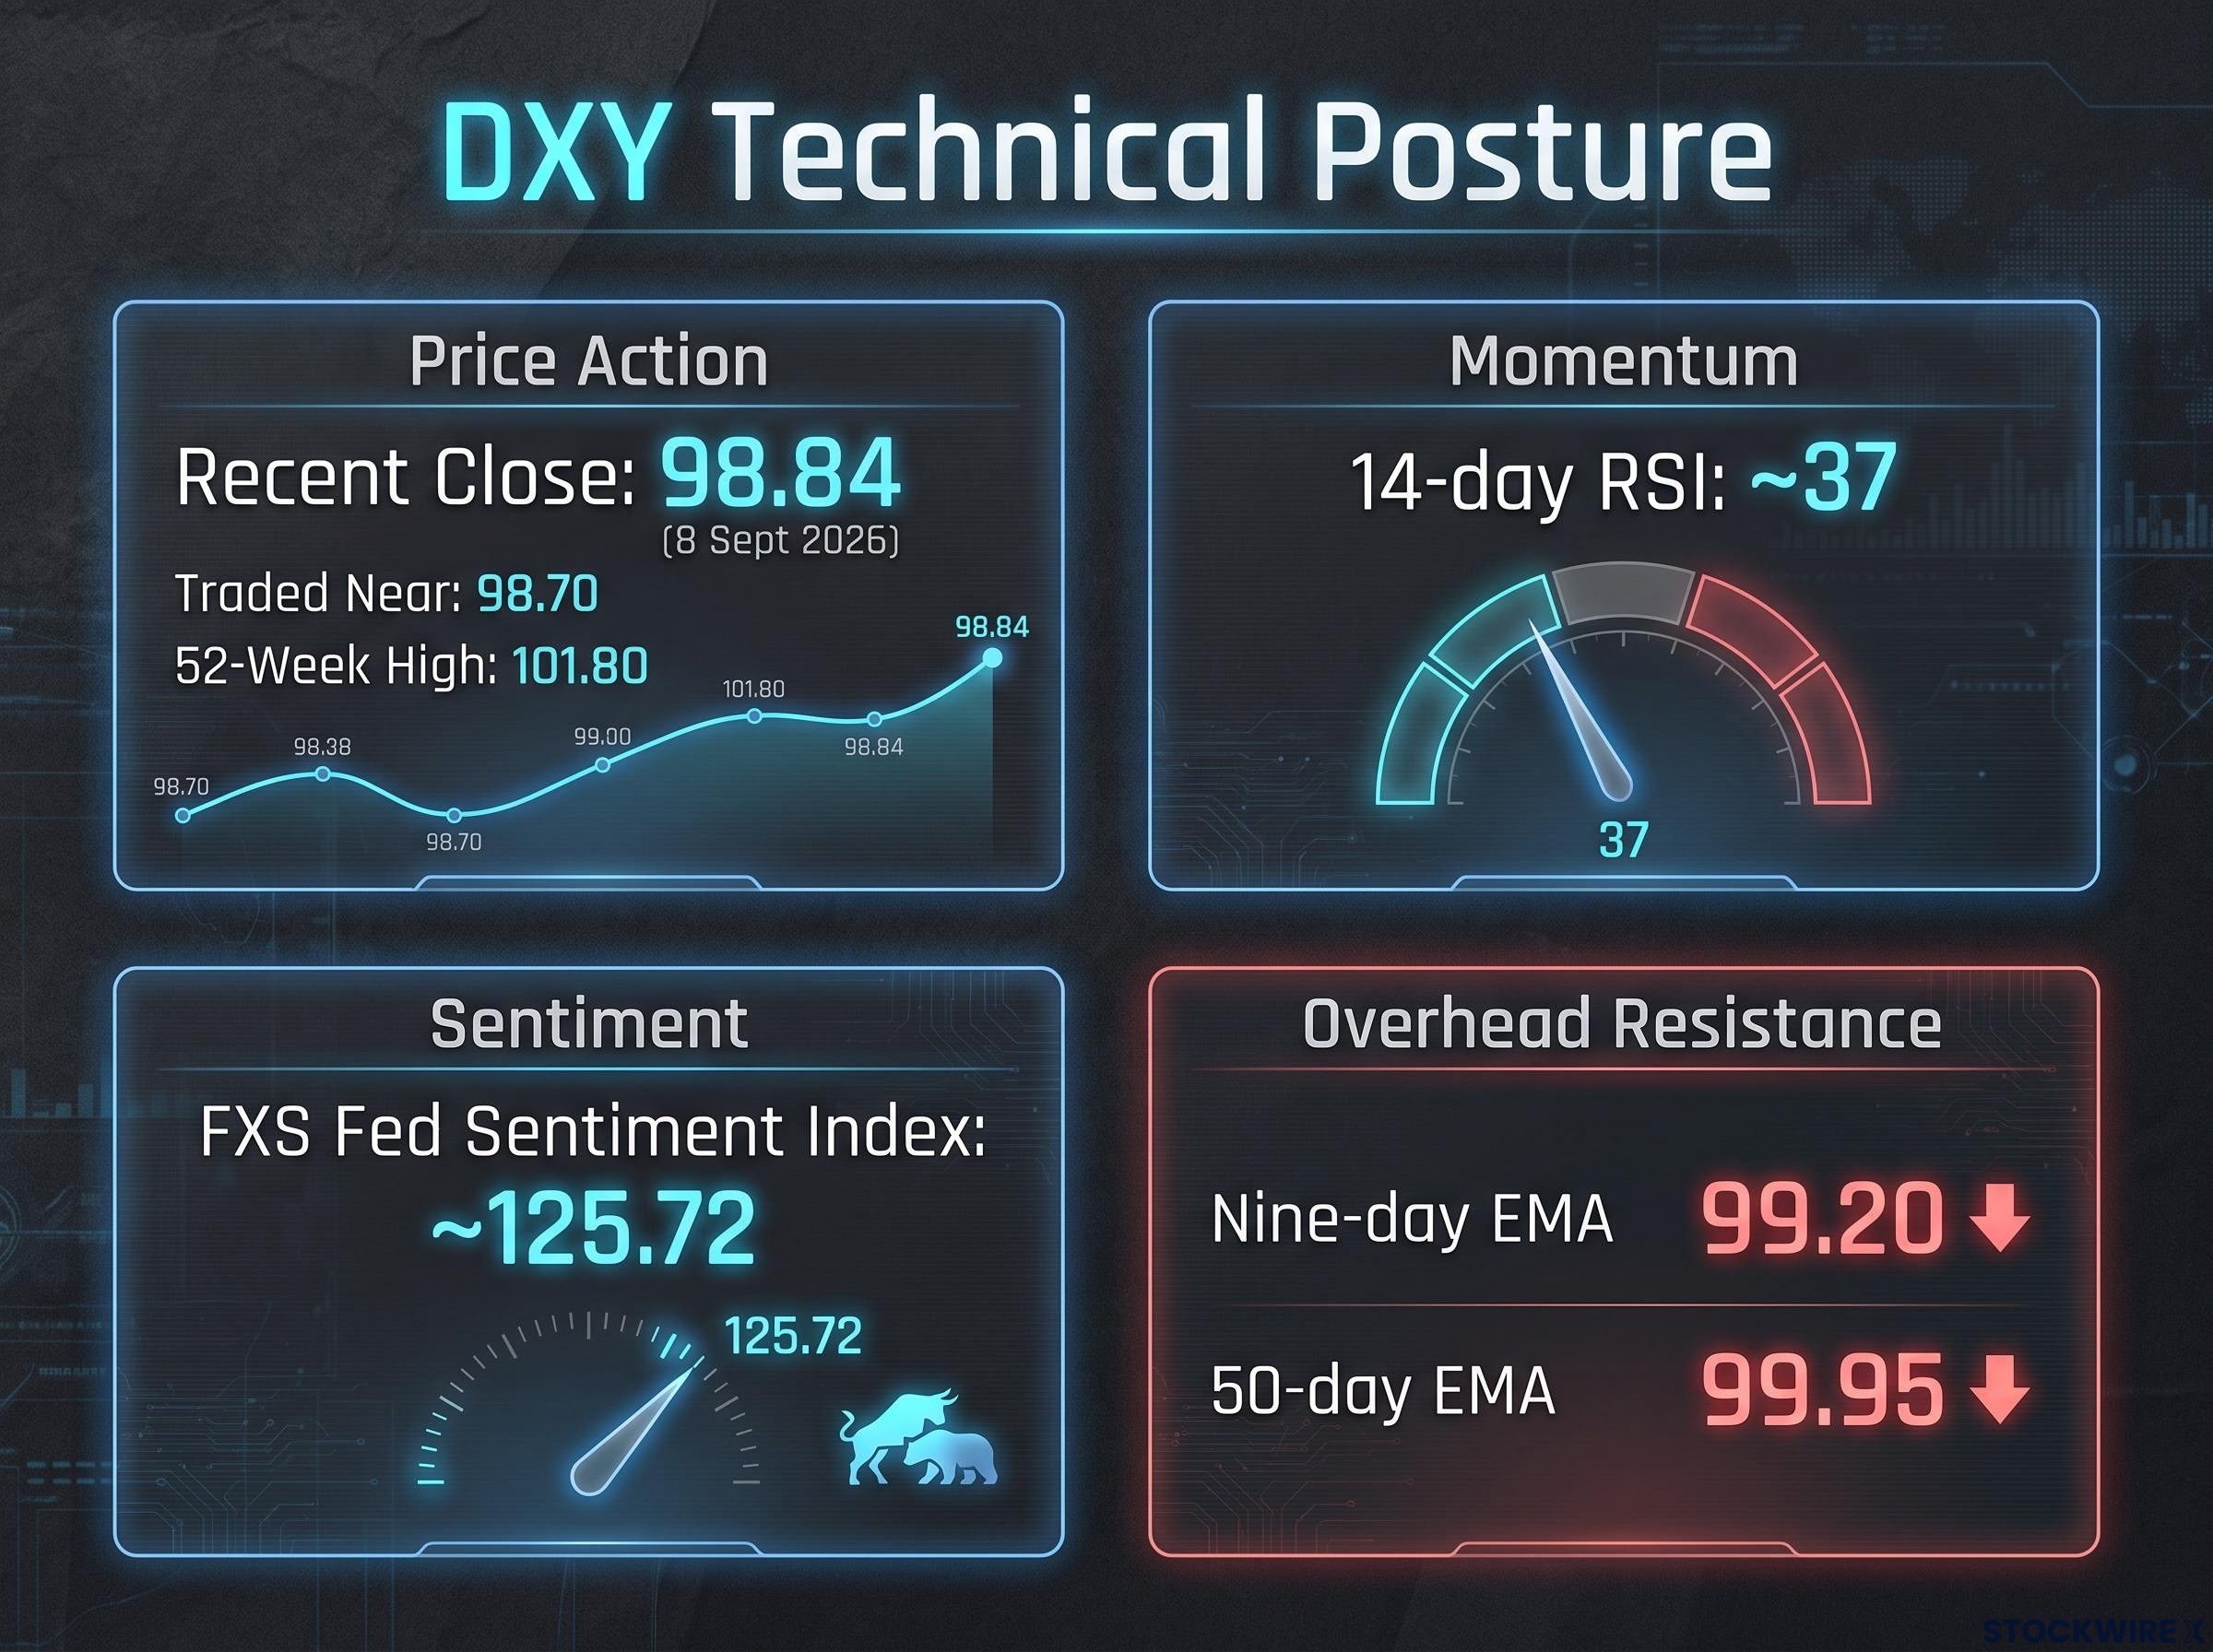
The RSI reading matters more than it first appears. A relative strength index is a momentum gauge running from 0 to 100; below 30 signals oversold conditions where a bounce becomes likely. At 37, the dollar has not yet reached that exhaustion point, which tells you selling momentum still has room to run before any technical case for a reversal shows up in the data.
Where resistance sits and why it matters
The nine-day EMA marks the first barrier above current price. The 50-day EMA sits above that as the more significant obstacle. Both are overhead, and that clustering is the point.
A single resistance level gives sellers one place to lean. Two moving averages stacked close together give them multiple stall points, so any bounce has to fight through more than one line before it can build. Without clearly defined support below 98.75, the near-term risk is asymmetric: thin floor beneath, thick ceiling above. Any rally would need real fundamental fuel to punch through and hold.
When big ASX news breaks, our subscribers know first
Why the dollar is under this kind of pressure
The chart shows the symptom. The cause sits deeper, and it comes from three directions at once.
This is not weakness born of a single bad print. Softer consumption, inflation, and employment data through mid-2026 have chipped away at the bullish argument, according to CNBC’s 19 August 2026 analysis, which also flagged an uncomfortable nuance: higher U.S. yields driven by fiscal and inflation worry do not support the currency the way yields driven by genuine growth do. When bond yields rise because investors fear the deficit rather than reward the expansion, the dollar loses a tailwind it would normally count on.
The dollar’s four-session losing streak is the latest leg of a stair-step breakdown pattern that began when the index settled below 98.80 on 19 August, with each prior support level rotating into resistance and the 200-day EMA near 99.70 becoming the line bulls must reclaim on a closing basis before the broader trend can be considered repaired.
Then there is the confidence problem. Julius Baer economist David Meier argues that policy inconsistency has “undermined investor confidence,” pushing the dollar lower even without a clear deterioration in the underlying economy. Natixis portfolio manager Jack Janasiewicz points to yen moves and intervention speculation as additional recent drivers, a reminder that DXY can be pressured from across the currency board.
The longest lens is the structural one.
Demand for the reserve currency should be lower in a multipolar, geopolitically fragmented world, which is “negative for the dollar in the long term,” according to J. Safra Sarasin currency strategist Claudio Wewel.
Three distinct pressure channels are therefore working together:
- Policy and Fed uncertainty, which has eroded confidence in the dollar as a reserve asset
- Softer mid-2026 macro data, which weakened the bull case even before fiscal risk entered the frame
- A structural shift in reserve demand toward a multipolar world
The scale of the move already banked underlines how far the narrative has travelled. The Bloomberg Dollar Spot Index tumbled roughly 8.5% in the first half of 2026, according to Bloomberg Professional commentary from early September, which argued the structural bear case remains intact on narrower rate differentials and diversification away from dollar assets. A Reuters FX poll on 2 September 2026 concluded the dollar is likely to “hold firm over coming months but trade weaker in a year.”
For a trader holding long dollar positions, that structural layer changes the calculus. Even a hot CPI print may produce a shorter and shallower rally than history would suggest, because the underlying selling interest never fully leaves the market.
The market-versus-economist divide and what it means for Friday’s CPI
Here is the divergence that Friday’s data has to resolve. It is not an academic disagreement between two forecasting camps; it is the fulcrum between two entirely different outcomes for the dollar.
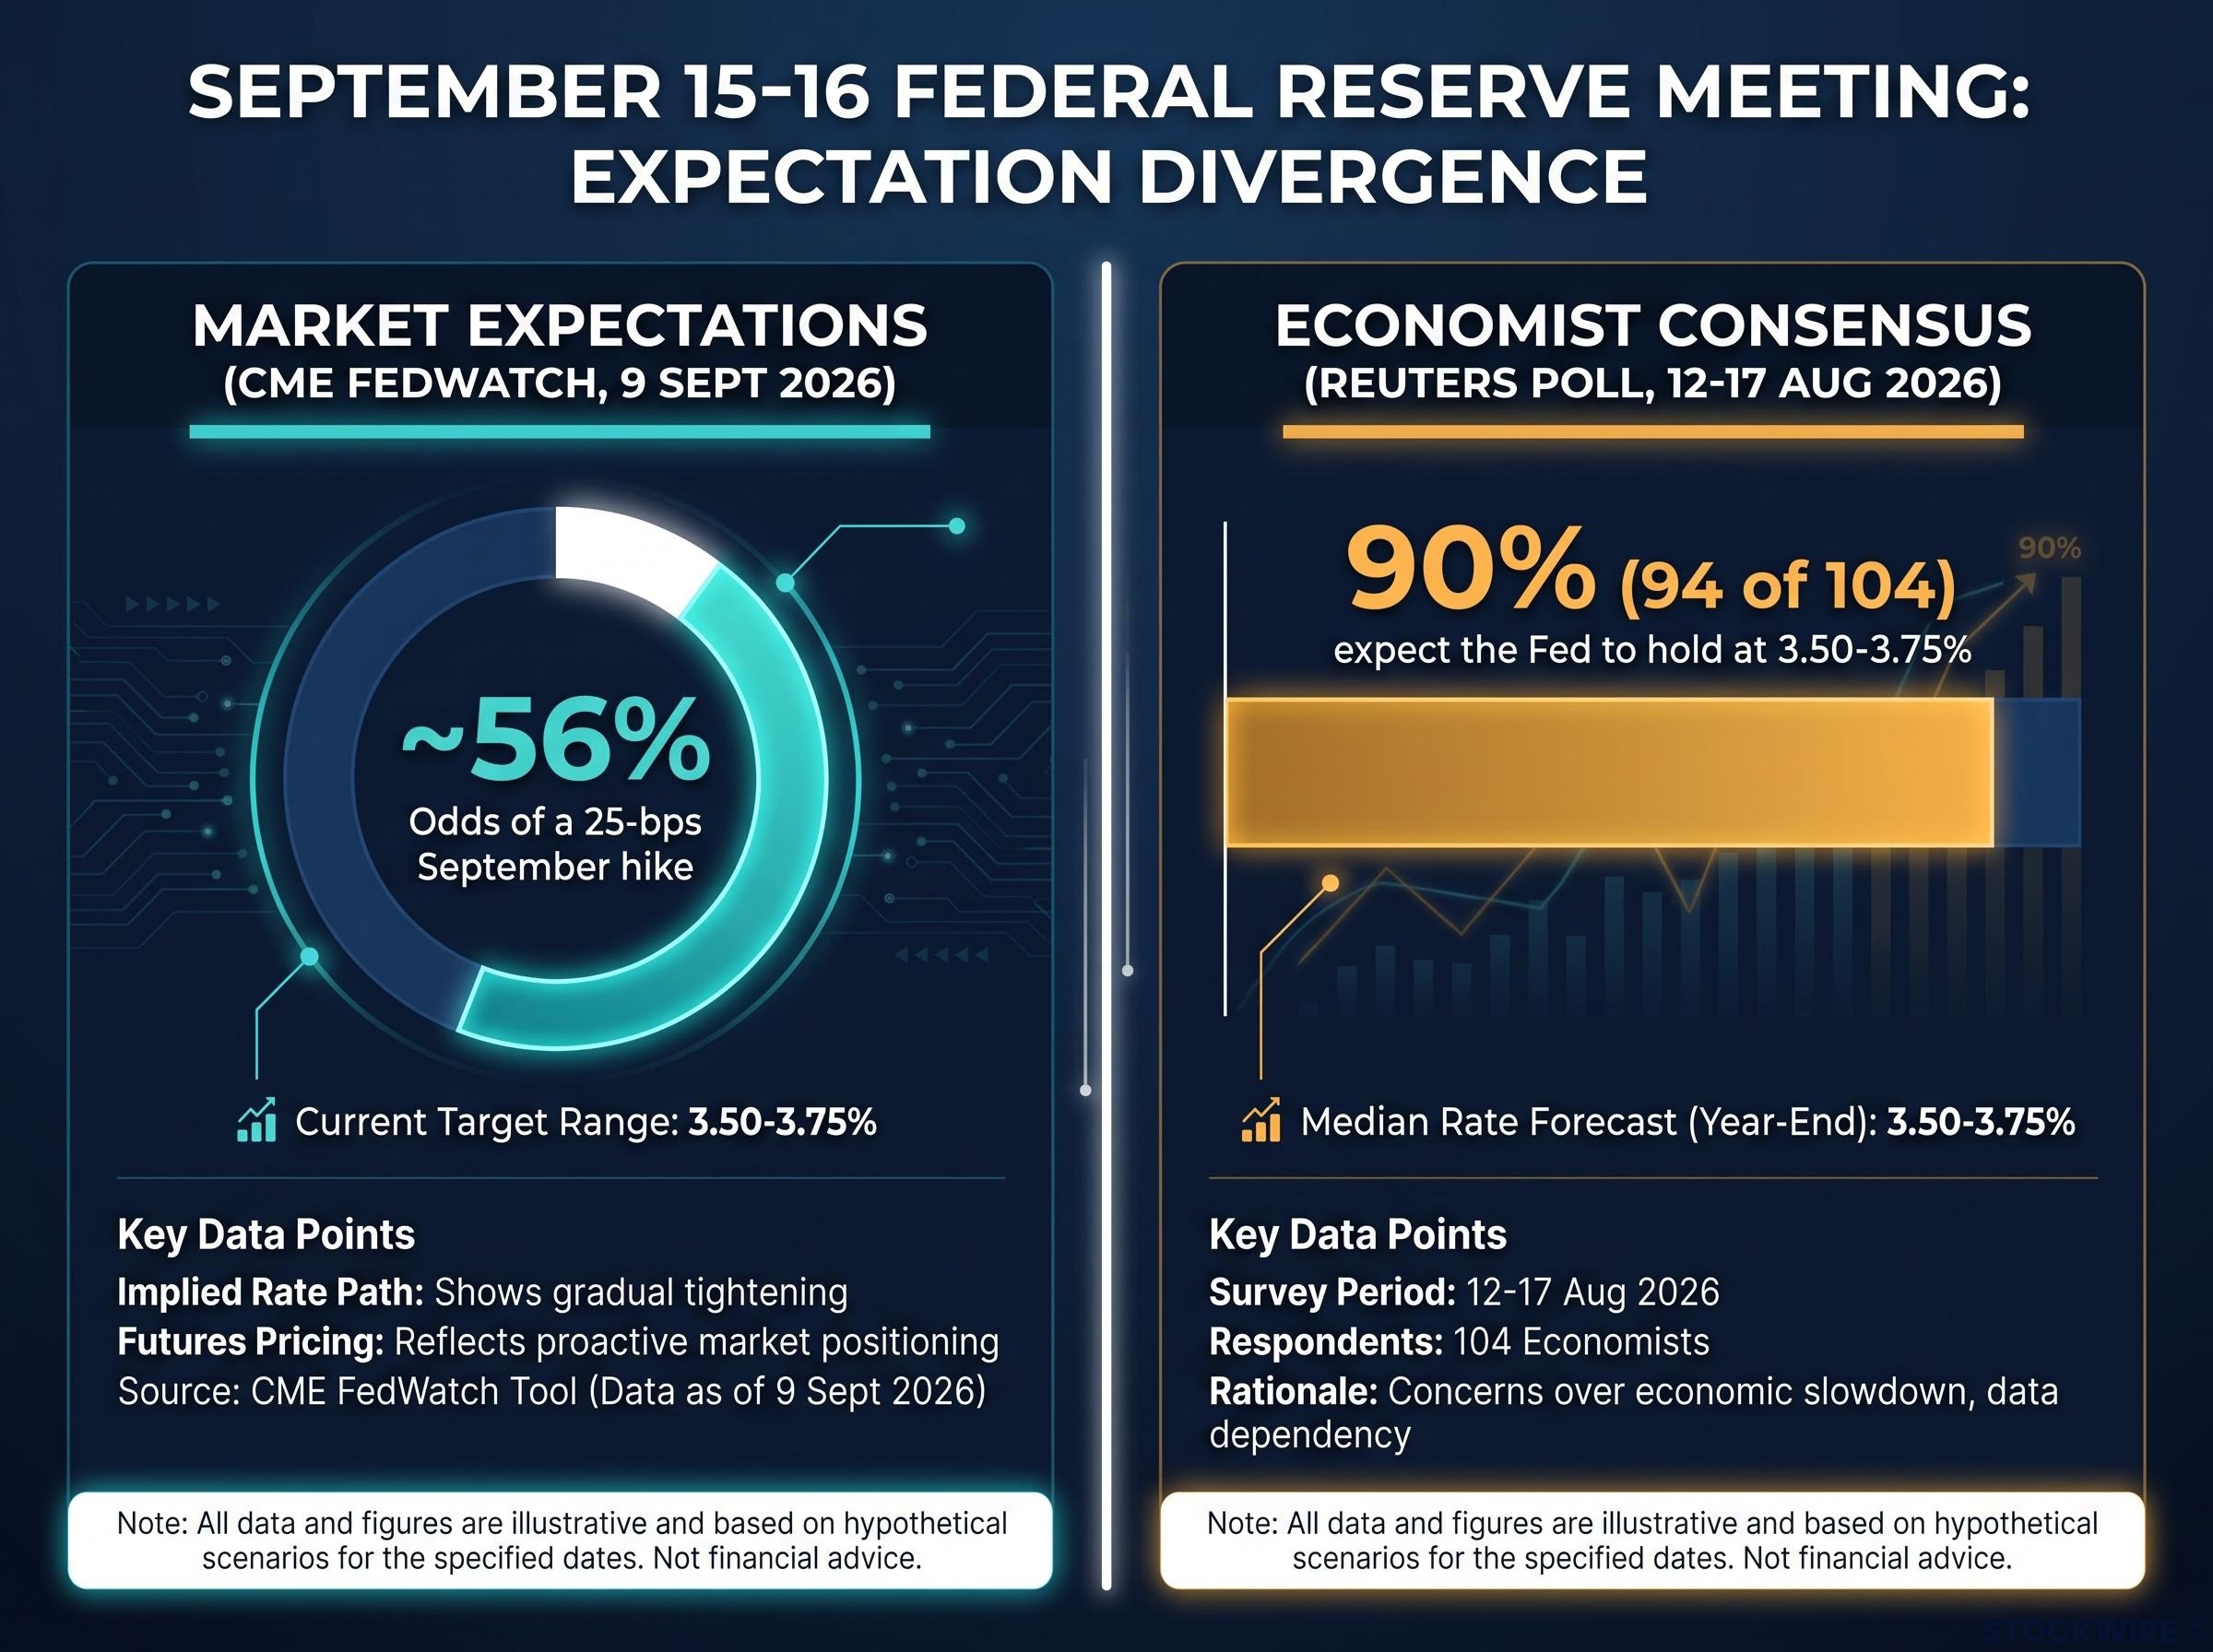
Markets are leaning hawkish. CME FedWatch data put the odds of a 25-basis-point September hike at nearly 56% as of 9 September 2026, with December pricing implying an 88% chance rates are higher by year-end. Economists are leaning the opposite way. A Reuters poll conducted 12-17 August 2026 found 90% of them, 94 of 104, expect the Fed to hold at 3.50-3.75% on 15-16 September, and roughly 80% expect no change through year-end.
| Indicator | Value | What It Implies | DXY Direction |
|---|---|---|---|
| CME FedWatch September hike odds | ~56% | Market leans toward a hike, but conviction is slipping | Supportive if it holds; fragile if it fades |
| Economist hold consensus | 90% (94 of 104) | Professional forecasters expect no change | Bearish bias if data confirms hold |
| July 2026 CPI (y/y) | 3.4% | Baseline the August print is measured against | Neutral until August prints |
| July 2026 PPI (m/m) | Unchanged | Flat producer prices, soft pipeline pressure | Neutral-to-bearish baseline |
The most telling number is the drift. Market hike pricing has slipped from 65.9-66% on 31 August to around 56% ten days later, which tells you the market is not fully committed to its own hawkish thesis. A soft CPI print could therefore trigger a far larger repricing in hike odds than the raw inflation number alone would suggest.
The market-economist divergence on September hike odds is partly a product of the current Fed communication regime: without the forward-guidance anchors that once bounded rate expectations, every incoming data print carries more weight than it did under prior chairs, and the gap between institutional consensus and market pricing can open quickly and close violently around a single release.
Even the professionals are split. Citi expects the Fed’s next move to be a cut. BofA Securities expects three 25-basis-point hikes this year. When forecasters of that calibre have not converged, the data matters more than any single institutional view.
Policy uncertainty raises the risk of being misaligned with the Fed around key events, according to the iShares fixed-income team, which itself holds a baseline of the Fed on pause through 2026.
For traders positioned in either direction, that makes Friday’s CPI a genuine binary event, not a data point to watch in the background. Sizing and risk management ahead of 8:30 a.m. ET on Friday is a live decision.
How inflation prints have moved DXY in 2026
The mechanism is not theoretical. June 2026 CPI came in at 3.5% year-on-year against expectations of 3.8%, and the implied probability of a September hike fell from above 70% to around 50%, according to an Equiti note. The dollar index slid toward 100.7 as traders pulled back rate-hike bets.
The logic runs symmetrically. A beat on August CPI would run the same chain in reverse, lifting hike odds back toward the 65-66% levels seen on 31 August and handing the dollar the fundamental fuel it needs to challenge overhead resistance.
The scenario map: where DXY goes from here
Two days before a print like this, a conditional framework beats a single forecast. Here are the three paths, tied to observable triggers.
| Scenario | Trigger | DXY Implication |
|---|---|---|
| Hot inflation | CPI/PPI beat expectations | Hike odds rebound toward 65-66%; DXY tests nine-day EMA resistance |
| Soft inflation | CPI/PPI below expectations | Hike odds compress from 56%; DXY extends below 98.70 toward round-number support |
| Geopolitical or positioning shock | Haven flows, energy spike, or short squeeze | Abrupt counter-trend rally regardless of the inflation number |
The medium-term context frames how long any near-term move is likely to last. Morgan Stanley sees a dollar recovery in the second half of 2026, resting on three drivers:
- Resilient U.S. growth
- An end to the Fed’s cutting cycle and a rebound in U.S. rates
- A shift in hedging behaviour as investors reduce protection against dollar depreciation
RBC Capital Markets is more measured, projecting only a mild 3-4% G10 depreciation as its base case and noting that forward markets price just 1-2% weakness through 2027. Neither view is a collapse call.
The third scenario deserves respect precisely because the tape looks so one-sided. That 8.5% first-half tumble has built heavy short-dollar positioning, and heavy shorts in a bearish environment are not the same as unlimited downside. The Bloomberg Dollar Spot Index rose about 2.7% in March 2026 on haven flows and an energy shock, and JPMorgan noted that a Middle East conflict “short-circuited” the bearish environment through a volatility spike.
The most recent sharp reversal in dollar momentum came from the Jackson Hole hawkish signal on 28 August, when Chair Warsh’s confirmation that roughly half of PCE basket items remained above 3% sent DXY from a three-month low near 98.8 toward 99.73 in a single session, demonstrating exactly how fast hike-probability repricing can move the index when a catalyst lands cleanly.
Here is the read to take from all of it. The asymmetric risk right now sits in the hot-inflation scenario: a strong print has to force its way through thick moving average resistance to sustain a rally, while a soft print faces far fewer technical obstacles to the downside. That balance means risk and reward favour caution on fresh long dollar positions before Friday.
This article is for informational purposes only and should not be considered financial advice. Investors should conduct their own research and consult with financial professionals before making investment decisions. Past performance does not guarantee future results. Financial projections are subject to market conditions and various risk factors, and forward-looking scenarios are speculative and subject to change based on data and Fed developments.
What Friday’s close will tell you that today’s chart cannot
The technical setup and the structural pressures are knowable right now. What is not yet knowable is whether the current bearish configuration attracts follow-through sellers or becomes the trap that squeezes an over-committed short position. Only the data decides that.
Two variables are worth tracking in real time. The first is the August CPI print against the July baseline of 3.4% year-on-year, and specifically whether core comes in above or below 0.2% month-on-month. The second is CME FedWatch probability in the hour after the release, which is the market’s live verdict on what the number means for the 15-16 September meeting.
The economist consensus gives any hot print extra ammunition. With 90% of professional forecasters positioned for no change, a print that forces a repricing would move rates expectations, and by extension DXY, faster and further than the headline figure alone would imply.
You now hold what the chart alone could not give you: the two triggers to watch, and the reason the reaction to them may be larger than the number itself.