Bond investors have watched the ICE BofA 7-10 Year US Corporate and Government index post a -2.6% price return year-to-date through May 2026, while the S&P 500 has climbed 9.3% over the same period. The instinct is to ask whether bonds are still worth holding.
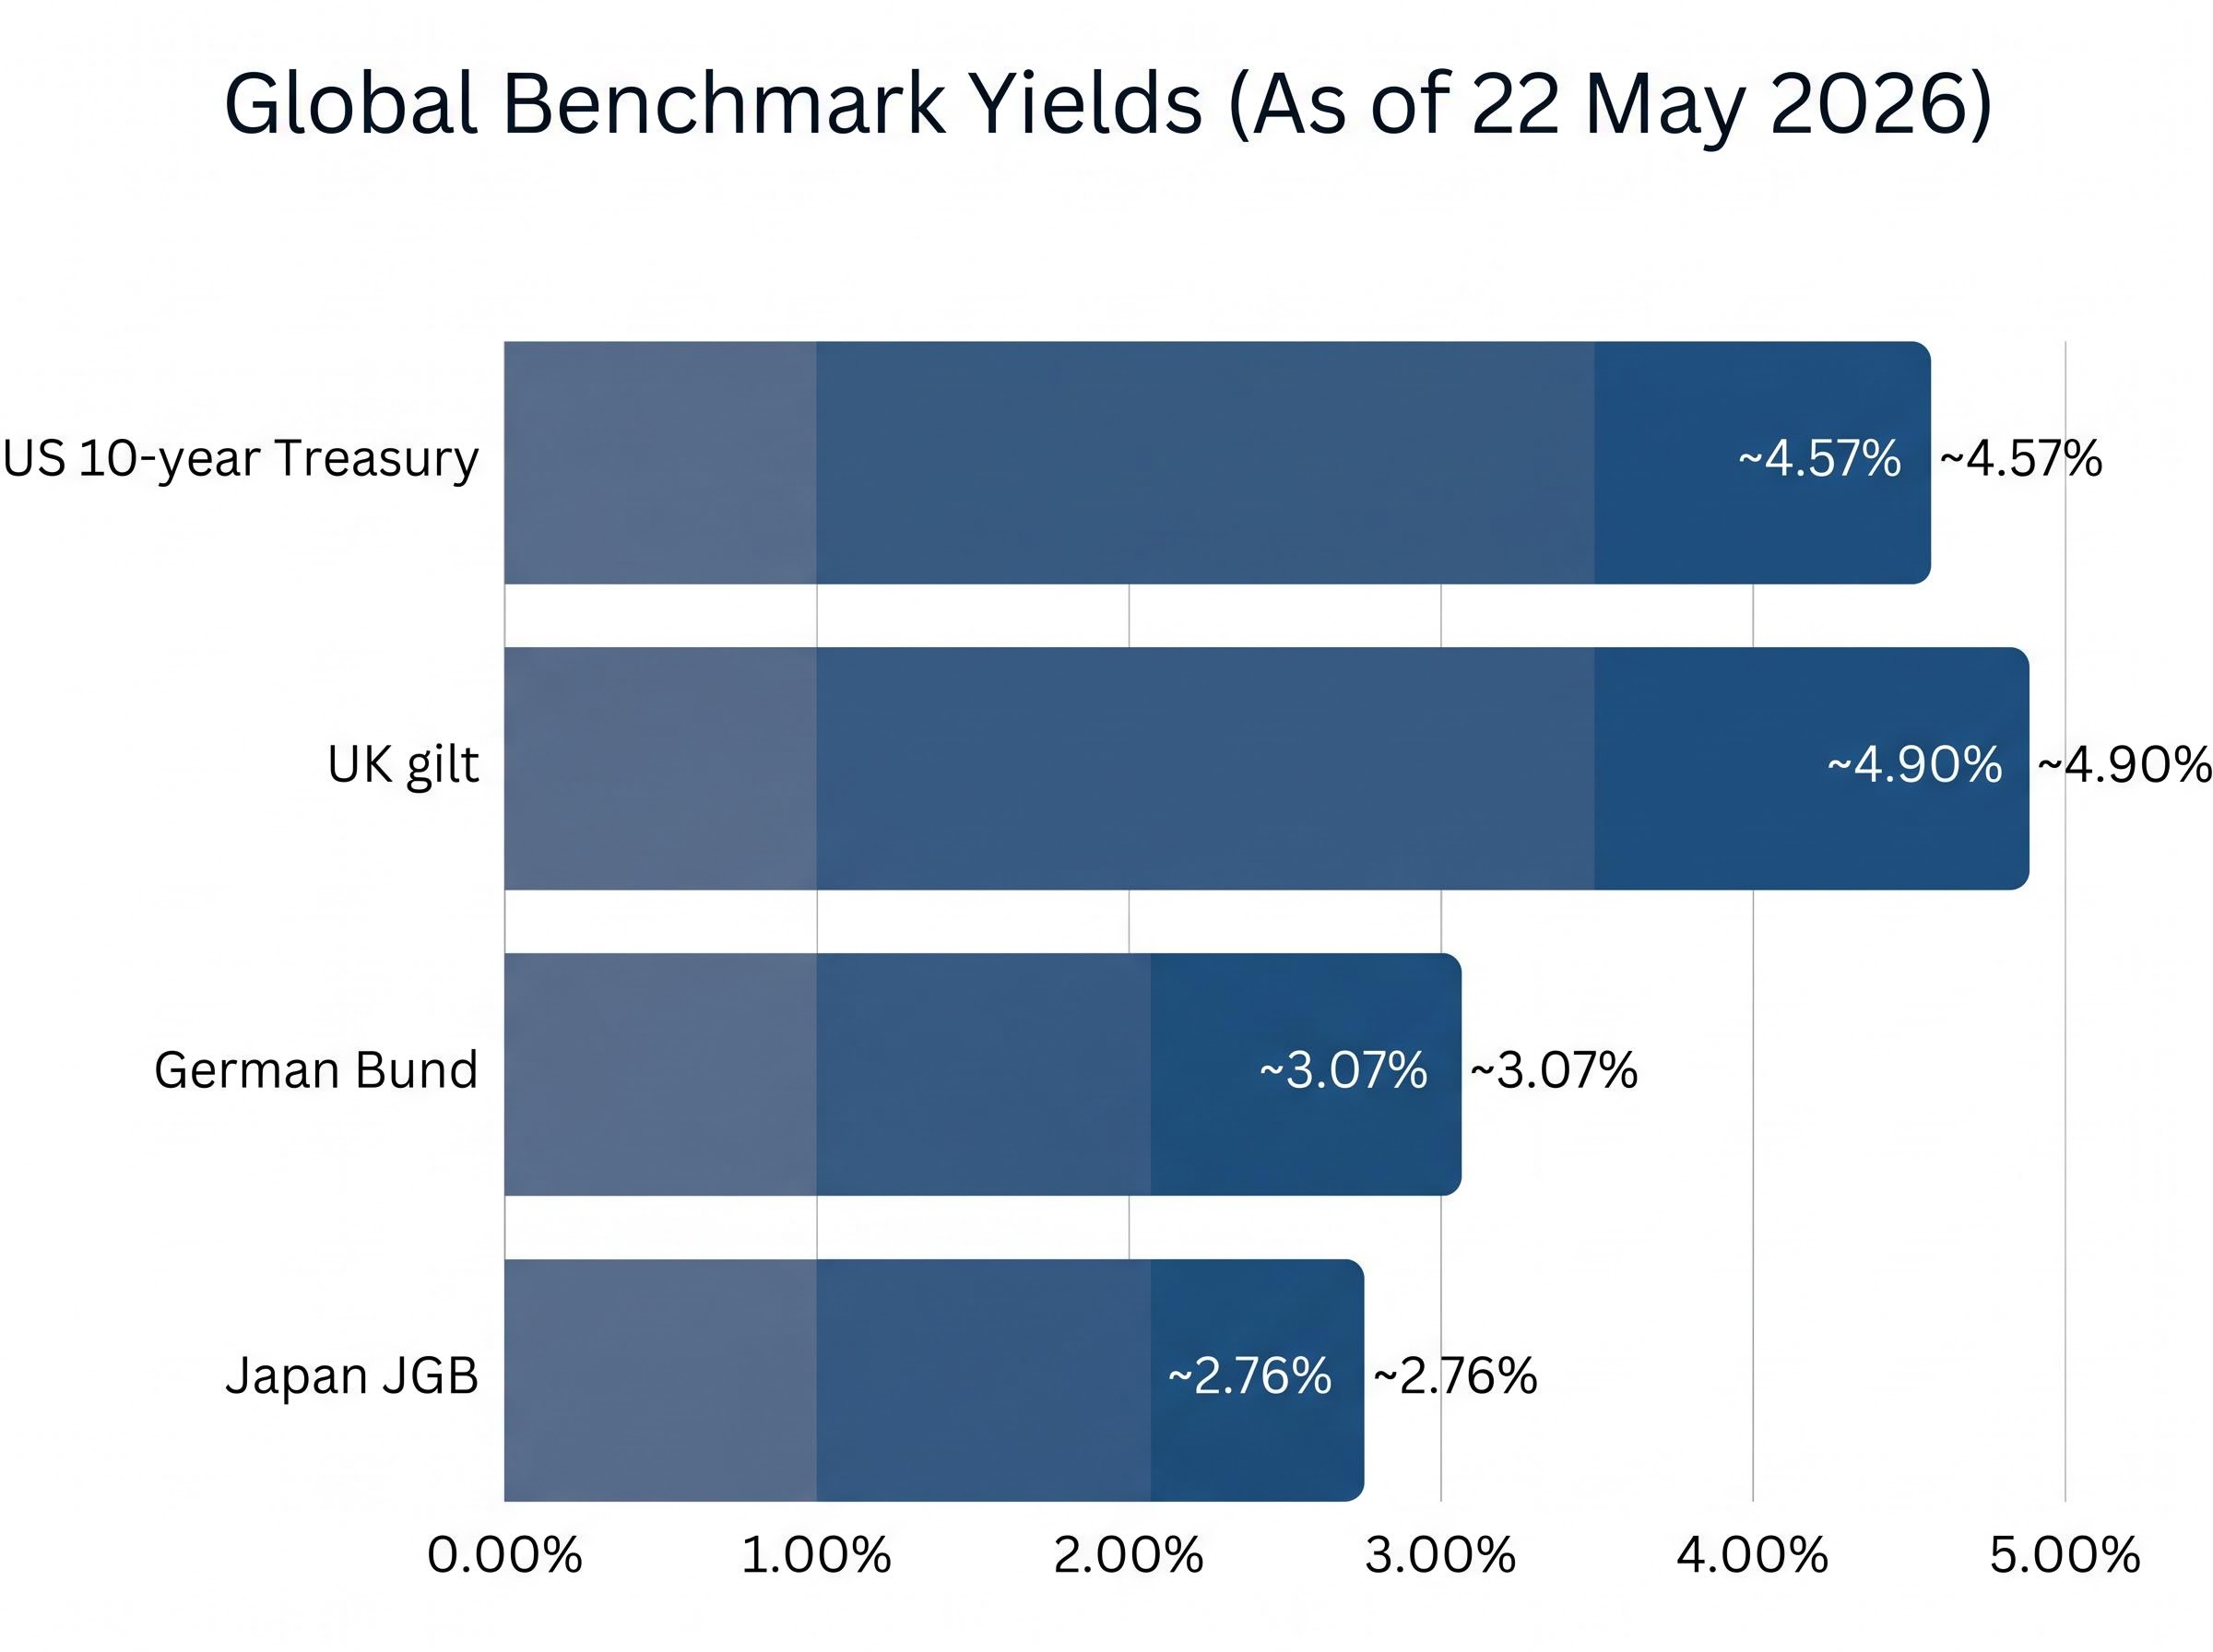
That performance gap is generating genuine anxiety, and it has rekindled a debate about what bonds are actually for. This is not a temporary dislocation. The elevated-yield environment, with the US 10-year Treasury at approximately 4.57%, the UK gilt at approximately 4.90%, the German Bund near 3.07%, and the Japan JGB at approximately 2.76% as of 22 May 2026, has persisted and extended rather than reverting as many expected. Investors who built their bond investing strategy around a return to low rates are still waiting.
This guide answers the three questions most bondholders are actually asking: should I sell, should I shorten duration, and if I do nothing, what am I betting on? By the end, the framework ties each answer to the reader’s own investment horizon rather than headlines.
Why bonds are still doing their job even when they look like they are not
Year-to-date through 21 May 2026: S&P 500 price return: +9.3%. ICE BofA 7-10 Year US Corporate and Government index price return: -2.6%. (Source: FactSet)
A -2.6% bond return in a year when equities are up 9.3% is not a failure of bonds. It is a description of an environment where risk assets are bid. Bonds and equities serve different functions in a portfolio, and confusing the two leads to selling decisions that remove the very protection a portfolio needs.
The March 2026 equity correction provided a live demonstration. During that selloff, the bond drawdown was shallower in magnitude than the equity decline, confirming that the stabilisation function was operating exactly as designed. Volatility is two-directional: bonds do not need to post positive returns to demonstrate stability. They need to fall less when equities fall hardest.
A distinction that often gets lost in headline comparisons is the difference between price return and total return. At elevated yields, the income component has increased substantially and now offsets more of any price decline than it did during the 2010s, when yields were suppressed near zero.
The confusion between price return and total return is easier to resolve once you are clear on how bonds generate returns through contractual coupon payments and par repayment at maturity, mechanisms that are structurally different from the way equities create value through earnings growth and capital appreciation.
What bonds are designed to do:
- Limit the magnitude of portfolio drawdowns during equity selloffs
- Provide a predictable income stream that compounds over the holding period
- Reduce overall portfolio volatility across a full market cycle
What investors often expect them to do:
- Match or approach equity returns in rising markets
- Post positive price returns every calendar year
- Act as a second growth engine alongside equities
Investors who misread a negative price return as evidence that bonds have stopped working risk selling the exact diversification that would protect them in the next equity shock.
When big ASX news breaks, our subscribers know first
What “duration” actually means and why it is the number that matters most right now
Most investors noticed that longer-term bonds fell more sharply than short-term bonds during 2022-2023. That observation has a name: duration sensitivity. Duration measures how much a bond’s price moves in response to a one-percentage-point change in interest rates.
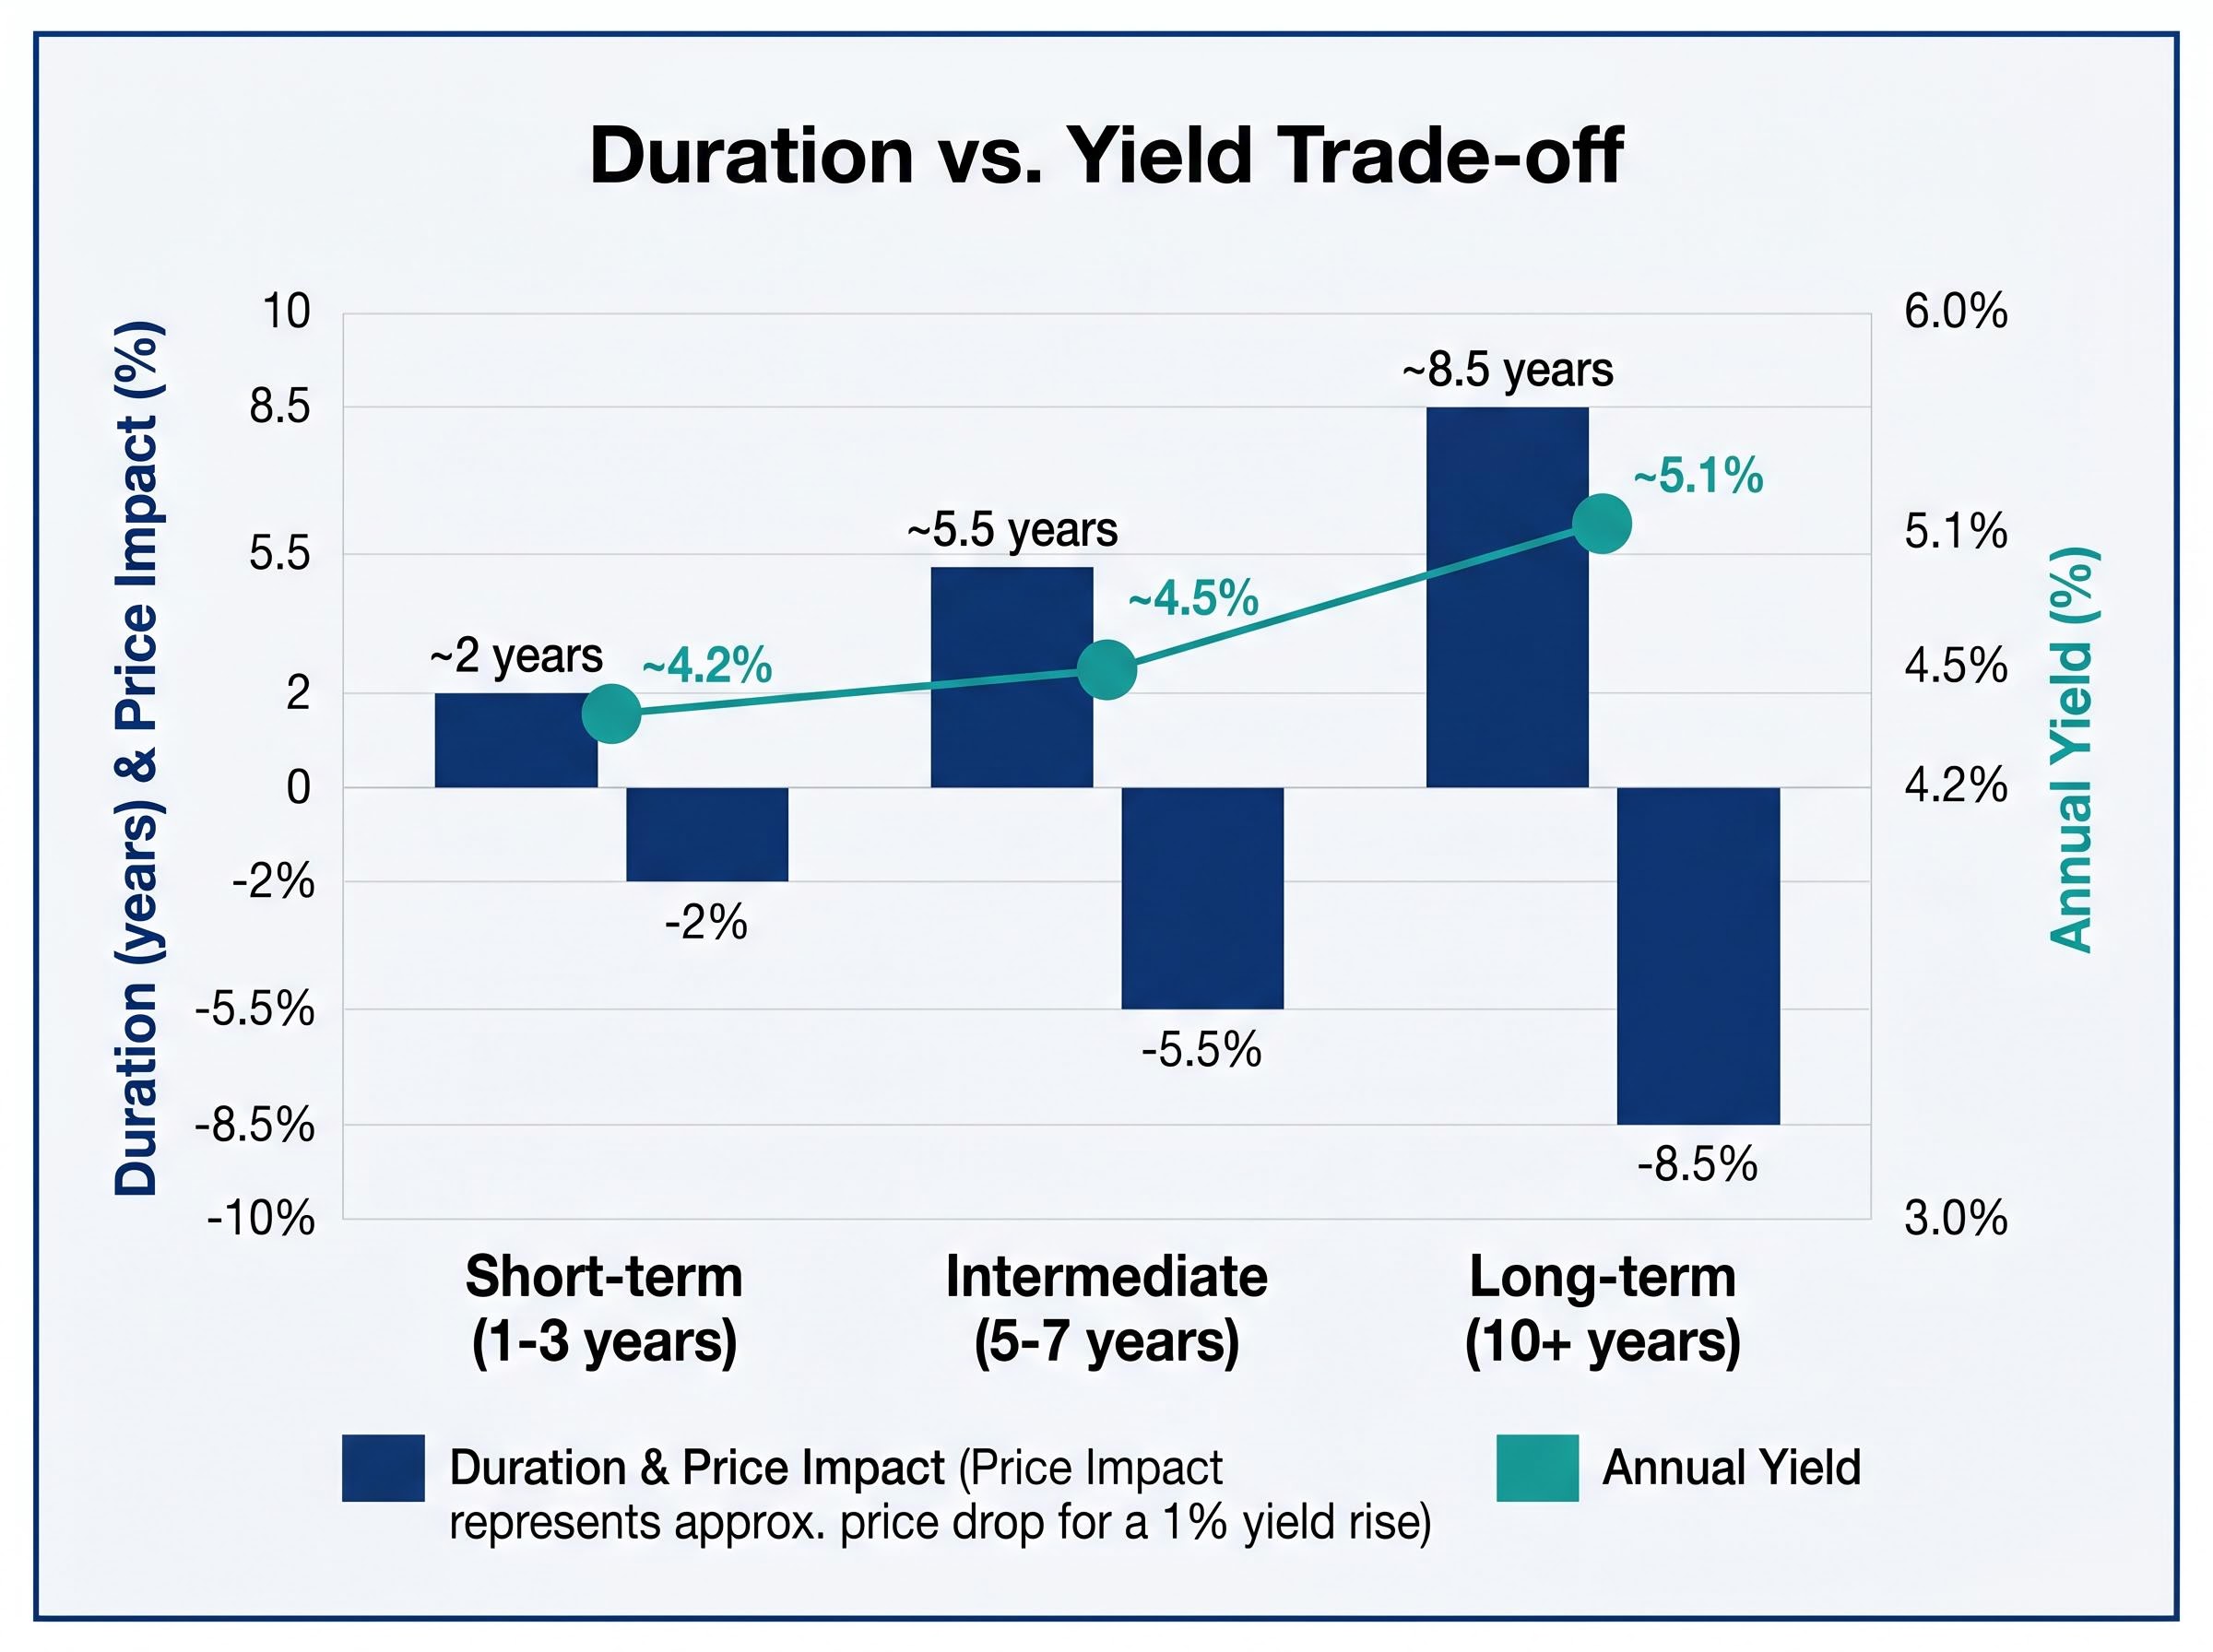
The rule of thumb is straightforward. A bond with a duration of 7 years loses approximately 7% in price for every 1% rise in yield. A bond with a duration of 2 years loses approximately 2%. The relationship works in reverse as well: when yields fall, longer-duration bonds gain more.
At current yield levels, this matters in two ways. The sensitivity to further rate rises remains real. But the income cushion is now far more meaningful than it was when yields were near zero, because higher annual coupon payments offset more of any interim price decline.
| Bond position | Illustrative duration | Approximate price impact of a 1% yield rise | Approximate annual yield at current levels |
|---|---|---|---|
| Short-term (1-3 years) | ~2 years | -2% | ~4.2% |
| Intermediate (5-7 years) | ~5.5 years | -5.5% | ~4.5% |
| Long-term (10+ years) | ~8.5 years | -8.5% | ~5.1% |
Duration versus maturity: the distinction that trips up most investors
Duration and maturity are not the same thing. A 10-year bond that pays annual coupons has a shorter duration than a 10-year zero-coupon bond, because the coupon payments return capital earlier, reducing the bond’s overall price sensitivity to rate changes. Two bonds with identical maturity dates can behave very differently when yields move, and it is duration, not maturity alone, that determines how much a portfolio’s value fluctuates.
The case against selling after yields have already risen
Selling a bond after its yield has risen means crystallising a capital loss and walking away from the higher income stream that compensates for that loss over time. The mechanical logic is simple: the income is now higher precisely because the price fell. Selling forfeits both the recovery and the improved forward return.
Historical analogues reinforce this pattern. According to commentary from Charles Schwab, the 1994 and 2013 “taper tantrum” rate-shock episodes followed a similar sequence. Investors who sold intermediate and long-term Treasuries after those sharp yield rises often re-entered later at lower yields, earning less over the full cycle than those who held through the volatility.
Research from Morningstar found that investor dollar-weighted returns in US intermediate-term bond funds lagged fund time-weighted returns meaningfully, especially around rate-hike cycles. Reactive selling after drawdowns was a consistent driver of this performance gap.
Analysis from Vanguard observed that investors who moved out of core bonds in 2022-2023 and shifted to cash typically realised losses and reduced their probability of long-term success. With the US 10-year now yielding approximately 4.57% and the US 30-year near 5.1%, forward income over the next five years is substantially higher than it was when rates were suppressed, a factor that changes the calculus of holding versus selling.
Three reasons the sell decision is hardest to execute well specifically after a yield spike:
- Capital loss already crystallised. The price decline has already occurred; selling makes it permanent rather than temporary.
- Income stream foregone. Higher yields mean higher coupon payments going forward, and selling forfeits that income.
- Re-entry timing risk. Investors who sell tend to wait for “clarity” before buying back, often re-entering at lower yields and worse forward returns.
Past performance does not guarantee future results. Historical analogues are illustrative and may not repeat in future rate cycles.
Three ways to manage duration without abandoning bonds entirely
The case for holding does not mean every portfolio’s duration is correctly positioned. Three approaches offer different ways to manage that exposure, each suited to different circumstances.
Shortening duration (moving from long to short-to-intermediate maturities) is appropriate for investors with a horizon under three years or genuine near-term spending needs. It reduces sensitivity to further rate rises. According to Charles Schwab guidance, however, concentrating solely at the very front end introduces reinvestment risk: if yields fall, maturing proceeds get reinvested at lower rates, locking in less income.
Laddering maturities (spreading positions across 1-10 years) is the most broadly recommended approach for retail investors seeking to capture elevated yields without timing rate moves. Guidance from Fidelity and J.P. Morgan suggests ladders of investment-grade bonds or defined-maturity exchange-traded funds (ETFs), with maturing rungs reinvested at whatever rate prevails.
Fidelity bond ladder guidance explains how spreading fixed income allocations across staggered maturities reduces the need to time rate moves, because each rung that matures and reinvests captures the prevailing yield without requiring a directional view on rates.
Gradual extension (shifting from ultra-short toward core intermediate exposure) suits investors who moved very short during 2022-2023 and are re-entering the bond market. BlackRock guidance favours a measured transition rather than a binary shift into long duration, noting that policy uncertainty and term-premium risk argue against aggressive extension.
| Approach | Best suited for | Key risk | Current yield environment fit |
|---|---|---|---|
| Shorten duration | Horizon under 3 years; near-term spending needs | Reinvestment risk if yields fall | Captures current short-term rates; misses longer-term income lock-in |
| Bond ladder (1-10 years) | Income-focused investors; those avoiding rate-timing | Mark-to-market volatility on longer rungs | Strong: locks in elevated yields across the curve with reinvestment flexibility |
| Gradual extension | Investors who moved to cash/ultra-short in 2022-2023 | Further rate rises erode intermediate-duration positions | Favourable: re-entering at yields well above 2010s averages |
How a bond ladder works in practice
Consider an investor with $50,000 to allocate across bonds. Rather than placing the full amount in a single maturity, the ladder approach splits the allocation into five $10,000 positions maturing in years one through five. When the first rung matures after 12 months, the $10,000 in proceeds is reinvested into a new five-year bond at whatever rate prevails. Each year, one rung matures, creating a continuous cycle that captures new rates without requiring a view on where yields are heading.
A case study from Fidelity illustrates the contrast. In a hypothetical comparison, an investor who placed all fixed income into a single 10-year bond in 2021 and sold after yields rose in 2023 locked in a permanent capital loss. A second investor who held a laddered structure experienced mark-to-market declines but achieved higher income over subsequent years as bonds matured and proceeds were reinvested at elevated rates.
How to match your bond strategy to your actual investment horizon
Duration risk is only a problem if an investor is forced or chooses to sell before maturity. An investor holding a bond to maturity receives par value regardless of intervening price fluctuations. That single principle reframes the entire short-term volatility discussion.
The hold-to-maturity anchor: A bondholder who does not sell before maturity receives the face value of the bond at maturity, plus all coupon payments along the way. Interim price declines are temporary; the income and return of principal are contractual.
Three investor profiles illustrate how duration decisions should follow from timelines rather than market sentiment:
- Horizon under three years. Capital preservation is the priority. Shorter-duration bonds or funds reduce sensitivity to rate moves and protect the spending amount. The trade-off is lower yield and reinvestment risk.
- Horizon of three to seven years. Intermediate duration with a laddering approach is defensible. Current yields in this range are meaningfully above the 2015-2021 average, offering attractive income without excessive rate sensitivity.
- Horizon of seven-plus years. Core bond allocations with standard intermediate-to-long duration serve the portfolio’s equity-hedging purpose over a full market cycle. At today’s yields, investors with longer timelines are locking in forward income that was unavailable at any point in the past decade.
The current global yield environment supports each of these profiles. The US 10-year at 4.57%, the UK gilt near 4.91%, the German Bund at approximately 3.07%, and the Japan JGB near 2.76% are all substantially above their averages from 2015-2021. As Fisher Investments has observed, current levels are comparable to the early-to-mid 2000s and represent a normalisation of yields rather than a crisis condition. Guidance from Vanguard reinforces that duration should match investment time horizon rather than function as a market-timing tool.
For investors approaching or in retirement who want a structured framework for translating these duration principles into a concrete withdrawal plan, our dedicated guide to the retirement bucket strategy explains exactly how to size and manage three separate buckets by horizon, covering the specific bond types appropriate for Bucket 2 and how to sequence replenishment without forcing equity liquidation at depressed prices.
Elevated yields and the forward case for staying invested in bonds
Starting yield is the single best predictor of future bond returns over a 5-10 year horizon. Higher starting yields mean higher forward income, and that is precisely what investors now hold. The US 30-year yield near 5.1% and the US 10-year at approximately 4.57% offer forward income profiles that were simply unavailable during the prior decade.
Vanguard research on starting yields confirms that the initial yield on a bond is the single strongest predictor of its return over a 5-10 year horizon, a finding that gives investors with longer timelines a quantifiable basis for holding rather than selling at current levels.
Informed capital has been acting accordingly. According to flow data, global bond funds attracted approximately $48 billion in net inflows in the first three weeks of 2025 alone. Fixed income ETFs globally saw approximately $340 billion of net inflows across 2024, described as a record year for fixed income ETF adoption. The direction of institutional and advisor-led money has been toward bonds, not away from them.
The 2010s low-yield environment was the product of deliberate central bank suppression through quantitative easing, beginning with the US Federal Reserve in November 2008 and extending globally. The Bank of Japan only began tapering in March 2024. Current yields represent a restoration of market-based pricing, the environment in which bonds have historically performed their income and diversification role most reliably.
The current rate environment did not arrive in isolation: the synchronised global yield rise across the US, UK, and Japan in 2026 reflects four reinforcing drivers, including above-consensus inflation data, elevated energy prices, rising US term premia, and geopolitical supply constraints, that together explain why the expected reversion to low rates has not materialised.
As Fisher Investments has framed it, the discomfort many investors feel at current yield levels reflects recency bias from a decade of artificially suppressed rates, not an assessment of where yields sit in any longer historical context.
Conditions that have historically preceded strong 5-year bond returns include:
- Elevated starting yields across the government and investment-grade curve
- Normalised money supply growth following periods of central bank intervention
- Healthy auction demand for new government debt issuance
Each of these conditions is present in the current environment.
These statements are based on historical patterns and should not be interpreted as projections. Future bond returns are subject to market conditions and various risk factors.
The bottom line: what to actually do with your bond allocation right now
The decision framework is horizon-sorted. If the money is needed within three years, shorten duration. If the horizon is three-plus years and bonds are serving a diversification purpose, hold and consider laddering rather than selling.
The most common error remains reactive selling after prices have already fallen. That decision locks in losses and forfeits exactly the higher income that restores portfolio value over time.
Bond strategy is not a single decision made once. It is a periodic alignment check between the portfolio’s duration profile and the investor’s actual spending needs and risk tolerance. The current elevated-yield environment gives investors more tools to make that alignment than at any point in the past decade. Starting yields at these levels mean the income side of the bond equation is working harder than it has since the early 2000s.
For investors who have settled on the right duration profile and are now deciding between index-tracking funds and actively managed mandates, our full explainer on active versus passive bond fund selection covers the structural reasons why bond markets are less efficiently priced than equity markets, including over-the-counter trading mechanics and debt-weighted index construction, and what that means for fund choice at different points in the rate cycle.
The question was never whether bonds are “worth holding.” The question is whether the portfolio’s duration matches the investor’s timeline. For most long-term investors, the answer to that question has rarely been more straightforward.
This article is for informational purposes only and should not be considered financial advice. Investors should conduct their own research and consult with financial professionals before making investment decisions.