What Social Media Stock Promotions Actually Do to Prices
2 hrs ago

BetaShares markets its ATEC ETF as “the only pure-play Australian tech focused fund” on the ASX. The claim is commercially accurate at the product level. At the index level, it deserves a closer look. Only 56% of the constituents in the S&P/ASX All Technology Index, the benchmark ATEC tracks, are formally classified as technology companies under the Global Industry Classification Standard (GICS). The remaining 44% sit in industrials, communications, and healthcare. With over $567 million in funds under management as at May 2026, this is not an academic distinction. Australian investors directing capital toward ATEC on the assumption it delivers pure ASX tech sector exposure are buying something broader, and in some respects more complex, than the label suggests. What follows is an explanation of what the BetaShares ATEC ETF actually holds, how its cross-sector composition shapes its performance, and what that structure means for investors evaluating it as a portfolio building block.
ATEC is an ASX-listed exchange-traded fund managed by BetaShares that aims to track the S&P/ASX All Technology Index (AUD) before fees and expenses. The fund launched during the early weeks of the pandemic sell-off and has since grown into one of the larger thematic ETFs on the Australian exchange.
BetaShares describes ATEC as “the only pure-play Australian tech focused fund,” offering exposure to information technology, consumer electronics, online retail, and medical technology businesses listed on the ASX. That description is fair as a statement of product positioning. No other ASX-listed ETF provides a comparable breadth of Australian technology-oriented exposure.
The question is what sits underneath that positioning, and the answer lives in the index.
The S&P/ASX All Technology Index is not the same as the S&P/ASX 200 Information Technology Index (XIJ). The difference is structural. XIJ captures companies classified within the GICS Information Technology sector. The All Technology Index captures companies from multiple GICS sectors, provided their core operations are technology-driven in a broad, operational sense. That broader eligibility filter is the reason ATEC holds companies that would never appear in a strict IT sector index, and it is the single most consequential feature of the fund’s design.
The headline statistic bears repeating before the detail arrives.
Only 56% of the S&P/ASX All Technology Index’s 45 constituents are formally classified within the technology sector under GICS. The remainder sit across industrials, communications, and healthcare.
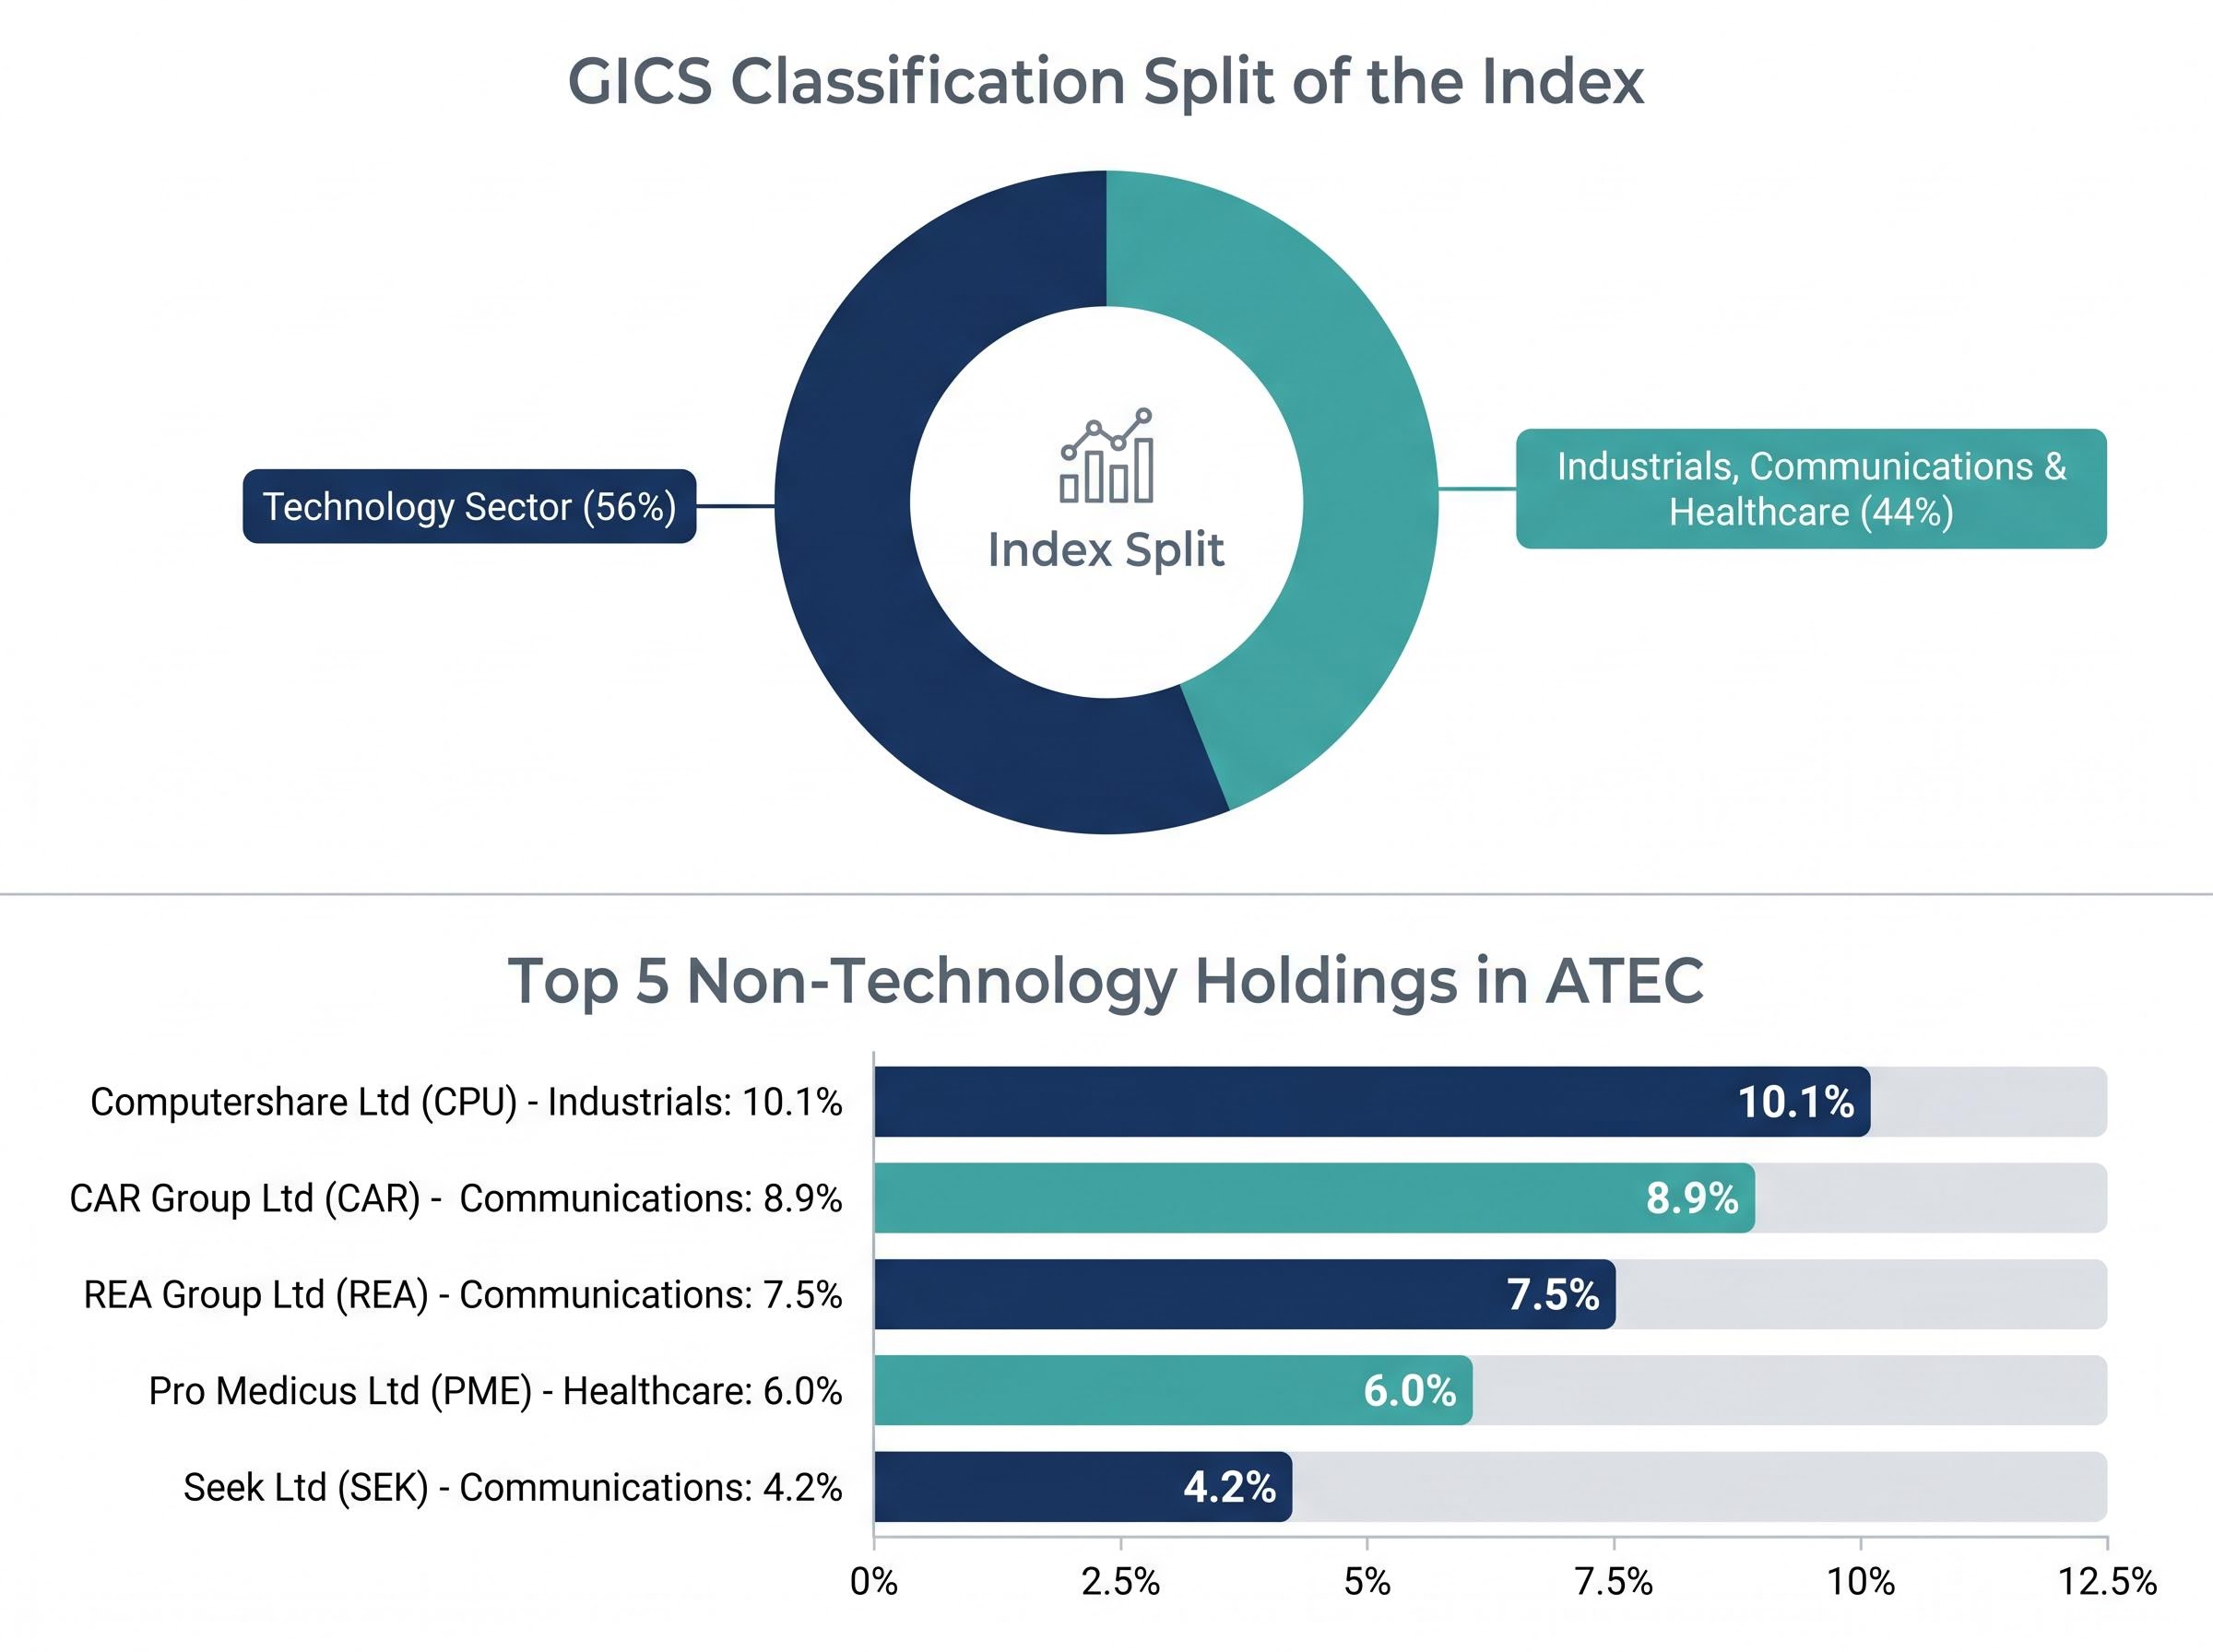
What makes this composition particularly striking is where those non-technology names sit in the fund’s weighting. ATEC’s single largest holding is not a software company. It is not a cloud platform or a semiconductor supplier. It is Computershare Ltd (ASX: CPU), a share registry and financial administration business classified under GICS as an industrials company, sitting at 10.1% of the fund’s total assets.
Computershare is not an outlier. Three of the fund’s top 10 holdings are classified as communications companies. A fourth is a healthcare name.
| Company (ASX code) | GICS sector | ATEC weight |
|---|---|---|
| Computershare Ltd (CPU) | Industrials | 10.1% |
| CAR Group Ltd (CAR) | Communications | 8.9% |
| REA Group Ltd (REA) | Communications | 7.5% |
| Pro Medicus Ltd (PME) | Healthcare | 6.0% |
| Seek Ltd (SEK) | Communications | 4.2% |
These five names collectively account for over 36% of ATEC’s assets. Each qualifies for the index because its core business operations are technology-driven: online classifieds platforms, medical imaging software, digital share registry infrastructure. The index’s eligibility criteria look at what a company does operationally, not which GICS sector code it carries. Both classification approaches are valid. They simply measure different things, and investors who assume ATEC maps to a strict IT sector taxonomy will be caught off guard when it doesn’t behave like one.
ATEC’s holdings are not the result of discretionary portfolio management decisions by BetaShares. They are the output of a rules-based index with specific eligibility filters, weighting mechanics, and rebalancing schedules. Understanding those rules is the key to understanding why the fund holds what it holds.
The S&P/ASX All Technology Index applies four primary construction rules:
The index’s primary eligibility screen is operational activity, not GICS sector classification. Companies are included if their core business operations are technology-driven, even if their formal GICS designation places them in industrials, communications, healthcare, or consumer discretionary. This is the mechanism that brings Computershare, REA Group, and Pro Medicus into the same index as Xero and WiseTech Global.
Within the eligible universe, the index applies a float-adjusted market-capitalisation weighting methodology. The largest companies by float-adjusted market cap receive the greatest portfolio weights, subject to the 10% cap that prevents any single name from dominating the index entirely.
That cap constrains concentration without eliminating it. The top 10 holdings represent approximately 74.27% of total fund assets. Despite holding 46 stocks, ATEC behaves in practice as a concentrated thematic portfolio where the performance of a handful of large-cap names, Computershare, Xero (9.8%), NextDC (9.7%), CAR Group, drives the majority of returns.
The distinction between ATEC’s broad technology index and the stricter S&P/ASX 200 Information Technology Index (XIJ) is not merely taxonomic. The market has already run a natural experiment that reveals what the composition difference costs and delivers.
| Metric | ATEC | XIJ |
|---|---|---|
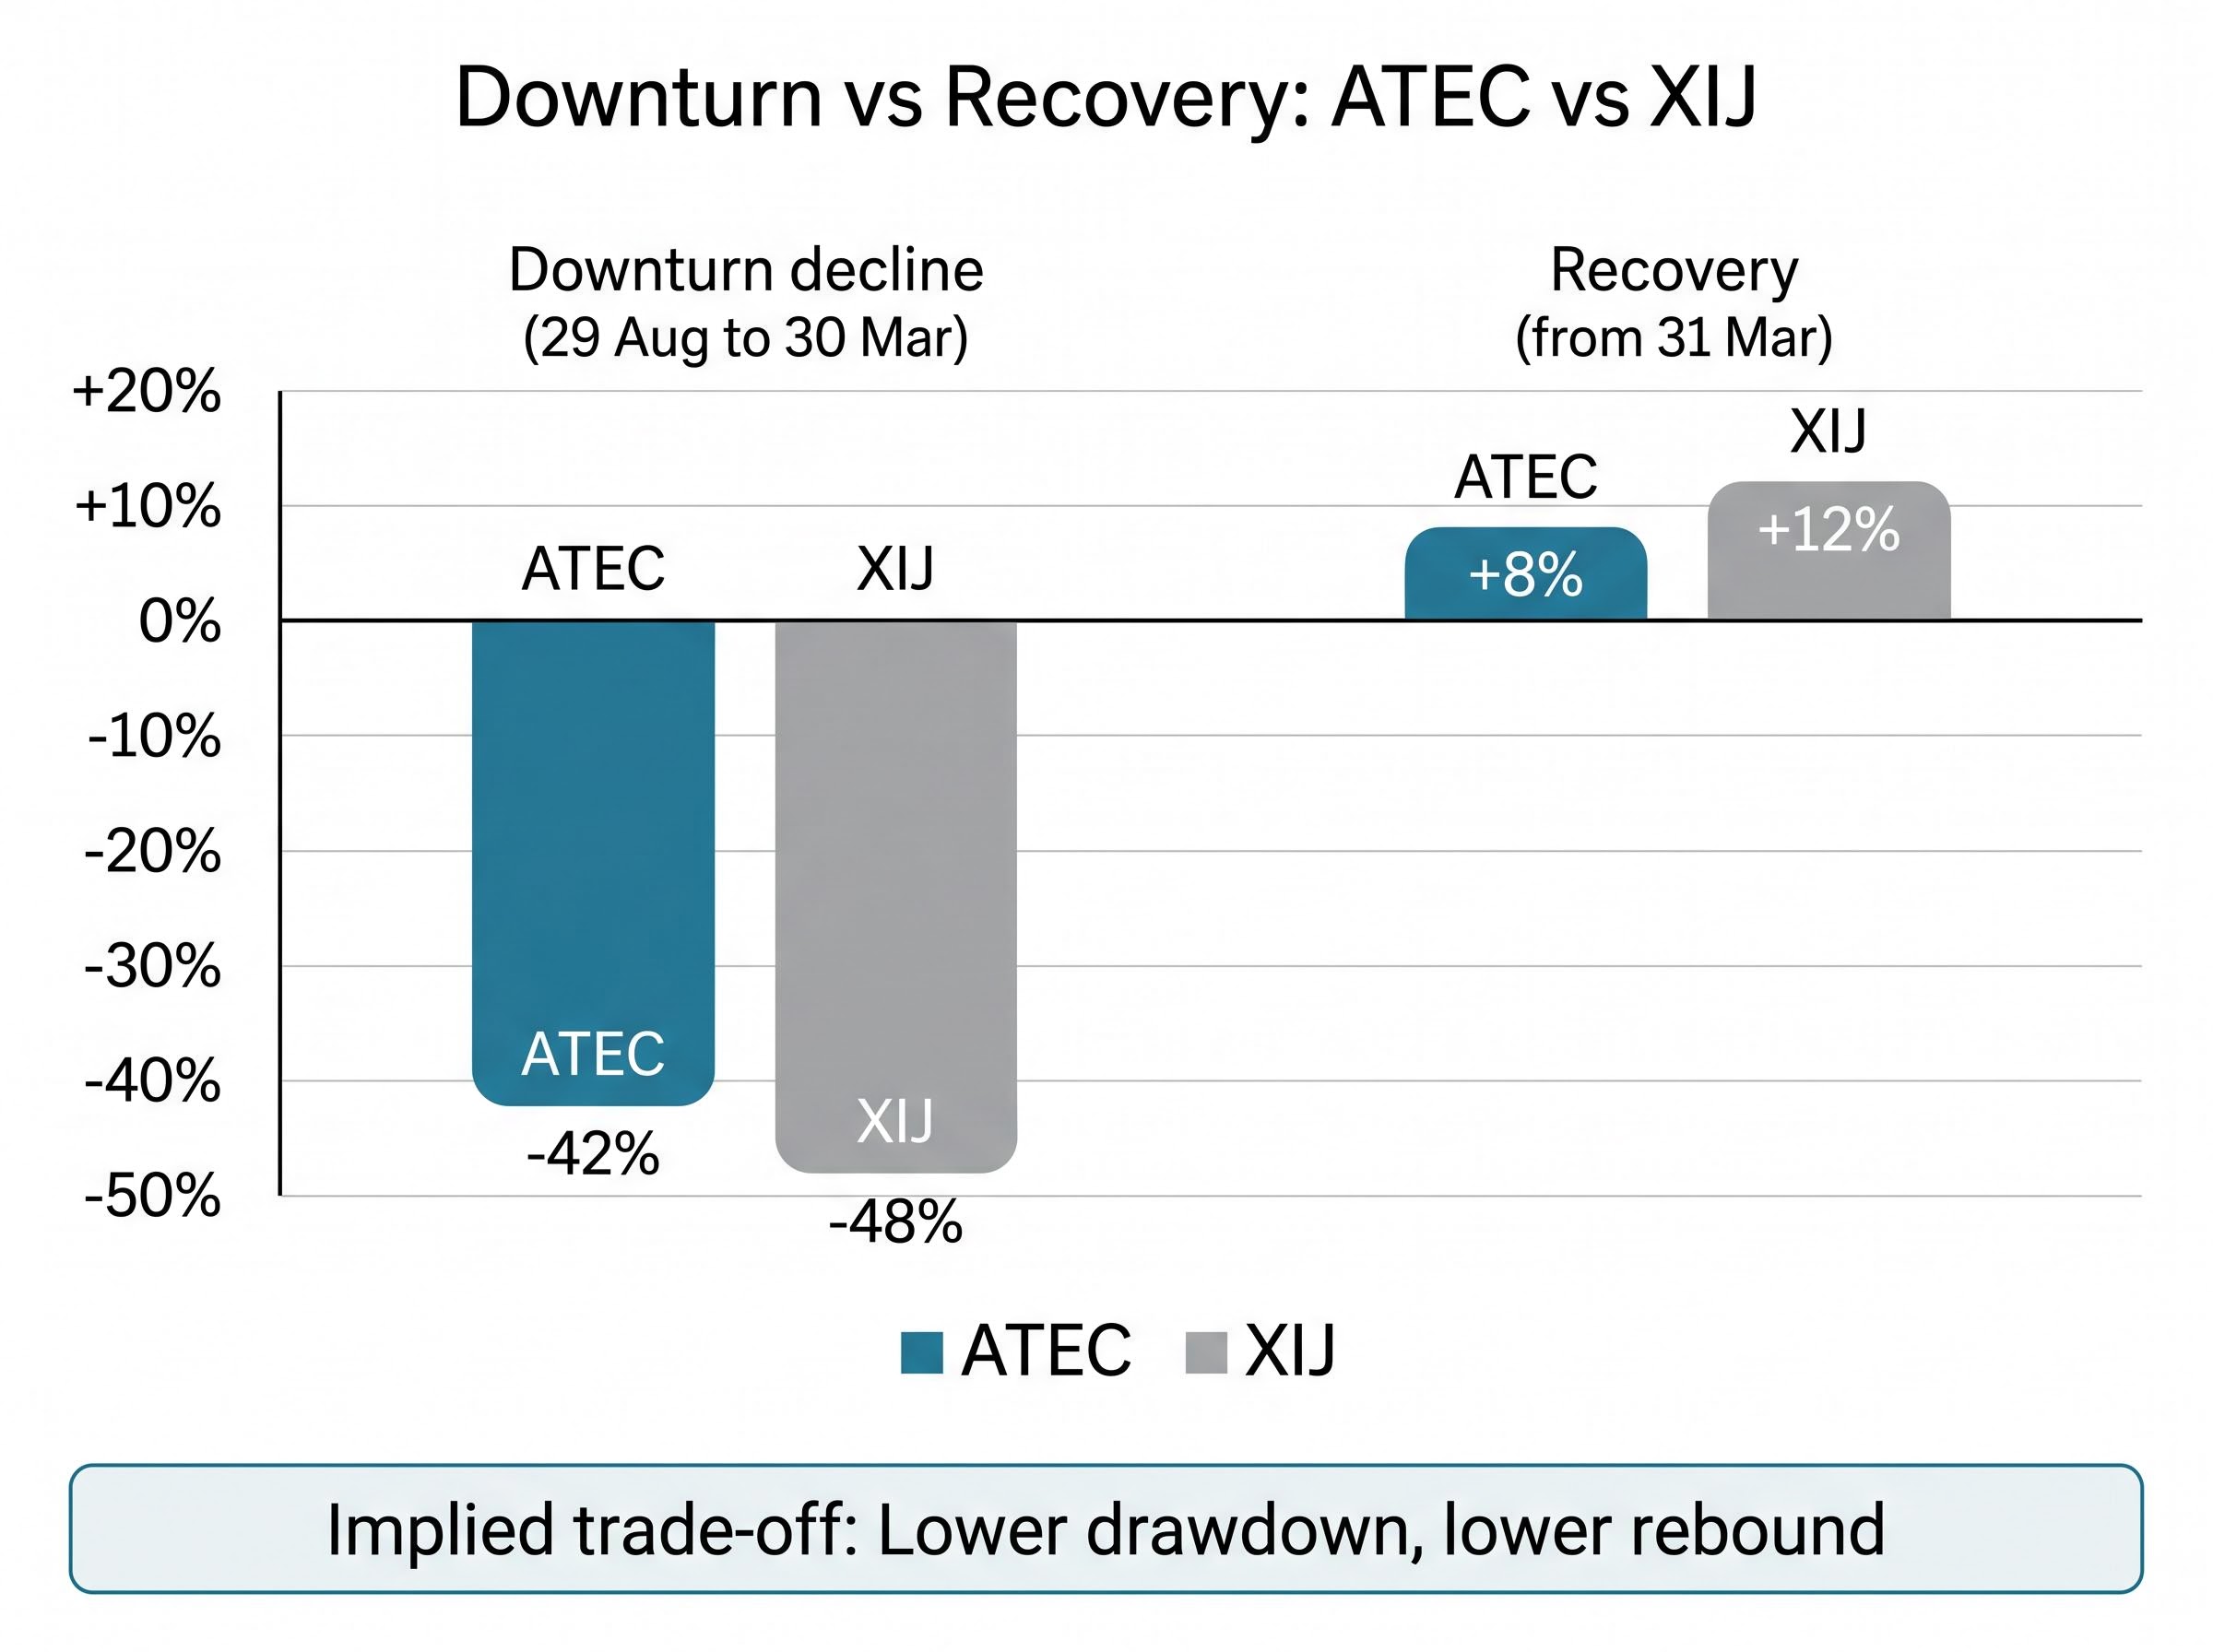
| Downturn decline (29 Aug to 30 Mar) | -42% | -48% |
| Recovery from 31 Mar | +8% | +12% |
| Implied trade-off | Lower drawdown, lower rebound: reduced beta in both directions | |
During the tech sector downturn, ATEC declined 42% from 29 August to 30 March, compared with a 48% fall for the XIJ over the same window. The cross-sector holdings, particularly the industrials and communications names, provided a partial cushion that a strict IT index did not offer. The cost of that cushion became visible in the recovery: ATEC rebounded 8% from 31 March, while the XIJ gained 12%. Lower beta on the way down means lower beta on the way up.
The ASX market cycle from 2022 to 2024 provides the most recent full-sequence reference point for understanding how technology-heavy portfolios behaved through drawdown and recovery: the Information Technology sector surged 52% in 2024 after falling sharply in 2022, a pattern that directly contextualises the kind of performance sensitivity ATEC’s concentrated index structure creates.
According to BetaShares (October 2025), the S&P/ASX All Technology Index has a forward P/E of approximately 60x, compared with 21x for the S&P/ASX 200 Index.
The forward P/E gap between ATEC and the broader ASX 200 is not isolated to the fund level; ASX tech valuation multiples across individual constituents such as Pro Medicus, WiseTech Global, and Xero range from 56 to 68 times trailing earnings, a premium that makes the fund’s aggregate 60x figure easier to contextualise when you examine what drives it at the stock level.
That valuation premium places ATEC at roughly three times the earnings multiple of the broader market, making the fund particularly sensitive to interest rate expectations and earnings delivery.
The broader performance picture reinforces how sensitive return figures are to the measurement window chosen. As at 30 April 2026, ATEC reported a 1-year return of -20.59%, a 3-year annualised return of +7.57%, a 5-year annualised return of -0.11%, and a since-inception annualised return of +8.08%. Motley Fool noted in April 2026 that ATEC had rallied almost 12% in a single week while still sitting 14% below its level at the start of the year. The same fund can look like a strong compounder or a loss-maker depending entirely on where the clock starts.
ATEC occupies a specific position in the Australian ETF market: it is the sole dedicated ETF providing broad Australian technology sector exposure through the S&P/ASX All Technology Index. There is no direct domestic alternative offering the same index coverage.
The closest thematic comparison is Global X TECH, which tracks the Morningstar Developed Markets Technology Moat Focus Index. The two products serve different purposes.
| Feature | ATEC | Global X TECH |
|---|---|---|
| Index tracked | S&P/ASX All Technology Index (AUD) | Morningstar Developed Markets Technology Moat Focus Index (USD) |
| Geographic focus | Australian tech only | Global developed markets |
| Management fee | 0.48% p.a. | 0.45% p.a. |
| Currency exposure | AUD | USD (unhedged) |
Global X TECH is a complementary global technology allocation, not a substitute for domestic exposure. Investors seeking both Australian and international technology positions may hold both, but they serve fundamentally different portfolio roles.
Broad Australian equity ETFs also warrant brief mention for context:
The practical implication is that Australian investors seeking concentrated local tech exposure through an ETF structure have a single option, making it all the more consequential to understand exactly what that option contains.
Across the broader universe of ASX growth ETFs, ATEC’s one-year return of -22.6% as at 31 March 2026 sits at the bottom of a 13-fund comparison that spans returns from -22.6% to +101.2%, a spread that illustrates how significantly sector concentration and index construction choices drive divergence among funds sharing the same general label.
ATEC provides genuine exposure to ASX-listed technology-driven businesses. Its composition also means it will not behave identically to a pure GICS Information Technology sector index. Investors who calibrate expectations around that reality are far better positioned than those who treat the fund’s label as a complete description of its contents.
Three questions an investor should now be equipped to answer:
The distribution profile adds a further dimension. ATEC pays distributions semi-annually in June and December, with a trailing yield estimated at approximately 0.5-1%. This is consistent with the underlying portfolio’s orientation toward growth-stage companies that reinvest earnings rather than distribute them.
As at 30 April 2026, ATEC’s net asset value stood at $21.18 per unit, while the market close price was $21.71, representing an approximately 2.5% premium on that date. Small premiums and discounts to NAV are typical for ASX-listed ETFs, but worth monitoring during periods of elevated volatility.
This article is for informational purposes only and should not be considered financial advice. Investors should conduct their own research and consult with financial professionals before making investment decisions. Past performance does not guarantee future results.
The lesson ATEC offers extends beyond a single fund. Thematic ETF labels describe investment intent, not guaranteed sector composition. The index methodology is the document that tells an investor what a fund actually holds.
The thematic ETF behaviour gap — where reported fund returns diverge sharply from the returns investors actually experience due to poorly timed capital flows — is directly relevant here: a Morningstar study estimated that the ARK fund family destroyed approximately $13.4 billion in shareholder value over ten years even as its headline time-weighted return looked compelling to prospective buyers.
Thematic ETF labels describe investment intent, not precise sector composition. The index methodology is the document that answers the composition question.
ATEC’s cross-sector construction is not a flaw. It is a deliberate feature of the S&P/ASX All Technology Index’s operational-activity-based eligibility approach, designed to capture technology-driven businesses regardless of their GICS classification. Different investors will assess that design choice differently, and both perspectives are reasonable.
The fund has attracted over $567 million in investor capital, reflecting real market adoption. Its since-inception annualised return of +8.08% per annum is the most complete performance datapoint available, though it is sensitive to the March 2020 start date, which coincided with a pandemic-era market trough. Quarterly rebalancing means the fund’s composition and weights shift over time, making a one-time review insufficient for ongoing holders.
Three documents equip an investor to answer the composition question for ATEC, or for any thematic ETF:
ASIC’s Regulatory Guide 282 on exchange-traded products sets out the disclosure obligations that ETF issuers must meet, including the requirement that Product Disclosure Statements accurately describe the investment strategy, index methodology, and risk profile of the fund, which is precisely why reading the PDS before investing in a thematic ETF like ATEC is a regulatory baseline, not merely good practice.
Reading the methodology before committing capital is one of the most practically useful habits an Australian retail investor can develop. ATEC is a clear illustration of why the habit matters.
The BetaShares ATEC ETF is an ASX-listed exchange-traded fund that tracks the S&P/ASX All Technology Index (AUD), providing exposure to Australian technology-driven businesses across multiple GICS sectors, with a management fee of 0.48% per annum and over $567 million in funds under management as at May 2026.
The S&P/ASX All Technology Index uses operational activity as its eligibility screen rather than formal GICS sector classification, meaning companies like Computershare (Industrials), REA Group (Communications), and Pro Medicus (Healthcare) qualify because their core business operations are technology-driven, even though they carry non-technology sector codes.
Despite holding 46 stocks, ATEC's top 10 holdings represent approximately 74.27% of total fund assets, meaning the performance of a small number of large-cap names such as Computershare, Xero, and NextDC drives the majority of the fund's returns.
During the tech sector downturn, ATEC declined 42% compared with a 48% fall for the S&P/ASX 200 Information Technology Index (XIJ) over the same window, but ATEC also recovered less strongly, gaining 8% in the rebound period versus 12% for XIJ, illustrating a lower-beta profile in both directions.
Investors should review three key documents before committing capital to ATEC: the S&P Dow Jones Indices methodology document for the benchmark index, the current BetaShares fund fact sheet (updated monthly), and the Product Disclosure Statement (PDS), which details fees, risks, and distribution policies.