How Zero Commissions Changed the Maths on Thematic ETFs
2 hrs ago
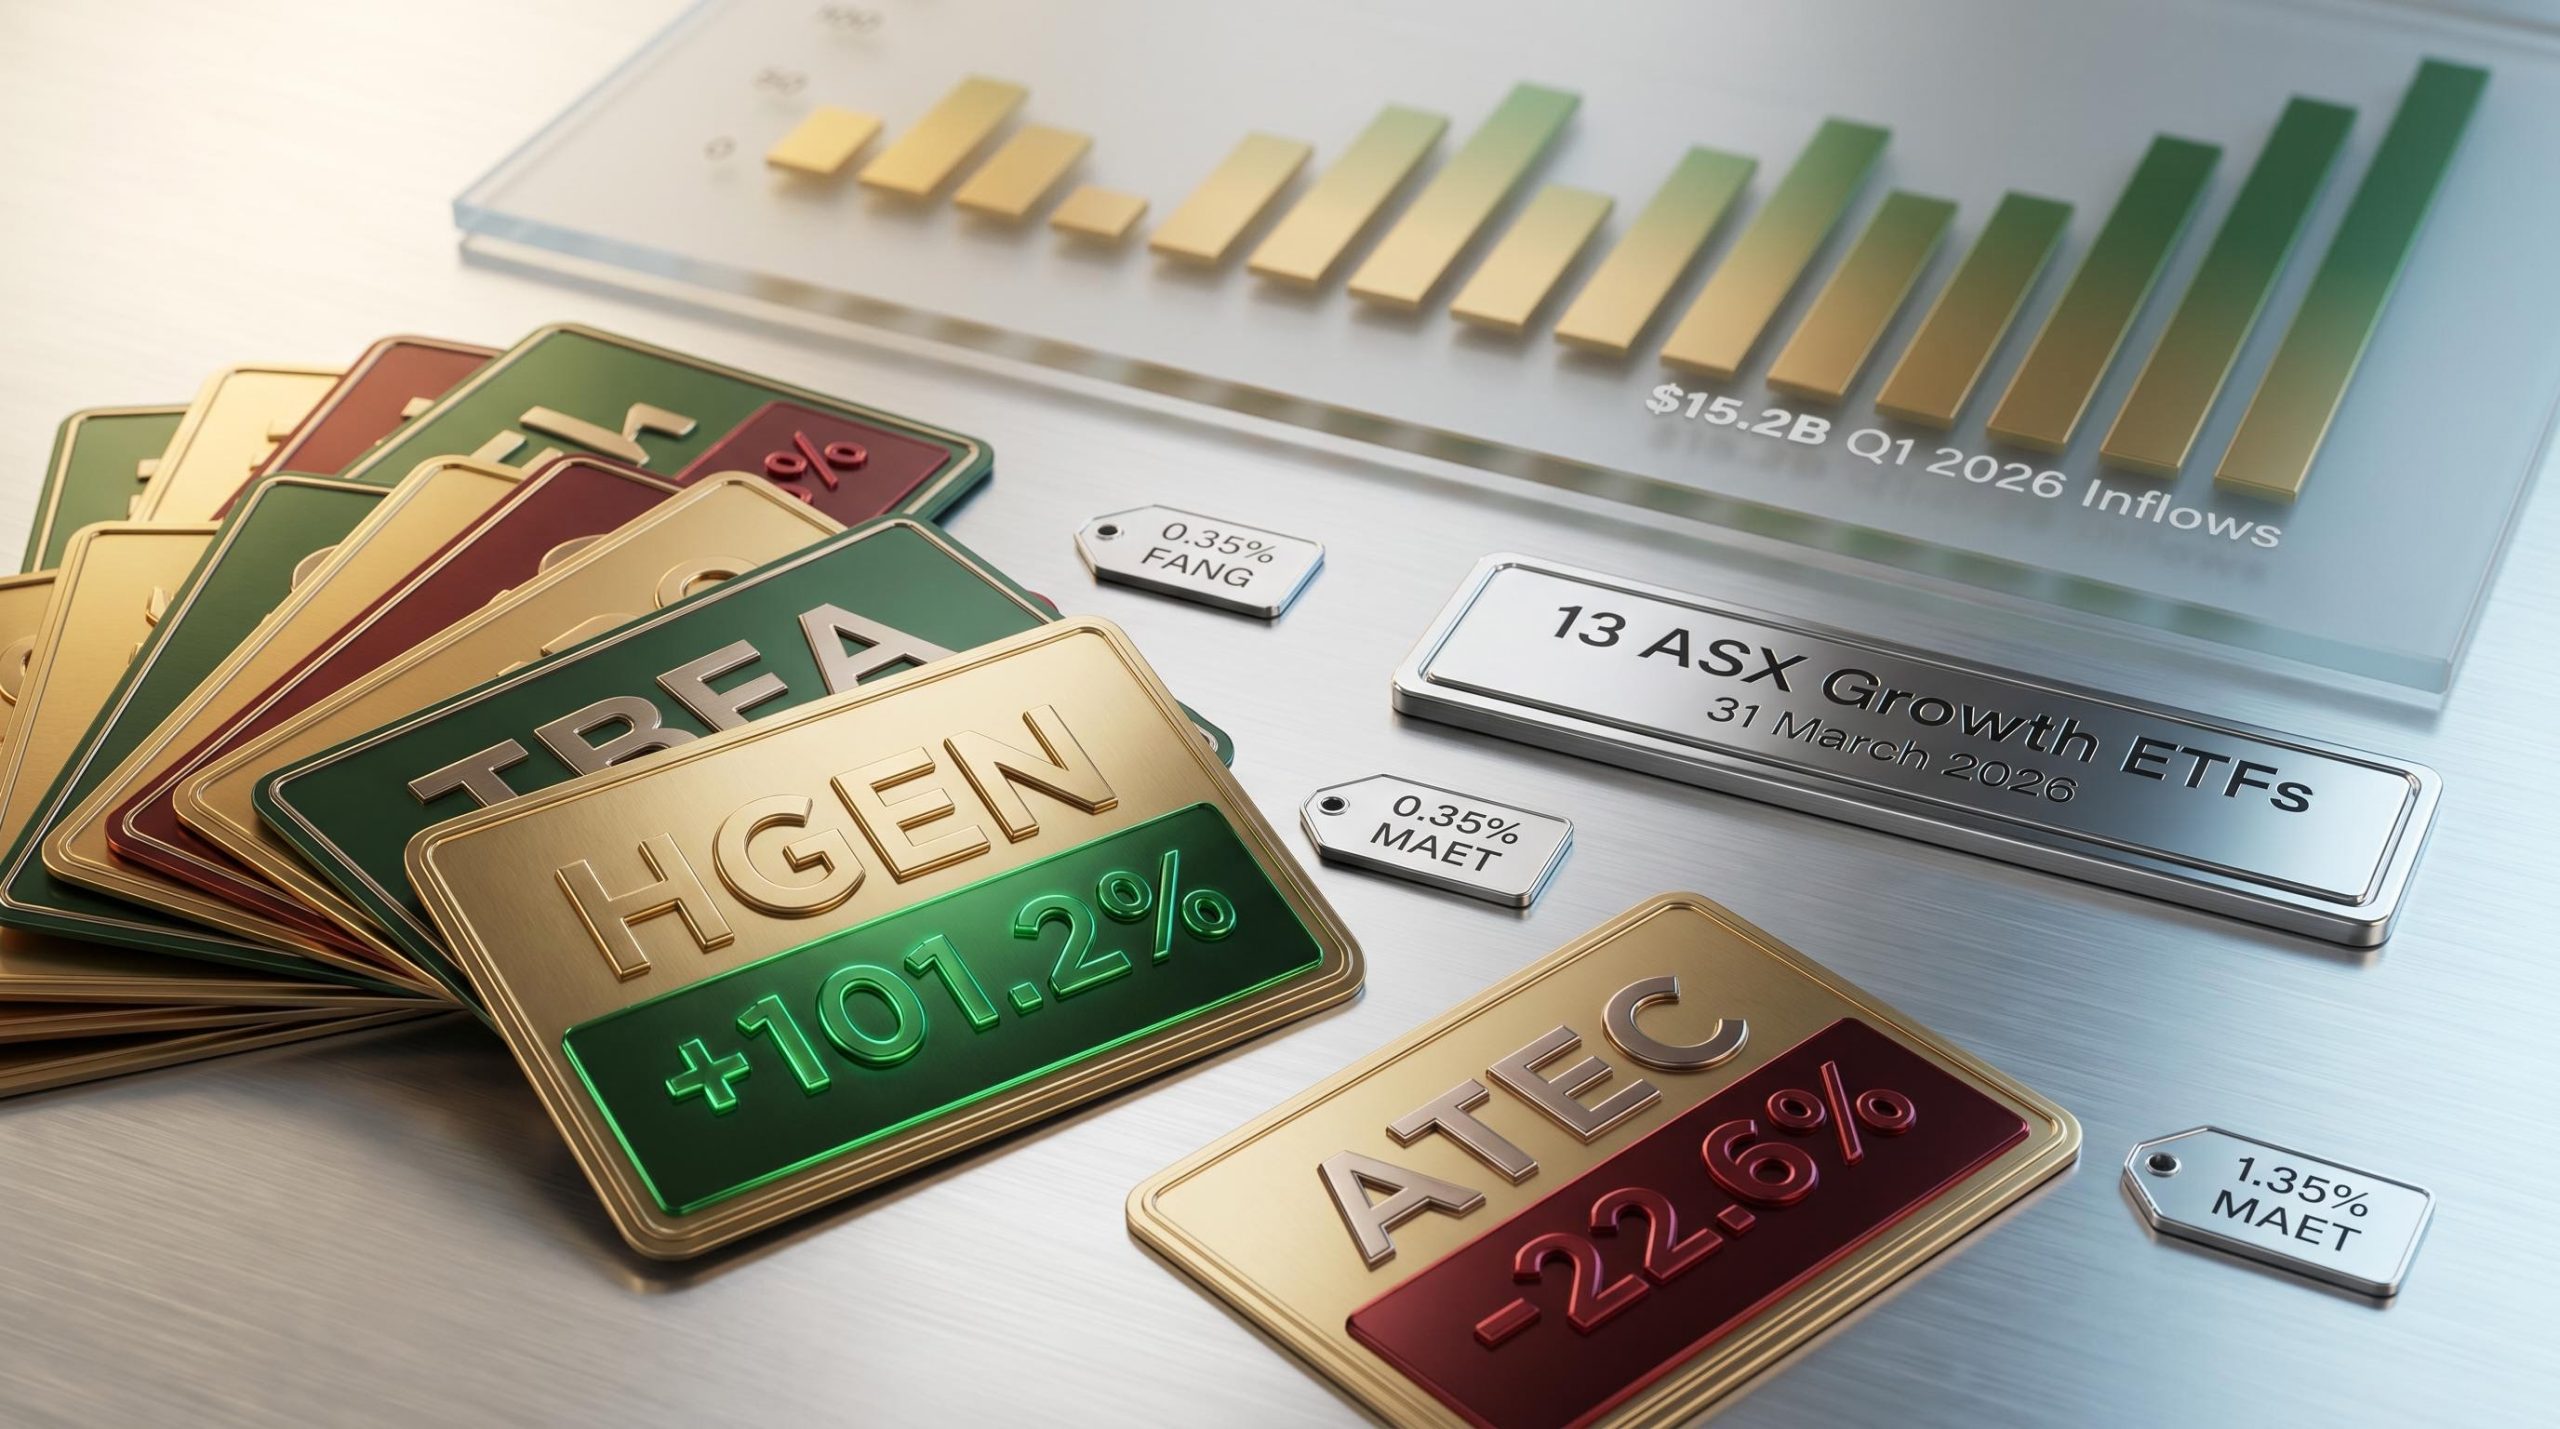
Thirteen ASX-listed ETFs claim meaningful growth exposure, yet their one-year returns as at 31 March 2026 range from -22.6% (ATEC) to +101.2% (HGEN). That is not a small dispersion. It is the difference between a portfolio milestone and a material setback.
Australian investors are directing capital into growth ETFs at a record pace, with Q1 2026 delivering $15.2 billion in total ASX ETF inflows. But the “growth ETF” label covers an enormous range of products. Concentrated thematic plays, actively managed global funds, and broad-market index trackers sit side by side on the same exchange, charging fees from 0.27% to 1.35%, with vastly different underlying exposures.
This article compares all 13 ASX-listed ETFs with meaningful growth company exposure, using data current to 31 March 2026. For each tier of the market, readers get the fee, the growth allocation percentage, and the multi-period return record needed to make an informed selection.
Growth investing targets companies with above-average revenue, earnings, or cash flow growth. These companies typically reinvest profits rather than paying dividends, a distinction that traces back to Benjamin Graham’s value framework, where growth sits at the opposite end of the spectrum from dividend-paying, asset-heavy businesses.
Three characteristics define growth-style holdings:
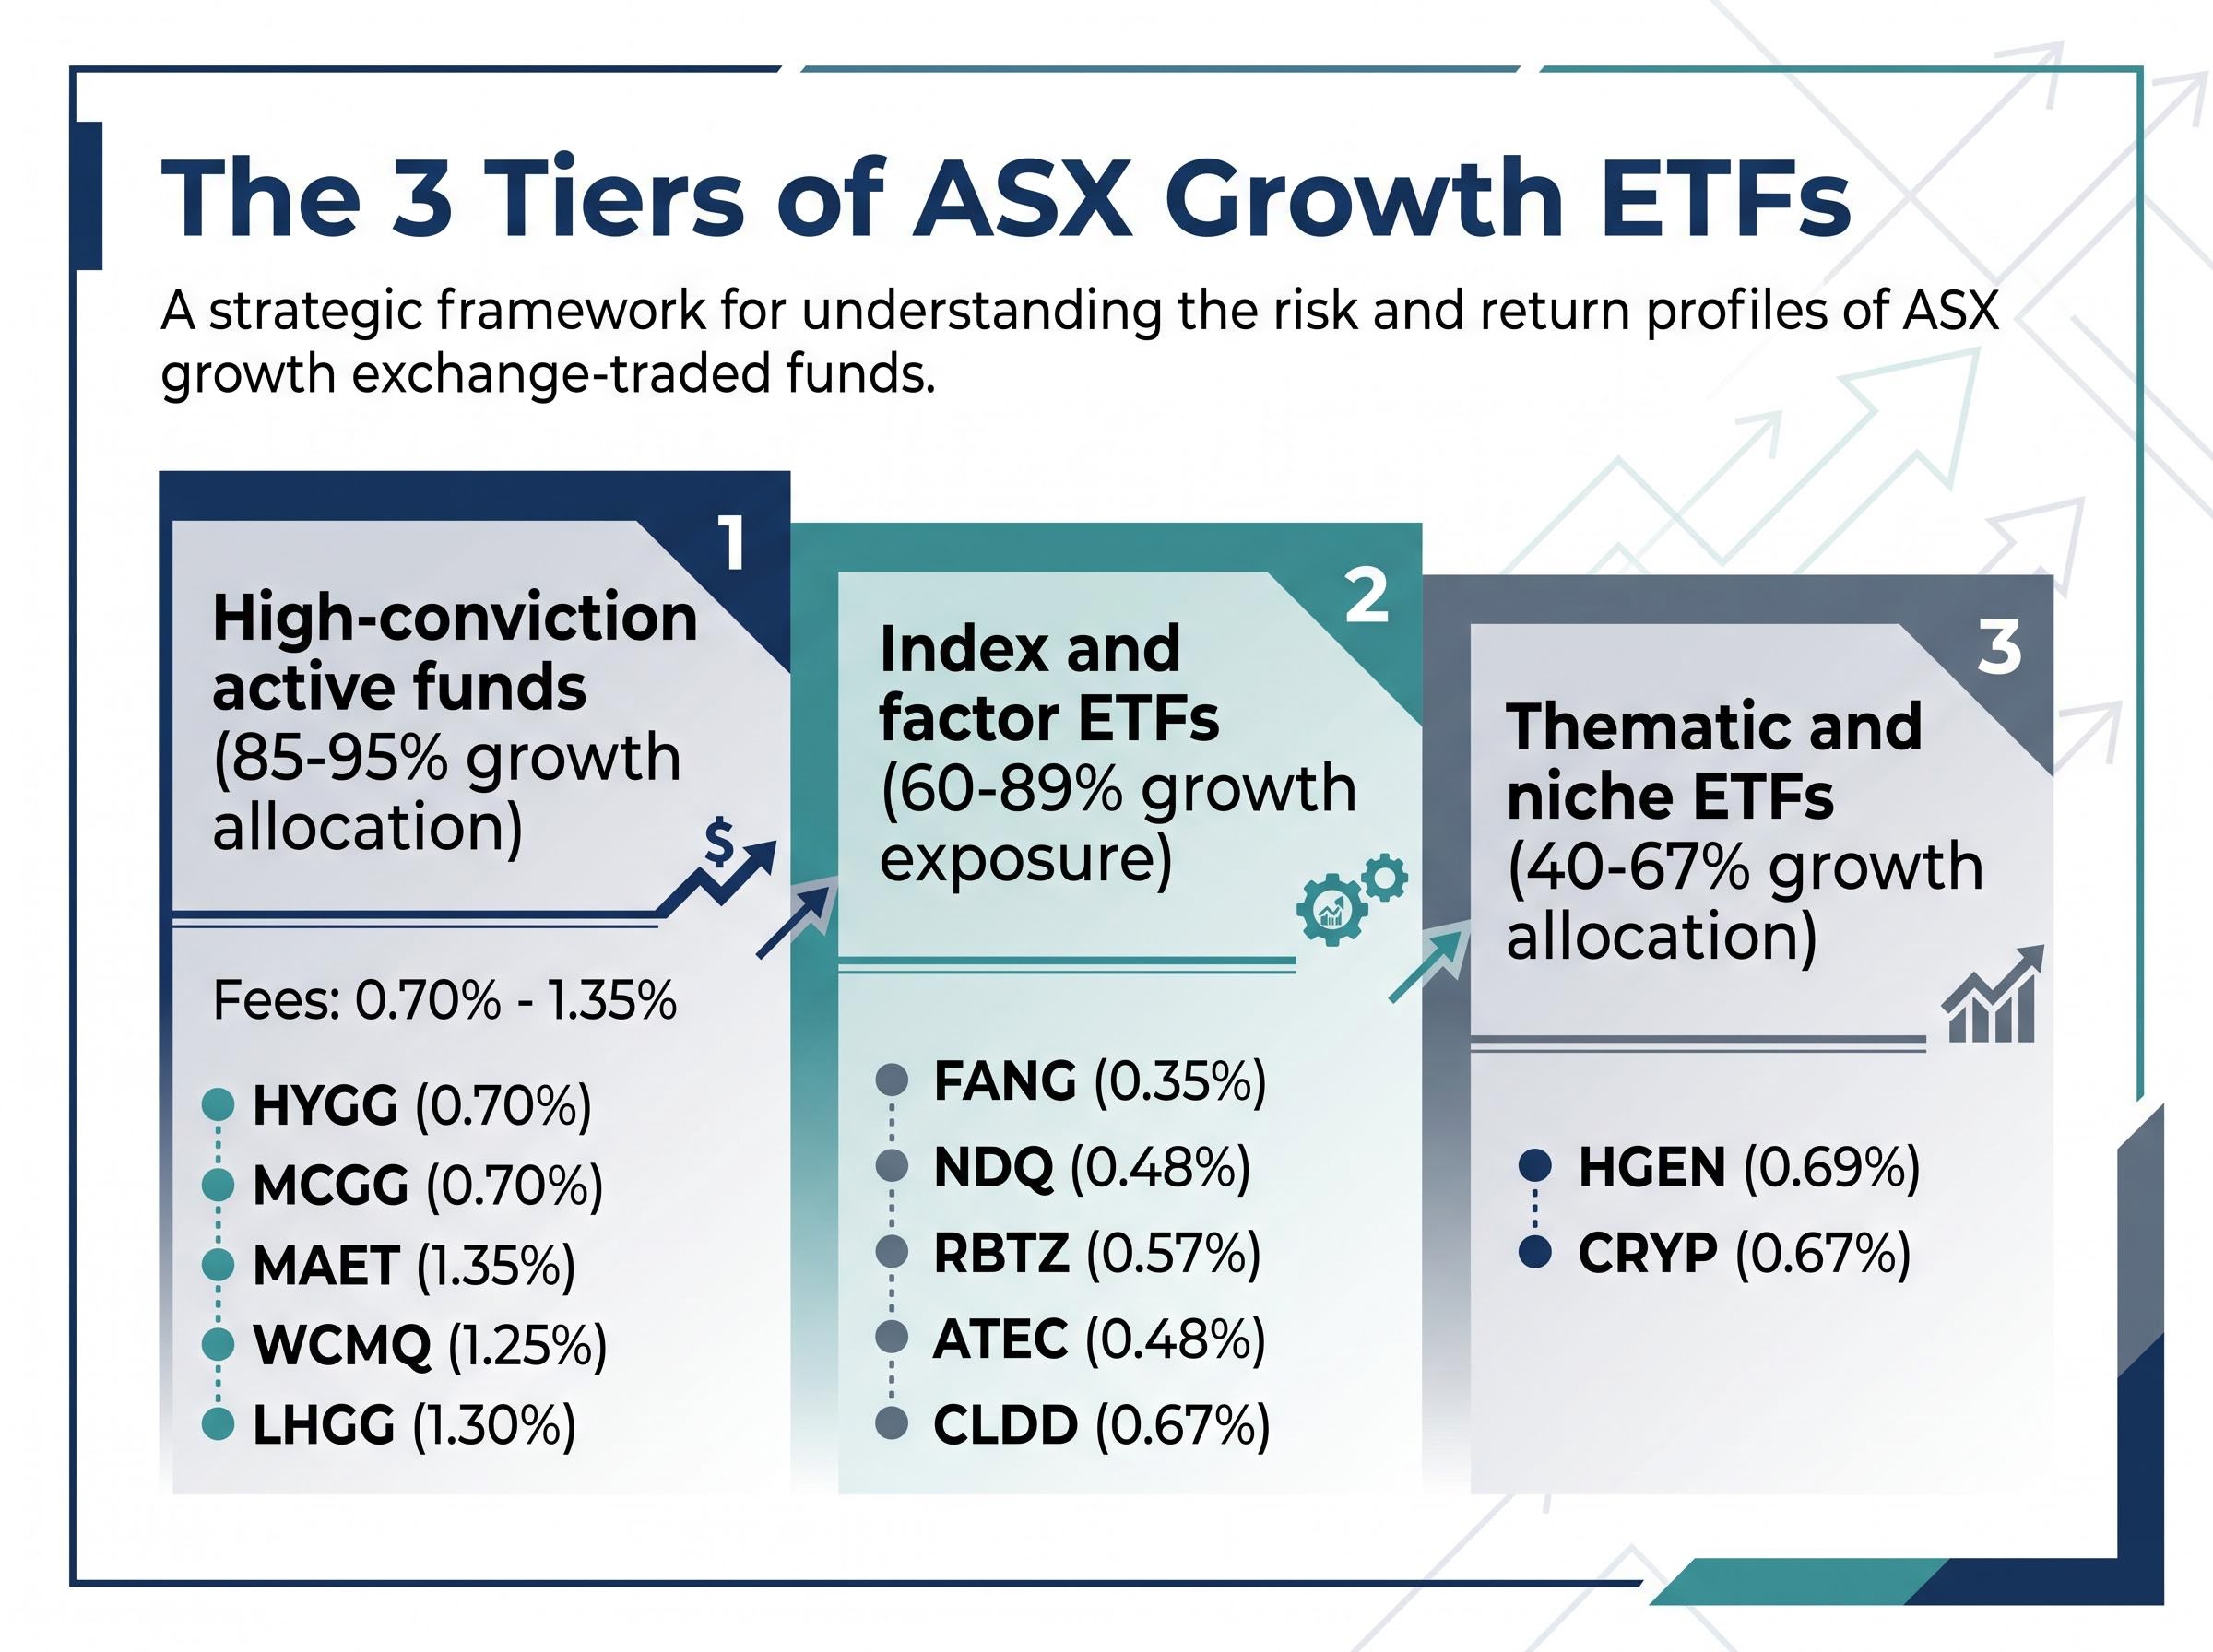
No ASX-listed ETF exclusively tracks a pure growth index. The “growth exposure” figures in this comparison represent the percentage of each fund’s portfolio classified as growth-style holdings. That percentage ranges from 40% (HGEN) to 95% (HYGG), a gap wide enough to make any single comparison misleading without context.
ASX ETF investing has expanded at a remarkable pace, with funds under management reaching $330.6 billion at end-2025 and more than 411,000 new investors entering the market in that year alone, a growth rate that has brought investors with widely varying levels of product knowledge into a market where fund complexity ranges from simple index trackers to highly concentrated thematic bets.
The ASX itself has limited representation of growth-heavy sectors such as technology and biotech. Almost all 13 ETFs in this comparison hold predominantly global rather than domestic companies. For reference, Stockspot portfolio data as at 31 March 2026 shows a balanced portfolio held only approximately 22% in growth-style holdings. Investors selecting any fund in this list are making a deliberate style tilt well beyond that baseline.
The table below ranks all 13 ETFs by growth allocation percentage, the most structurally meaningful ordering for investors comparing exposure levels. All figures are sourced as at 31 March 2026.
| ASX Code | Growth Allocation (%) | Management Fee (%) | Fund Type |
|---|---|---|---|
| HYGG | 95 | 0.70 | Active |
| MCGG | 90 | 0.70 | Active |
| FANG | 89 | 0.35 | Index |
| MAET | 85 | 1.35 | Active |
| RBTZ | 81 | 0.57 | Thematic/Index |
| WCMQ | 81 | 1.25 | Active |
| ATEC | 76 | 0.48 | Index |
| CLDD | 66 | 0.67 | Thematic |
| NDQ | 61 | 0.48 | Index |
| OPPT | 59 | 0.75 | Active |
| MKAX | 54 | 1.25 | Active |
| CRYP | 50 | 0.67 | Thematic |
| HGEN | 40 | 0.69 | Thematic |
Note: OPPT (formerly MHHT) was rebranded in September 2025. Its fee was reduced from an original MER of 1.50% to 0.75% between Q3 and Q4 2025. Investors should verify the current MER directly, as further structural changes were announced in May 2026.
A pattern emerges that fees alone obscure: the highest-conviction growth funds are not necessarily the most expensive. FANG delivers 89% growth allocation at 0.35%, while MKAX offers just 54% at 1.25%.
The one-year return range tells the headline story. HGEN returned +101.2% over the year to 31 March 2026. ATEC lost -22.6% over the same period. That spread of more than 120 percentage points came from funds that all carry the same “growth ETF” label.
Three-year annualised data narrows the field of consistent performers. CRYP leads at 35.9%, followed by MCGG at 24.1% and both WCMQ and NDQ at 20.5%. But one-year snapshots can be misleading, particularly for thematic products.
CRYP‘s one-year return swung from +78.5% (September 2025) to -1.6% (December 2025) to +19.4% (March 2026). Three data points, three entirely different conclusions about the same fund.
| ASX Code | 1-Year Return (%) | 3-Year Annualised (%) | 5-Year Annualised (%) | Notes |
|---|---|---|---|---|
| HGEN | +101.2 | — | — | Limited track record |
| CRYP | +19.4 | 35.9 | — | Extreme volatility |
| MCGG | +16.0 | 24.1 | — | No 5-year history |
| MAET | +12.4 | 17.8 | 8.4 | |
| NDQ | — | 20.5 | 14.9 | 84% cumulative over 5 years |
| FANG | — | — | 18.0 | Top 5-year performer |
| RBTZ | +4.0 | 8.1 | 2.1 | |
| HYGG | -4.9 | 19.1 | 8.2 | |
| MKAX | -19.6 | 13.0 | — | No 5-year history |
| CLDD | -16.5 | — | -3.0 | Negative 5-year return |
| ATEC | -22.6 | — | 0.1 | Near-zero 5-year return |
Only seven of the 13 ETFs have five-year return histories. FANG leads with an annualised return of 18.0%, followed by NDQ at 14.9%. At the other end, CLDD returned -3.0% annualised and ATEC delivered just 0.1% over the same period.
Several newer active ETFs, including MCGG, CRYP, and MKAX, lack five-year data entirely. Funds such as GCQF and NNWH, listed for broader context, face the same limitation. For investors who require a long-run track record before committing capital, this narrows the field considerably.
Comparing HGEN with NDQ as though they compete for the same portfolio role misreads the data. These 13 funds separate into three distinct tiers based on growth allocation, fee level, and fund structure.
The active management penalty is worth quantifying. Research consistently shows more than 80% of active managers fail to beat their benchmarks over time. Management fees of 1.25-1.35% require sustained outperformance simply to match a lower-cost index alternative. VDHG, at 0.27% with a 90% growth allocation, serves as the low-fee benchmark for broadly diversified high-growth exposure on the ASX.
The SPIVA Australia Scorecard from S&P Dow Jones Indices found that over 15-year periods, more than 87% of Australian equity general funds and over 95% of global equity funds failed to beat their respective benchmarks, placing the active management fee premium under direct quantitative pressure for any investor comparing active growth ETFs against lower-cost index alternatives.
Unhedged global ETFs, including NDQ, FANG, HYGG, and FRGG, expose Australian investors to AUD/USD fluctuations. With the Australian dollar at approximately 0.7250 as at May 2026, currency movements can amplify or reduce returns independent of underlying equity performance. Hedged alternatives such as NNWH (MSCI World AUD Hedged) and MAET exist for investors seeking to isolate equity returns from currency movements.
Q1 2026 saw $15.2 billion in inflows into ASX-listed ETFs, a record quarter. VGS alone attracted $361 million in January. Broad equity growth ETFs are the primary beneficiaries; thematic products like HGEN and CRYP have not been identified as major recipients of these flows.
Three macro variables are shaping the environment for growth ETF holders in mid-2026:
Growth stock valuations entered mid-2026 at a 21% discount to fair value, a level Morningstar data shows has occurred less than 5% of the time since 2011, suggesting that the same macro headwinds creating short-term return dispersion across these 13 ETFs may also be compressing underlying portfolio company prices below their intrinsic worth.
The RBA May 2026 cash rate decision confirmed a 25 basis point increase to 4.35%, with the Board’s statement noting that inflation remained above target and that further tightening would depend on incoming data, a conditional stance that leaves growth-style equity valuations exposed to additional rate pressure if economic indicators surprise to the upside.
Selecting a growth ETF in this environment means entering a market where rate sensitivity, currency risk, and trade policy are all active variables. The record inflows suggest conviction in long-term equity growth, but the macro backdrop calls for careful calibration of concentration risk relative to time horizon.
FANG‘s 18.0% five-year annualised return came at a fee of 0.35%. Several active funds charging 1.25-1.35% did not consistently outperform it over the same period. The fee gap compounds over time, and it compounds against the investor.
HGEN‘s 101.2% one-year return and CRYP‘s extreme volatility are real data points. They are also outcomes most retail investors cannot hold through. Drawdowns in growth ETFs can exceed 50% in adverse conditions, and the behavioural cost of selling at the bottom often exceeds the theoretical cost of missing the top.
Stockspot’s own balanced portfolio data reinforces this: holding approximately 22% in growth-style holdings suggests that even professional allocation models treat pure growth exposure as a tilt, not a base.
Investors exploring why HGEN’s 101.2% one-year return and CRYP’s extreme volatility are outcomes most retail investors cannot hold through will find our deep-dive into thematic ETF timing risk, which documents how the ARK Innovation ETF reported a +233% time-weighted return while the typical investor experienced approximately -35% due to poorly timed inflows, and applies that structural analysis to the $14 billion sitting in ASX-listed technology-themed ETFs today.
A practical framework for allocating across these tiers:
No single ETF in this comparison suits every investor. The right choice depends on time horizon, fee tolerance, volatility tolerance, and whether active or passive management aligns with the investor’s conviction.
Three steps for building a growth ETF allocation:
ETF fees compound over time in ways that most investors underestimate: Morningstar research identifies management cost as a more reliable predictor of long-run relative returns than past performance, fund size, or star ratings, and a fee difference of less than 1% per annum can translate into a terminal wealth divergence exceeding $575,000 over a 30-year horizon.
All data in this article reflects conditions as at 31 March 2026. Fund structures and fees do change, as demonstrated by OPPT‘s fee reduction. Investors should verify current fees and performance before acting.
This article is for informational purposes only and should not be considered financial advice. Investors should conduct their own research and consult with financial professionals before making investment decisions. Past performance does not guarantee future results. Financial projections are subject to market conditions and various risk factors.
A growth ETF on the ASX is an exchange-traded fund that holds companies focused on above-average revenue, earnings, or cash flow expansion, where returns come primarily from share price appreciation rather than dividend income. No ASX-listed ETF exclusively tracks a pure growth index, so growth allocation percentages across funds range widely, from around 40% to 95%.
VDHG charges 0.27% per annum and carries a 90% growth allocation, making it the lowest-cost broadly diversified high-growth option on the ASX. Among thematic and index alternatives, FANG charges 0.35% with an 89% growth allocation, ranking it as the lowest-fee option in the concentrated growth category.
Management fees compound against investors over time, and Morningstar research identifies cost as a more reliable predictor of long-run relative returns than past performance or fund ratings. A fee difference of less than 1% per annum can translate into a terminal wealth divergence exceeding $575,000 over a 30-year horizon.
Active growth ETFs, such as HYGG and MCGG, use stock selection by fund managers and typically charge fees of 0.70% to 1.35%, while index-based alternatives like FANG and NDQ follow rules-based or passive strategies at roughly half the cost. Research from the SPIVA Australia Scorecard shows that over 15-year periods, more than 95% of global equity funds failed to beat their benchmarks, placing the active fee premium under significant pressure.
The RBA raised the cash rate by 25 basis points to 4.35% on 5 May 2026, a move that historically compresses the premium investors pay for future earnings and acts as a direct headwind for growth-style holdings. Investors in unhedged global growth ETFs face an additional layer of exposure because currency movements between the Australian dollar and US dollar can further amplify or reduce returns independent of underlying equity performance.