How ASIC Cancels an AFS Licence and What Happens to Clients
7 hrs ago

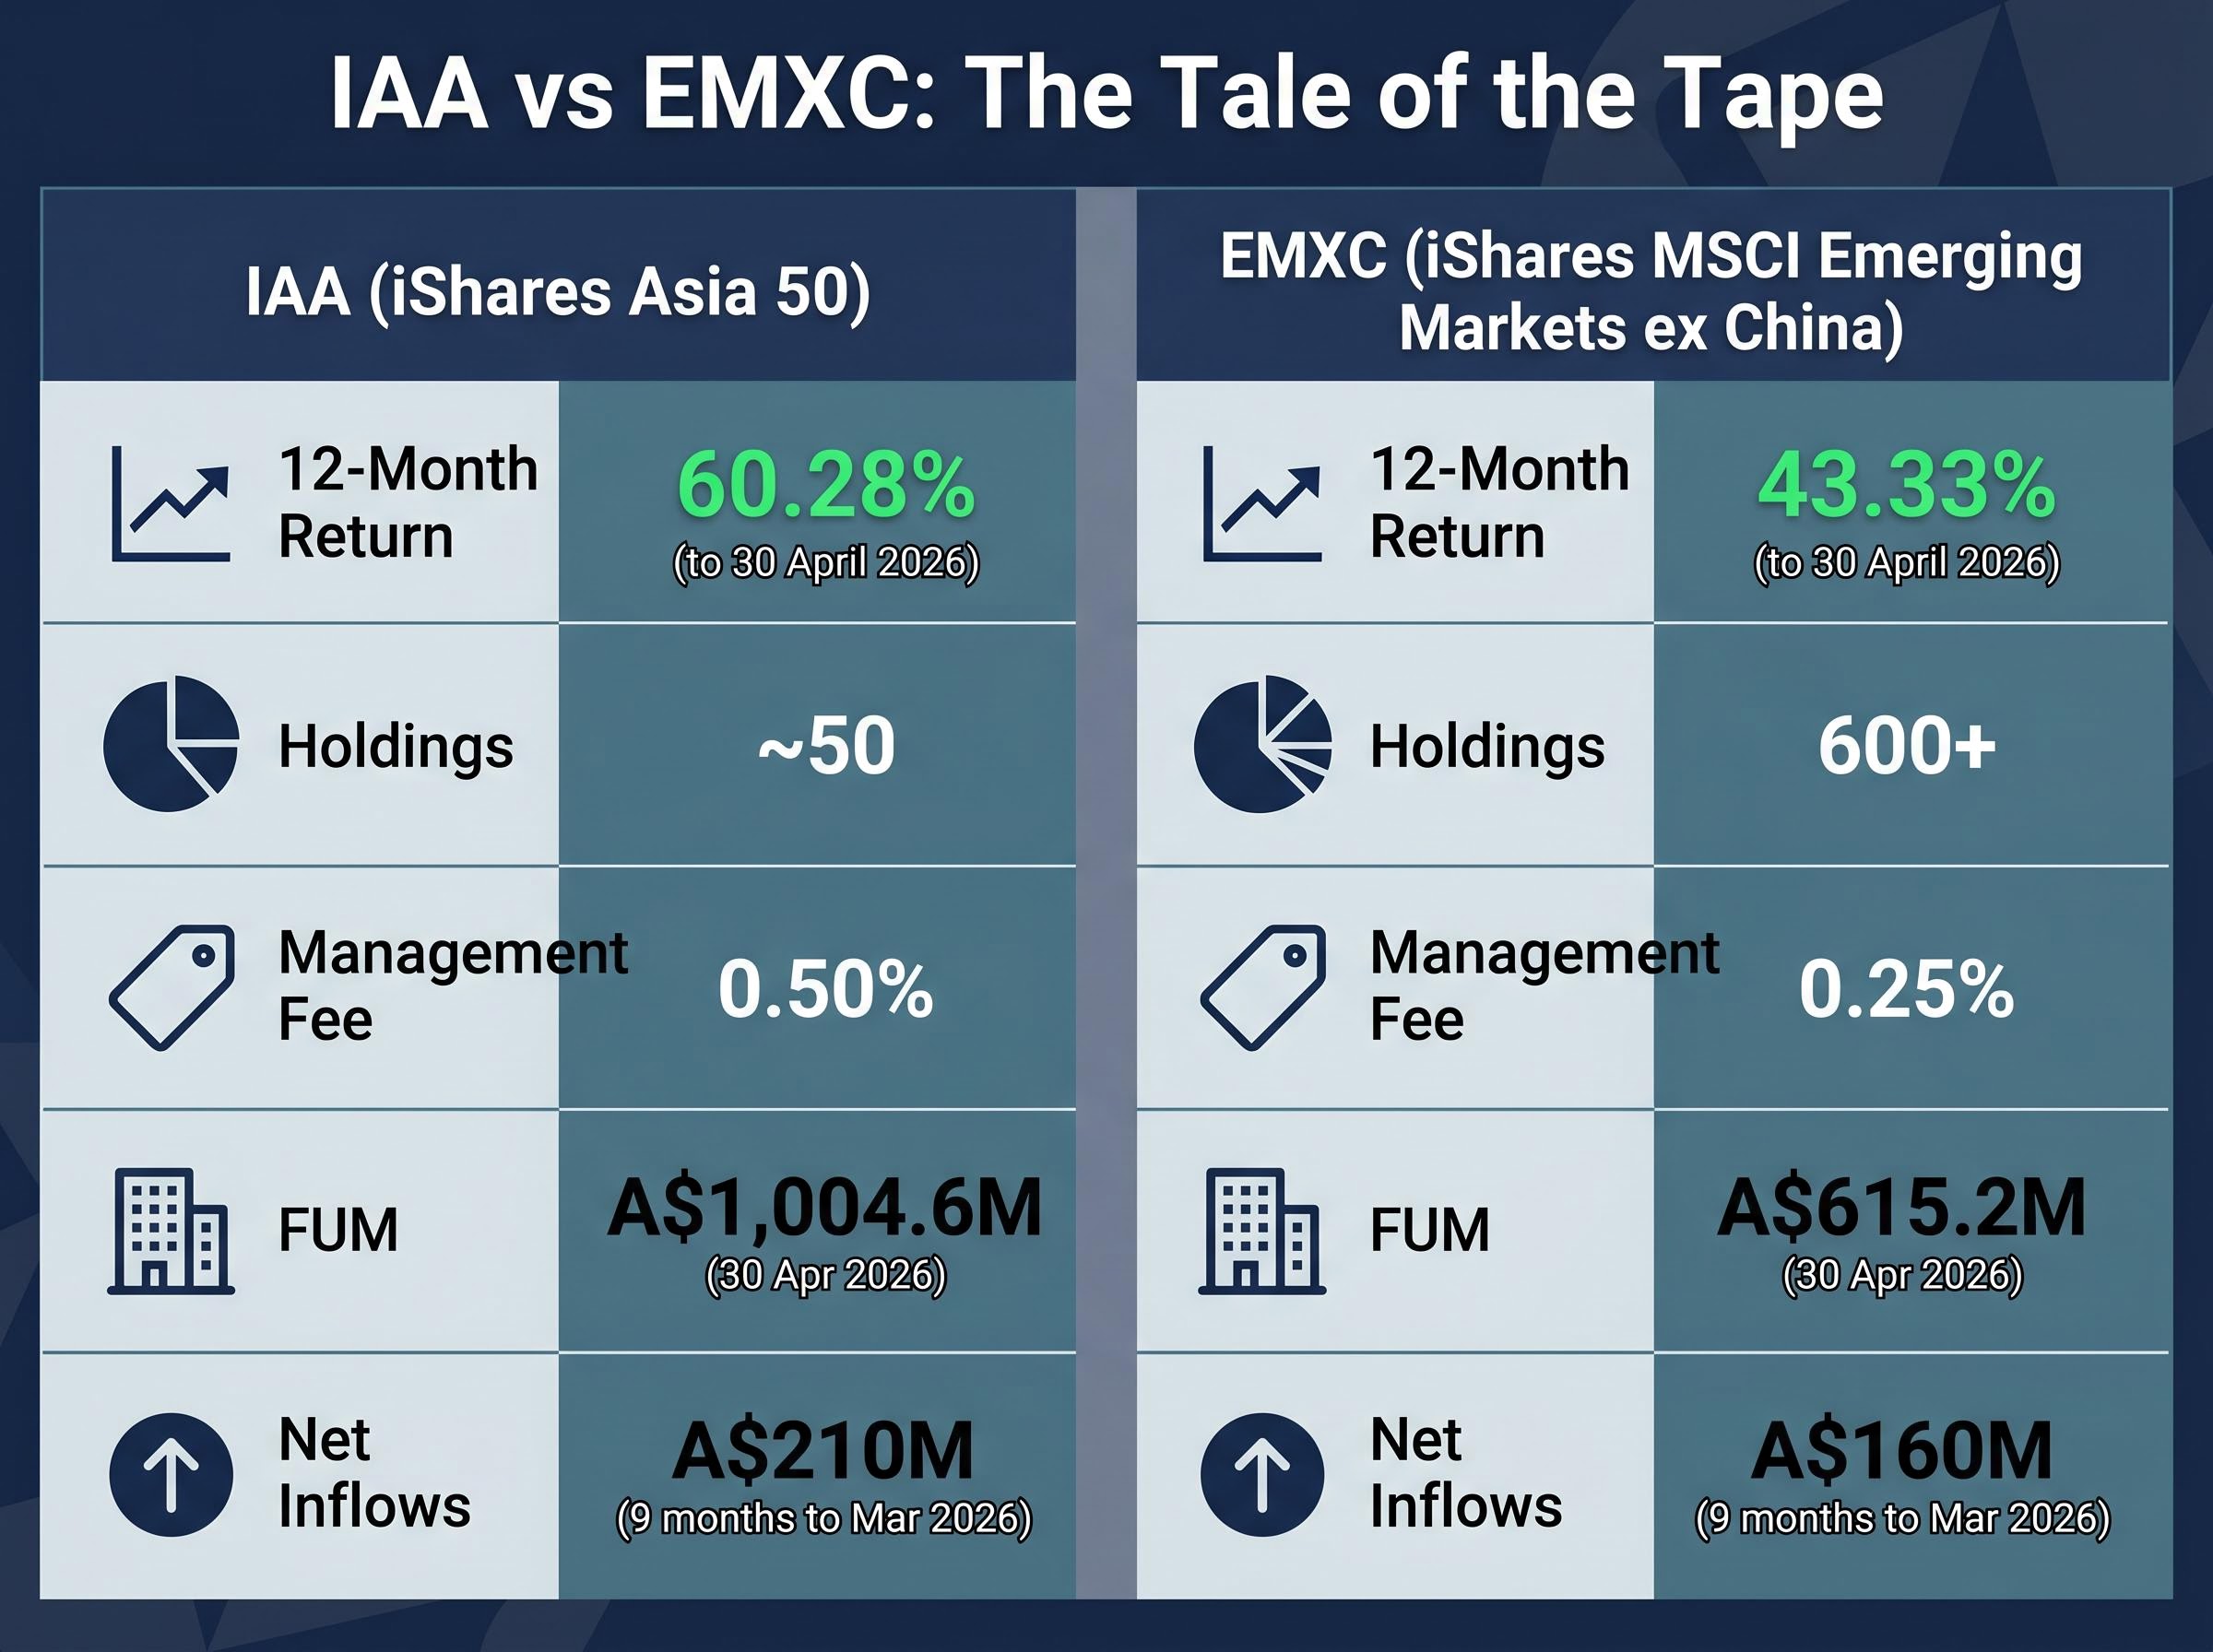
Two iShares ETFs listed on the ASX have posted returns that would make most Australian equity funds blush. IAA (iShares Asia 50 ETF) returned 60.28% and EMXC (iShares MSCI Emerging Markets ex China ETF) returned 43.33% over the 12 months to 30 April 2026, net of fees, in AUD.
Australian investors looking beyond the ASX 200 and the familiar US tech giants are increasingly turning to Asia-focused ETFs to access growth stories in India, Taiwan, South Korea, and Singapore. The timing matters: these gains arrived as flows into international equity ETFs surged, with IAA attracting approximately A$210 million in net inflows and EMXC pulling in approximately A$160 million over the nine months to March 2026, according to Morningstar Australia.
What follows breaks down exactly what drove those returns, what each fund holds, why one of them deliberately cuts out China, and what Australian investors should weigh before adding either to a portfolio.
Both IAA and EMXC are passive, index-replicating ETFs listed on the ASX, managed by BlackRock’s iShares division, and traded in AUD with no foreign-exchange brokerage required. They track different indices, and that distinction explains nearly everything about how their returns diverge.
The broader ASX Asia ETF comparison across IAA, ASIA, and VAE reveals that management fees, index concentration, and sector tilt produce materially different risk profiles even among funds marketed to the same investor audience; IAA’s 0.50% fee sits between BetaShares ASIA at 0.67% and VAE at a confirmed 0.29%, a gap that compounds meaningfully over a multi-year holding period.
The ASX disclosure requirements for ETPs mandate that issuers publish the Net Asset Value per unit and portfolio composition daily, giving Australian investors the transparency needed to verify what each fund actually holds before committing capital.
| Feature | IAA | EMXC |
|---|---|---|
| Index tracked | S&P Asia 50 | MSCI Emerging Markets ex China |
| Approx. holdings | 50 | 600+ |
| Key countries | Taiwan, South Korea, Hong Kong, Singapore | India, Taiwan, South Korea, Brazil |
| FUM (30 Apr 2026) | A$1,004.6M | A$615.2M |
| Management fee | 0.50% | 0.25% |
Returns are total returns inclusive of distributions, calculated in AUD, net of fees. Currency movements between Asian markets and the Australian dollar are already embedded in the numbers. iShares manages approximately A$57.79 billion in Australian funds under management as of April 2026, placing it alongside Vanguard and BetaShares as one of the three dominant ETF providers on the ASX.
The S&P Asia 50 Index comprises the 50 largest companies across Taiwan, South Korea, Hong Kong, and Singapore. The result is a concentrated, large-cap portfolio skewed heavily toward technology and financials. That concentration amplifies returns in a tech-led bull run and creates meaningful downside risk when the cycle turns.
The MSCI Emerging Markets ex China Index is far broader, spanning 600+ holdings across emerging markets with China deliberately removed. That exclusion shifts the country weight profile substantially toward India, Taiwan, and South Korea, all faster-growing markets that have benefited from structural tailwinds over the past year.
12-month NAV total return: 60.28% (after fees, AUD, to 30 April 2026)
The return was not a single-quarter spike. IAA’s FY-to-date return of 15.86% (from 1 July 2025 to 30 April 2026) confirms that performance was distributed across the financial year, with the bulk of gains arriving in the second half of calendar 2025 as the semiconductor and AI infrastructure cycle accelerated.
Three country-level forces combined to make a 60% return achievable from just 50 stocks:
IAA’s concentrated structure is the amplifier. Fifty stocks, heavy in tech and financials, means that when those sectors move, the fund moves with them, in both directions. For Australian investors seeking a higher-beta tilt to Asian tech, this 12-month result illustrates the upside case. The same concentration that produced 60% creates real downside risk if the semiconductor cycle turns. According to Morningstar Australia, IAA attracted approximately A$210 million in net inflows over the nine months to 31 March 2026.
The semiconductor bubble narrative has gained traction as valuations have expanded, but Bank of America’s analysis shows that active long-only overweight in semiconductors sits at approximately 20%, roughly half the 40% peak seen in the 2017 cycle, suggesting the positioning that drove IAA’s Taiwan and South Korea weightings to outsized returns is elevated but not yet at the extremes associated with speculative excess.
EMXC’s 43.33% NAV total return (after fees, AUD, to 30 April 2026) is the product of a deliberate structural tilt, not just a market tailwind. The FY-to-date return of 14.29% shows sustained momentum across the financial year.
The outperformance relative to standard emerging-market indices rests on two pillars: what the fund excludes and where the resulting weight concentrates. Chinese equities have been a drag on traditional EM benchmarks, and removing them has shifted capital toward markets with stronger earnings growth.
EMXC’s key country contributors, each with a distinct growth driver:
EMXC attracted approximately A$160 million in net inflows over the nine months to 31 March 2026, with the bulk arriving since January 2026 as ex-China EM outperformance gained attention among Australian investors, according to Morningstar Australia.
The result shows that deliberate index construction choices, specifically what a fund excludes, can matter as much as what it includes. That distinction is worth understanding for Australian investors building portfolios rather than simply chasing recent winners.
S&P Emerging Ex-China index research published in September 2024 quantified how China’s historical dominance in standard EM benchmarks produces a materially different risk and return profile compared to an ex-China construction, providing independent support for the case that index design choices, not just market conditions, shape long-run outcomes.
The shift toward ex-China emerging-market ETFs is not a single concern. It is four distinct concerns, each sufficient on its own to prompt a portfolio adjustment:
The Stockspot ETF Report 2025 positions EMXC as a “core building block” for investors who want to manage China exposure separately. ASX Investor Update publications compare EMXC directly against IEM (iShares MSCI Emerging Markets, which includes China) and VGE (Vanguard FTSE Emerging Markets, which also includes China) as the standard alternatives.
Morningstar analysts explicitly caution that EMXC’s recent outperformance is partly a function of China underperforming. If Chinese equities re-rate, a standard EM ETF with China exposure would likely outperform EMXC. This is a structural trade-off, not a prediction. Australian investors choosing EMXC are making an active choice about China exposure, not simply selecting a “safer” product.
| Country | Primary growth driver | Key risk | Presence in IAA / EMXC |
|---|---|---|---|
| India | GDP above 7%, manufacturing shift | Valuation stretch, INR volatility | EMXC only |
| Taiwan | AI/semiconductor super-cycle | Geopolitical risk, cycle peak | Both |
| South Korea | Memory chip rebound, value-up reforms | Export cycle sensitivity | Both |
| Singapore | Financials/REITs recovery, capital re-routing | Small market size, rate sensitivity | IAA only |
India’s GDP growth above 7% has been accompanied by corporate earnings strength across banking, IT, and industrials. Indian equities hit repeated record highs through late 2025 and early 2026. Production-linked incentive schemes and infrastructure improvements are supporting the “China+1” manufacturing shift, drawing global capital that feeds directly into EMXC’s returns.
The semiconductor super-cycle, centred on TSMC and AI/high-performance computing demand, has been the single largest performance driver for both ETFs. A relatively stable Taiwan dollar combined with high free-cash-flow yields in Taiwanese tech has attracted foreign inflows captured via ASX-listed Asia ETFs.
The AI capex cycle underpinning TSMC’s dominance in both IAA and EMXC is supported by combined 2026 capex guidance of approximately $725 billion from Microsoft, Google, Amazon, and Meta, but Morningstar analyst Dennis Li has identified an 18-24 month capex-to-revenue lag as the central structural risk, meaning the earnings that justify current semiconductor valuations are partially still ahead rather than fully recognised.
A rebound in DRAM and NAND pricing has lifted South Korean exporters, while the government’s “value-up” programme, encouraging higher dividends and buybacks, has improved the governance case for Korean equities and drawn foreign investors back to the Kospi.
Singaporean banks and REITs have recovered as rate expectations stabilised. Singapore is also attracting listings and asset-management inflows as capital shifts away from Hong Kong and mainland China, positioning the city-state as a growing beneficiary of regional capital re-routing.
The returns are the headline. The portfolio construction question is whether the conditions that produced them suit a given investor’s risk tolerance and time horizon.
The Stockspot ETF Report 2025 draws a clear distinction between the two:
Portfolio role: Stockspot classifies IAA as a “regional satellite” ETF, recommended tactically rather than as a core holding. EMXC is positioned as a potential “core building block” for investors managing China exposure separately.
Morningstar describes EMXC as a “sensible option” alongside a broad global ex-Australia ETF, rather than as a standalone global allocation. IAA is profiled as a “highly concentrated, large-cap Asia ex-Japan play” with a risk/return profile closer to a sector or factor allocation than a complete Asia allocation.
Before adding either fund, Australian investors should consider:
One practical advantage of the ASX-listed versions: AUD trading and simpler tax reporting for Australian investors compared to US-listed equivalents, as noted by Livewire Markets.
For investors new to international equity ETFs who want to understand the index classification mechanics, currency risk, and tax obligations before making an allocation decision, our dedicated guide to emerging market investing on the ASX covers how MSCI and FTSE Russell classify countries differently, why South Korea appears in some EM indices but not others, and what Australian investors must report to the ATO on foreign income from these funds.
This article is for informational purposes only and should not be considered financial advice. Investors should conduct their own research and consult with financial professionals before making investment decisions. Past performance does not guarantee future results.
IAA at 60.28% and EMXC at 43.33% over 12 months are among the strongest results on the ASX for the period, driven by identifiable forces: an AI-fuelled semiconductor super-cycle, Indian economic momentum, South Korean governance reforms, and the structural benefits of excluding China from an emerging-market allocation.
The ex-China thesis embedded in EMXC carries a genuine rationale, but it also carries its own trade-off. If Chinese equities re-rate, a standard EM ETF with China exposure would likely outperform. That is a structural choice, not a momentum trade.
The regional growth stories in India, Taiwan, South Korea, and Singapore have foundations that extend beyond the past 12 months: AI infrastructure demand, demographic tailwinds, and governance reforms. Concentration and currency risk, however, mean these funds reward investors who understand what they own.
Current holdings, fees, and performance data for both IAA and EMXC are available on the iShares Australia product pages. For investors evaluating whether the ex-China decision is appropriate for their portfolio, a direct comparison of EMXC against IEM and VGE is a practical starting point.
An ex-China emerging market ETF tracks an index that deliberately excludes Chinese equities, shifting the country weight toward markets like India, Taiwan, South Korea, and Brazil. Unlike a standard EM ETF such as IEM or VGE, which historically allocates 25-30%+ to China, an ex-China fund like EMXC gives investors direct control over their China exposure.
IAA's return was driven by three main forces: surging demand for Taiwanese semiconductors centred on TSMC and the AI infrastructure cycle, a recovery in South Korean memory chip pricing lifting Samsung Electronics and SK Hynix, and a stabilisation in interest-rate expectations that supported Singaporean bank and REIT valuations.
IAA (iShares Asia 50 ETF) charges a management fee of 0.50% per annum, while EMXC (iShares MSCI Emerging Markets ex China ETF) charges a lower fee of 0.25% per annum, a difference that compounds meaningfully over a multi-year holding period.
The key risks include sector concentration in IAA (heavy weighting to tech and financials), geopolitical risk around Taiwan, sensitivity to the semiconductor cycle, AUD strength reducing returns in Australian-dollar terms, and for EMXC, the structural trade-off that it would likely underperform a standard EM ETF if Chinese equities re-rate strongly.
Both IAA and EMXC are listed on the ASX and traded in AUD, removing the need for foreign-exchange brokerage. Australian investors must report foreign income distributions from these funds to the ATO, and ASX disclosure requirements mandate that issuers publish daily Net Asset Value per unit and portfolio composition for transparency.