
Ask an investor the day after a crash how they could have protected themselves, and most will have a clear answer. The strategies that answer that question exist right now, sit within reach of any brokerage account, and remain systematically underused.
Consider where valuations sit today. The Shiller CAPE ratio, a cyclically-adjusted price-to-earnings measure that smooths corporate earnings over ten years to strip out short-term noise, stood at approximately 40.6 as of September 2026. That places US equities in roughly the 98th-99th percentile of all readings since 1881, a height matched only by the final months of the dot-com peak.
The fiscal backdrop compounds the concern. US federal deficit spending is running near 6% of GDP, and net interest on the national debt hit $970 billion in FY 2025. The economic engine underpinning corporate profits is itself under measurable strain.
You do not need to predict a crash to act on this. What follows is a working map of the protection strategies professional investors actually use, what each one costs in calm markets, and how to think about which approach fits a portfolio like yours. The goal is to leave you knowing what to do, not just what to worry about.
Why the case for downside protection is unusually strong right now
Start with the price you are paying for stocks. A Shiller CAPE near 40.6 means investors are paying roughly forty times a decade of averaged earnings for the S&P 500. According to USMacro’s analysis of the ratio, readings this stretched have historically preceded a sharp drop in ten-year forward returns, with the closest parallel being the 1999-2000 period when valuations sat in the 99th-plus percentile.
Shiller’s historical CAPE dataset, maintained by Nobel laureate Robert Shiller at Yale, provides monthly readings stretching back to 1871, giving the percentile context that makes a reading of 40.6 meaningful rather than merely large.
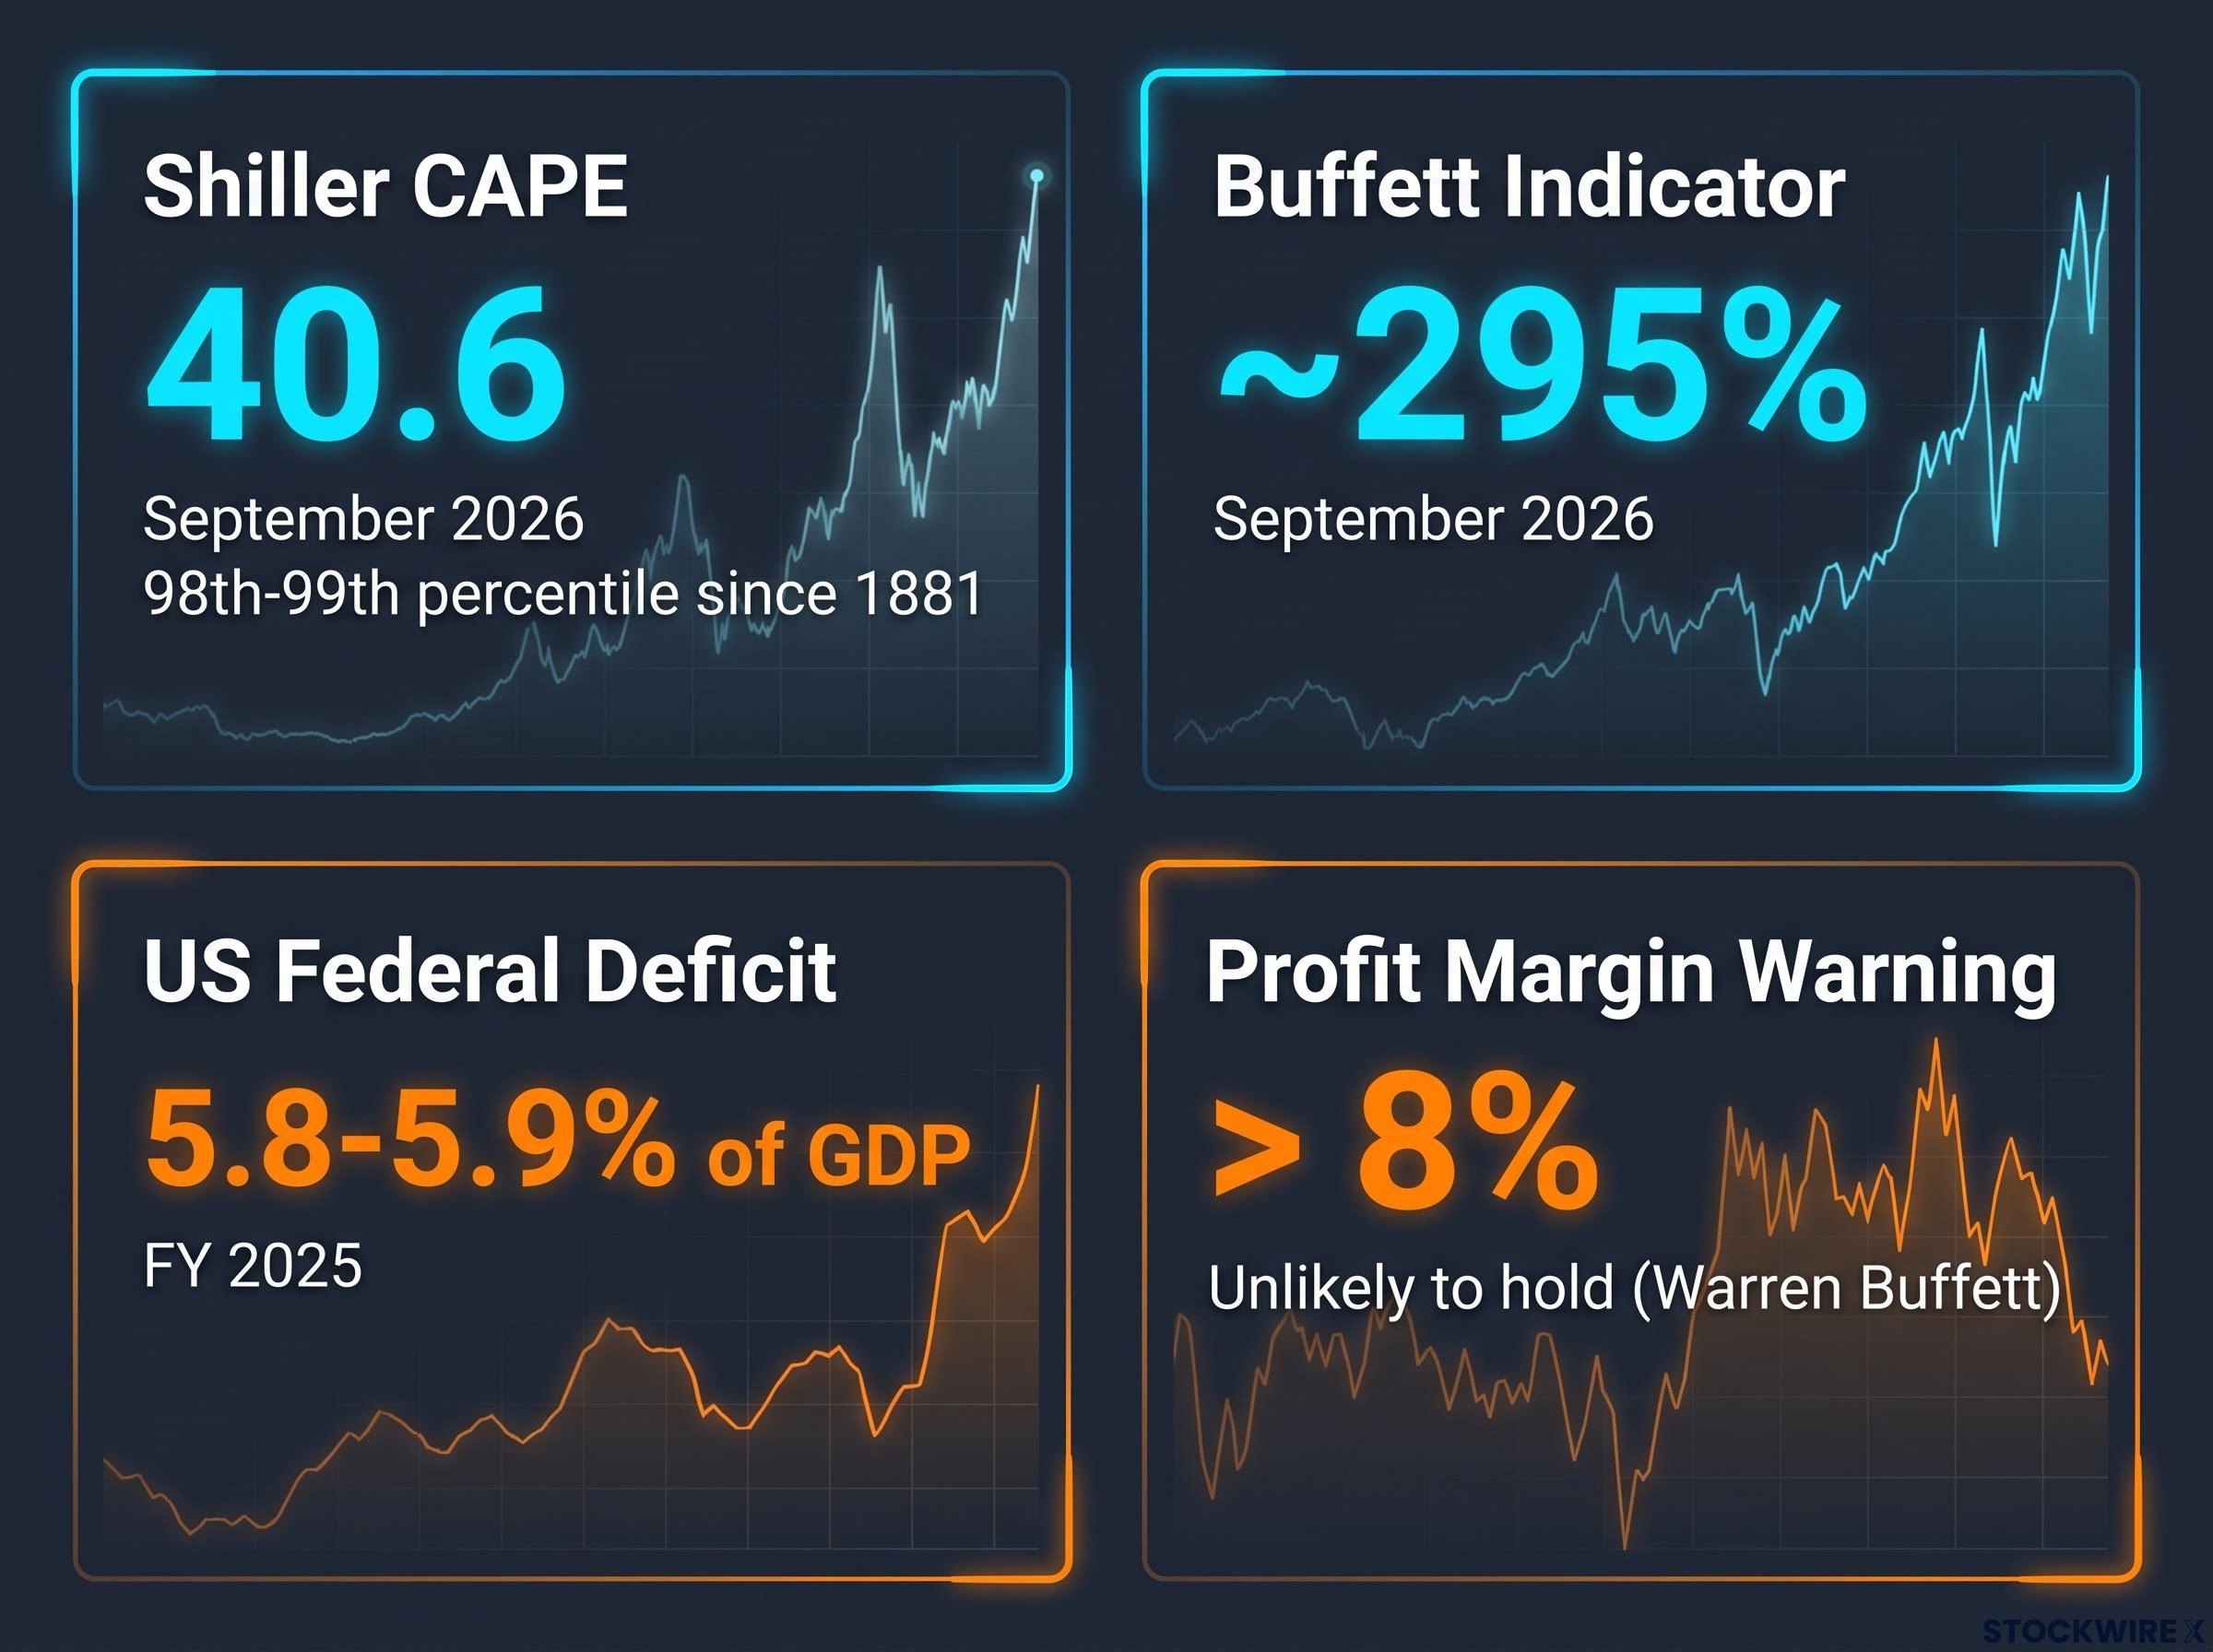
The Buffett Indicator tells a similar story from a different angle. This gauge compares the total value of the US stock market to the size of the economy (GDP), and readings vary by methodology. BuffettIndicator.org reported approximately 295% in early September 2026, while other providers using different definitions cited figures ranging from roughly 235% to 288% for the second quarter.
The methodological spread is worth naming honestly. Even at the most conservative reading, the indicator sits near or above levels seen before both the 2000 and 2021 bear markets.
The Buffett Indicator, the equity earnings yield spread against Treasuries, and the near-absence of margin-of-safety opportunities are three valuation signals for US equities that have converged simultaneously, a configuration that has historically preceded extended periods of below-average forward returns rather than brief corrections.
| Metric | Pre-2000 peak | Pre-2021 peak | September 2026 |
|---|---|---|---|
| Shiller CAPE | Prior cycle high | Prior cycle high | ~40.6 |
| Buffett Indicator | Prior cycle high | Prior cycle high | ~235-295% |
| US deficit (% of GDP) | Near balance | Pandemic-elevated | ~5.8-5.9% |
The fiscal engine underneath the earnings
Here is where the two concerns fuse into one. The Congressional Budget Office reported a $1.8 trillion federal deficit in FY 2025, equal to roughly 5.8-5.9% of GDP, well above the 50-year average of 3.8%. Net interest of $970 billion is projected by the Committee for a Responsible Federal Budget to more than double to approximately $2.1 trillion by FY 2036.
That borrowing does not vanish. GMO’s 2023 paper “The Curious Incident of the Elevated Profit Margins” argues that government deficit spending flows through the economy and inflates corporate earnings, meaning today’s record margins are partly a function of fiscal support rather than durable business strength.
GMO’s profit margin analysis uses the Kalecki Profits equation to show that US federal deficits accounted for more than double their historical average contribution to corporate earnings between 2012 and 2022, a finding that directly challenges the durability of the margins embedded in today’s equity valuations.
GMO’s core argument Elevated US profit margins are, in GMO’s framing, “fiscal deficit driven.” When the government stops running large deficits, the margins built on that spending become fragile.
Warren Buffett has long noted that profit margins persistently above 8% are unlikely to hold, since they imply the rest of the economy is overpaying. Ray Dalio, cited in the source material, estimates a US debt crisis could materialise within roughly three years, give or take two.
For you, the takeaway is not one alarming number but the way they stack. A valuation near dot-com extremes sits on top of profit margins that are partly borrowed from government spending. If both revert at once, you face not just a repricing but a simultaneous compression of the earnings underneath those prices. That is what makes protection worth pricing rather than dismissing.
When big ASX news breaks, our subscribers know first
How tail-risk hedging actually works, and what it costs
Open a professional’s brokerage statement during a market panic and you might see a small position that has multiplied several times over while everything else bleeds red. That position is usually built from out-of-the-money put options, and understanding why it behaves that way tells you most of what you need to know.
A put option gives you the right to sell an asset at a fixed price, called the strike. “Out-of-the-money” means the strike sits well below where the market currently trades. These contracts cost relatively little in calm conditions, carry a fixed maximum loss (the premium you paid), and pay off sharply if the market falls through the strike.
Institutions build this into a defined structure. Resonanz Capital and Parabellum Advisors describe a dedicated “tail-risk sleeve” of roughly 2-5% of portfolio value, holding deep out-of-the-money index puts at 10-20 delta alongside VIX calls, rolled on a mechanical schedule. The design is not to predict the timing of a crash but to be present when one arrives.
Broadly, there are three ways to run this:
- A dedicated sleeve of long-volatility or option positions held at all times.
- A dynamic overlay scaled up or down as valuations and risk indicators shift.
- Embedded convexity through managed-futures or long-volatility funds.
Each suits a different temperament and level of hands-on management.
The real cost of staying unhedged versus staying hedged
Protection is not free, and the cost has a name: premium bleed. HL Hunt Financial’s analysis quantified it as approximately 1.1% per year in return drag over a 15-year period, in exchange for a 43% reduction in maximum drawdown.
That trade sits at the heart of the decision. For retail investors, Equicurious suggests budgeting roughly 1-2% of portfolio value annually for a program of out-of-the-money puts and VIX calls, while professionally structured institutional programs run nearer 0.5-1% of net asset value per year, per Resonanz Capital.
The convexity in numbers Mark Spitznagle’s tail-risk strategy reportedly generated around 4,000% during the 2020 market event. This reflects an extreme tail outcome, not a typical year, and should be read as an illustration of convexity rather than an expectation.
The 1.1% drag is best understood as an insurance premium, not a flaw. You are paying a small, steady cost for a contract that pays out precisely when everything else in your portfolio is falling at once. That reframing matters, because the most common failure is behavioural: buying protection after a sell-off when premiums are expensive, then cancelling it before the next event when it finally turns cheap.
The discipline Equicurious recommends is mechanical rolling, quarterly for index puts and monthly for VIX options, without skipping based on short-term optimism. The Cboe’s 2024 whitepaper adds a caution worth heeding: poorly understood options positions can create exposures you did not intend, so complexity here should be matched to your genuine level of comfort.
For readers who want to understand how to choose between the two instruments before sizing a tail-risk sleeve, our dedicated guide to VIX calls versus SPX puts covers contango drag, roll costs, and the specific market conditions under which each instrument outperforms the other.
Value investing and margin of safety as a lower-complexity alternative
Not everyone wants to run an options program, and you do not have to. There is a form of downside protection built directly into how you select what you own, and it carries the same protective intention as a hedge, just executed differently.
The concept is margin of safety: buying a business at a price meaningfully below your estimate of its intrinsic value. When you do that, you have priced in a disappointing outcome before it arrives rather than after. The bad news is already in your purchase price.
A margin-of-safety valuation framework calibrates the required discount to business quality: high-moat, predictable businesses typically warrant a 30% discount to intrinsic value, while cyclical or leveraged firms require 40-50%, a spread that directly reflects the range of outcomes in the earnings compression scenario the current environment presents.
Now contrast that with holding a broad market index fund at forty times CAPE. At that price, the margin of safety is not merely thin. It is inverted, because the valuation already assumes the best-case scenario continues indefinitely, demanding years of above-average earnings growth with no compression in the multiple you paid.
In practice, a value tilt favours specific characteristics:
- Conservative capitalisation, meaning low or manageable debt.
- Predictable owner earnings, Buffett’s concept of cash generated after the spending needed to maintain the business.
- Normalised rather than peak-cycle earnings used as the valuation base.
- A meaningful discount to your estimate of intrinsic value.
- Business quality able to survive a squeeze on profit margins.
Both GMO and PIMCO identify quality and value tilts as the preferred lower-complexity route for investors who will not run derivatives. The source material points to Asian equities and select large-cap technology names such as Meta and Amazon as potentially offering better relative value than the broad US market at current prices.
Buffett’s 8% line Warren Buffett has argued that profit margins persistently above 8% are unlikely to be sustainable. If your earnings model anchors to 2024-2025 margins, this is a direct warning that those figures may not hold, and your valuation base could be too generous.
Even a defensive stalwart carries this logic. Berkshire Hathaway is noted in the source as relatively defensive, but with its safety premium already reflected in the price, implying roughly 5-6% annualised returns from here. Defensive does not mean cheap, and cheap is where your protection actually comes from. Academic research cited in the source adds that once government debt-to-GDP passes roughly 80%, additional borrowing begins crowding out productive investment, a headwind relevant to any US earnings model you build.
Building a portfolio that can survive what you cannot predict
Each strategy so far solves a different problem. The point is not to choose one but to see how they fit together into a single construction, because each component is doing a distinct protective job at a different part of the risk distribution.
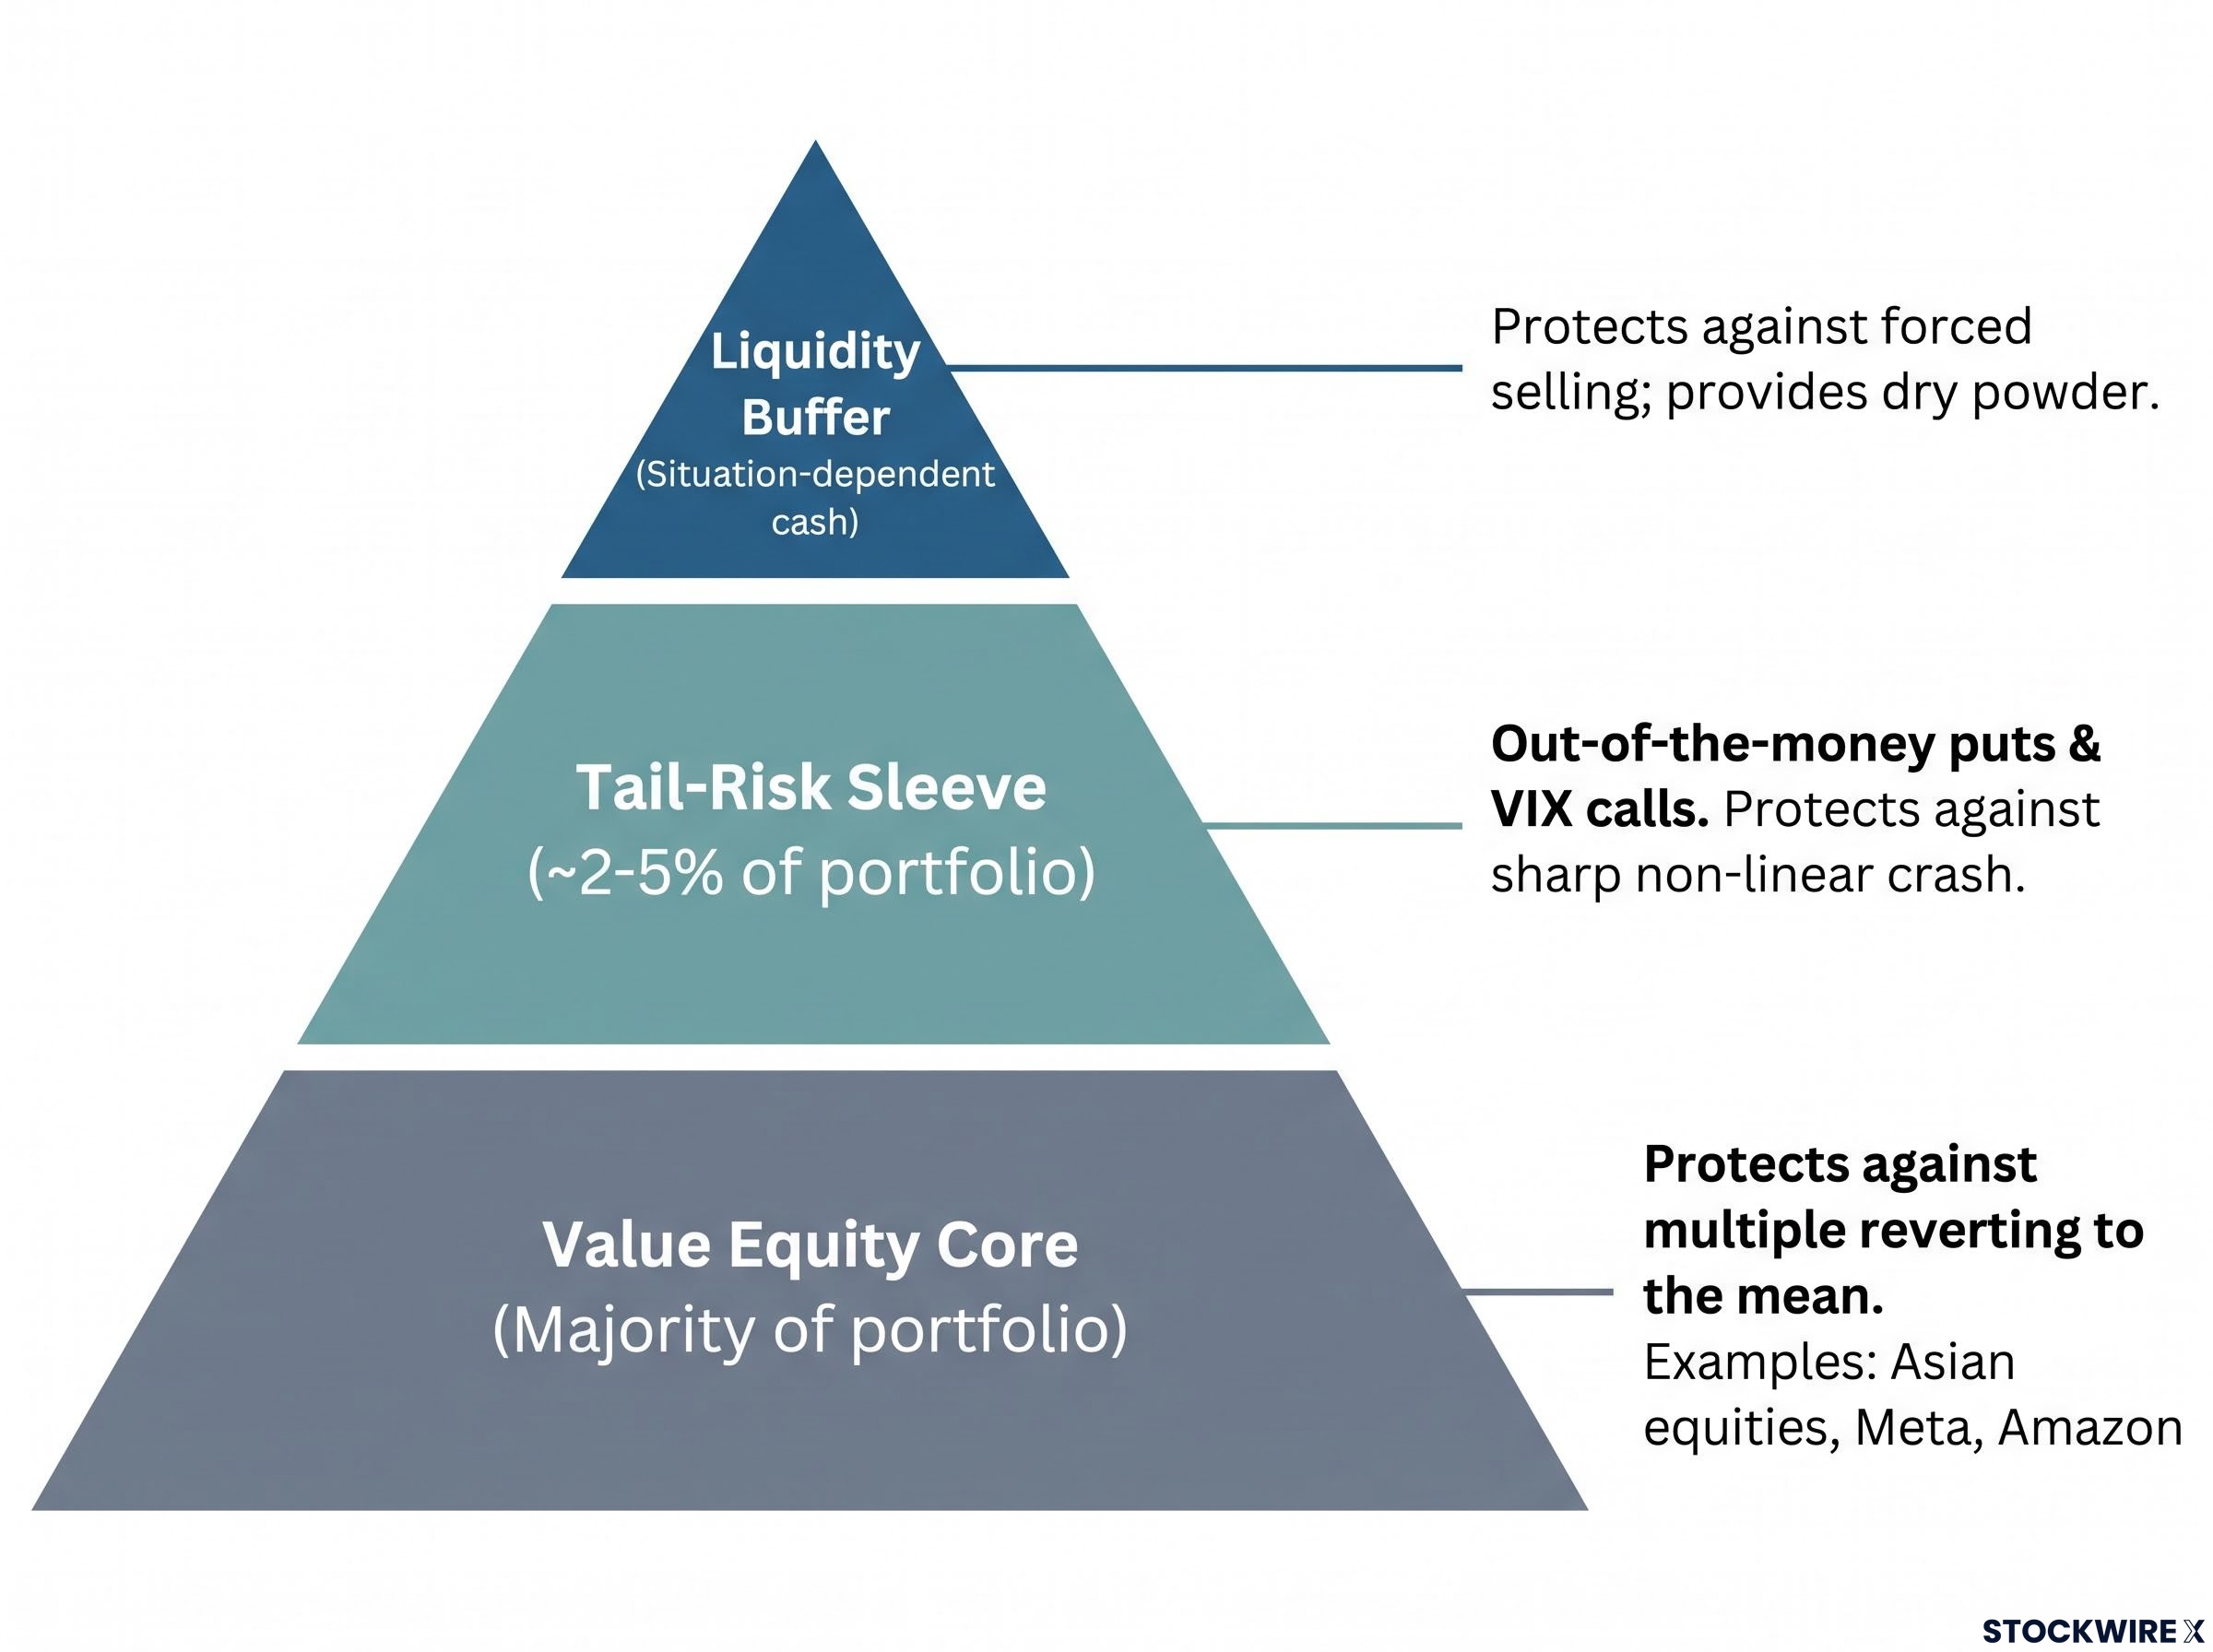
The integrated picture has three layers. A core of quality and value equities selected with margin-of-safety discipline. A tail-risk sleeve of roughly 2-5% in out-of-the-money puts and VIX calls, rolled mechanically. And a liquidity buffer in cash or short-duration assets so you are never a forced seller and always have capacity to buy.
Why does the combination matter more than any single piece? Because they cover different failure modes. Value selection protects against elevated multiples reverting toward their average. The tail-risk sleeve protects against a sharp, non-linear crash. The cash buffer protects against being forced to sell at the bottom while giving you the dry powder to buy dislocated assets.
| Component | What it protects against | Approximate sizing | Cost in a rising market |
|---|---|---|---|
| Value equity core | Multiple reverting to the mean | Portfolio majority | Lags momentum-driven rallies |
| Tail-risk sleeve | Sharp non-linear crash | ~2-5% of portfolio | ~1-2% annual premium bleed |
| Liquidity buffer | Forced selling; missed buying | Situation-dependent cash | Opportunity cost in a bull run |
This convergence is not one commentator’s view. GMO, PIMCO, Graham Capital and Resonanz Capital all arrive at similar multi-layered frameworks, and the underlying principles line up:
- Margin-of-safety equity selection favouring firms that can sustain earnings under stress.
- Dry powder and liquidity to buy dislocations rather than sell into them.
- A convex tail-risk sleeve designed to monetise volatility spikes.
- Scepticism toward extrapolating peak, fiscally-supported profit margins.
- Disciplined hedging budgets combined with genuine diversification.
The ECB’s November 2025 Financial Stability Review reinforces the last point, flagging “stretched valuations in increasingly concentrated asset markets” as a systemic vulnerability. Diversifying away from that concentration is itself a protective act.
The discipline this demands is real, and you should expect discomfort by design. The tail hedge will look like waste in every year the market climbs. The value tilt will trail a momentum rally. The cash will feel like a drag in a bull run. Yet the source presenter reports an eight-year annualised return of roughly 15%, matching the S&P 500 total return over the same window, achieved with a construction built to survive severe downturns. Protection, in other words, did not cost long-term compounding.
Once you see each layer doing a separate job, the question stops being which strategy to pick and becomes how to size each one for your horizon, tolerance and existing holdings.
The protection you build before you need it
Return to the paradox this piece opened with. Protection works precisely because it is in place before the event, not assembled in the panic afterwards. A Shiller CAPE in the 98th-99th percentile does not tell you when, but it does tell you that building your position now beats waiting for a signal that only arrives once the damage is done.
The decision in front of you is one of sizing. How much value selection, how large a tail-risk sleeve, how deep a cash buffer, calibrated to your own time horizon and risk tolerance. Resonanz Capital’s guidance is worth holding onto: build the hedge when implied volatility is cheap, driven by cost rather than fear or market direction.
The discipline that makes it work Holding protection that looks wrong in calm markets is exactly what lets you act decisively when markets are not calm.
Acting on this framework is not a bet on a crash. It is the removal of the scenario where a crash forces you into decisions you would never make from a position of strength. The investor who can tolerate a lagging hedge, a value tilt out of step with the rally, and a cash position that drags in a bull run is the one positioned to compound through a downturn rather than merely recover from it.
For readers wanting a concrete checklist to act on immediately, our comprehensive walkthrough of crisis portfolio preparation covers the four-question diagnostic framework, liquidity buffer sizing, and rules-based rebalancing triggers that convert the case for protection into specific, executable steps.
This article is for informational purposes only and should not be considered financial advice. Investors should conduct their own research and consult with financial professionals before making investment decisions. Past performance does not guarantee future results. Financial projections are subject to market conditions and various risk factors, and forward-looking statements are speculative and subject to change based on market developments.