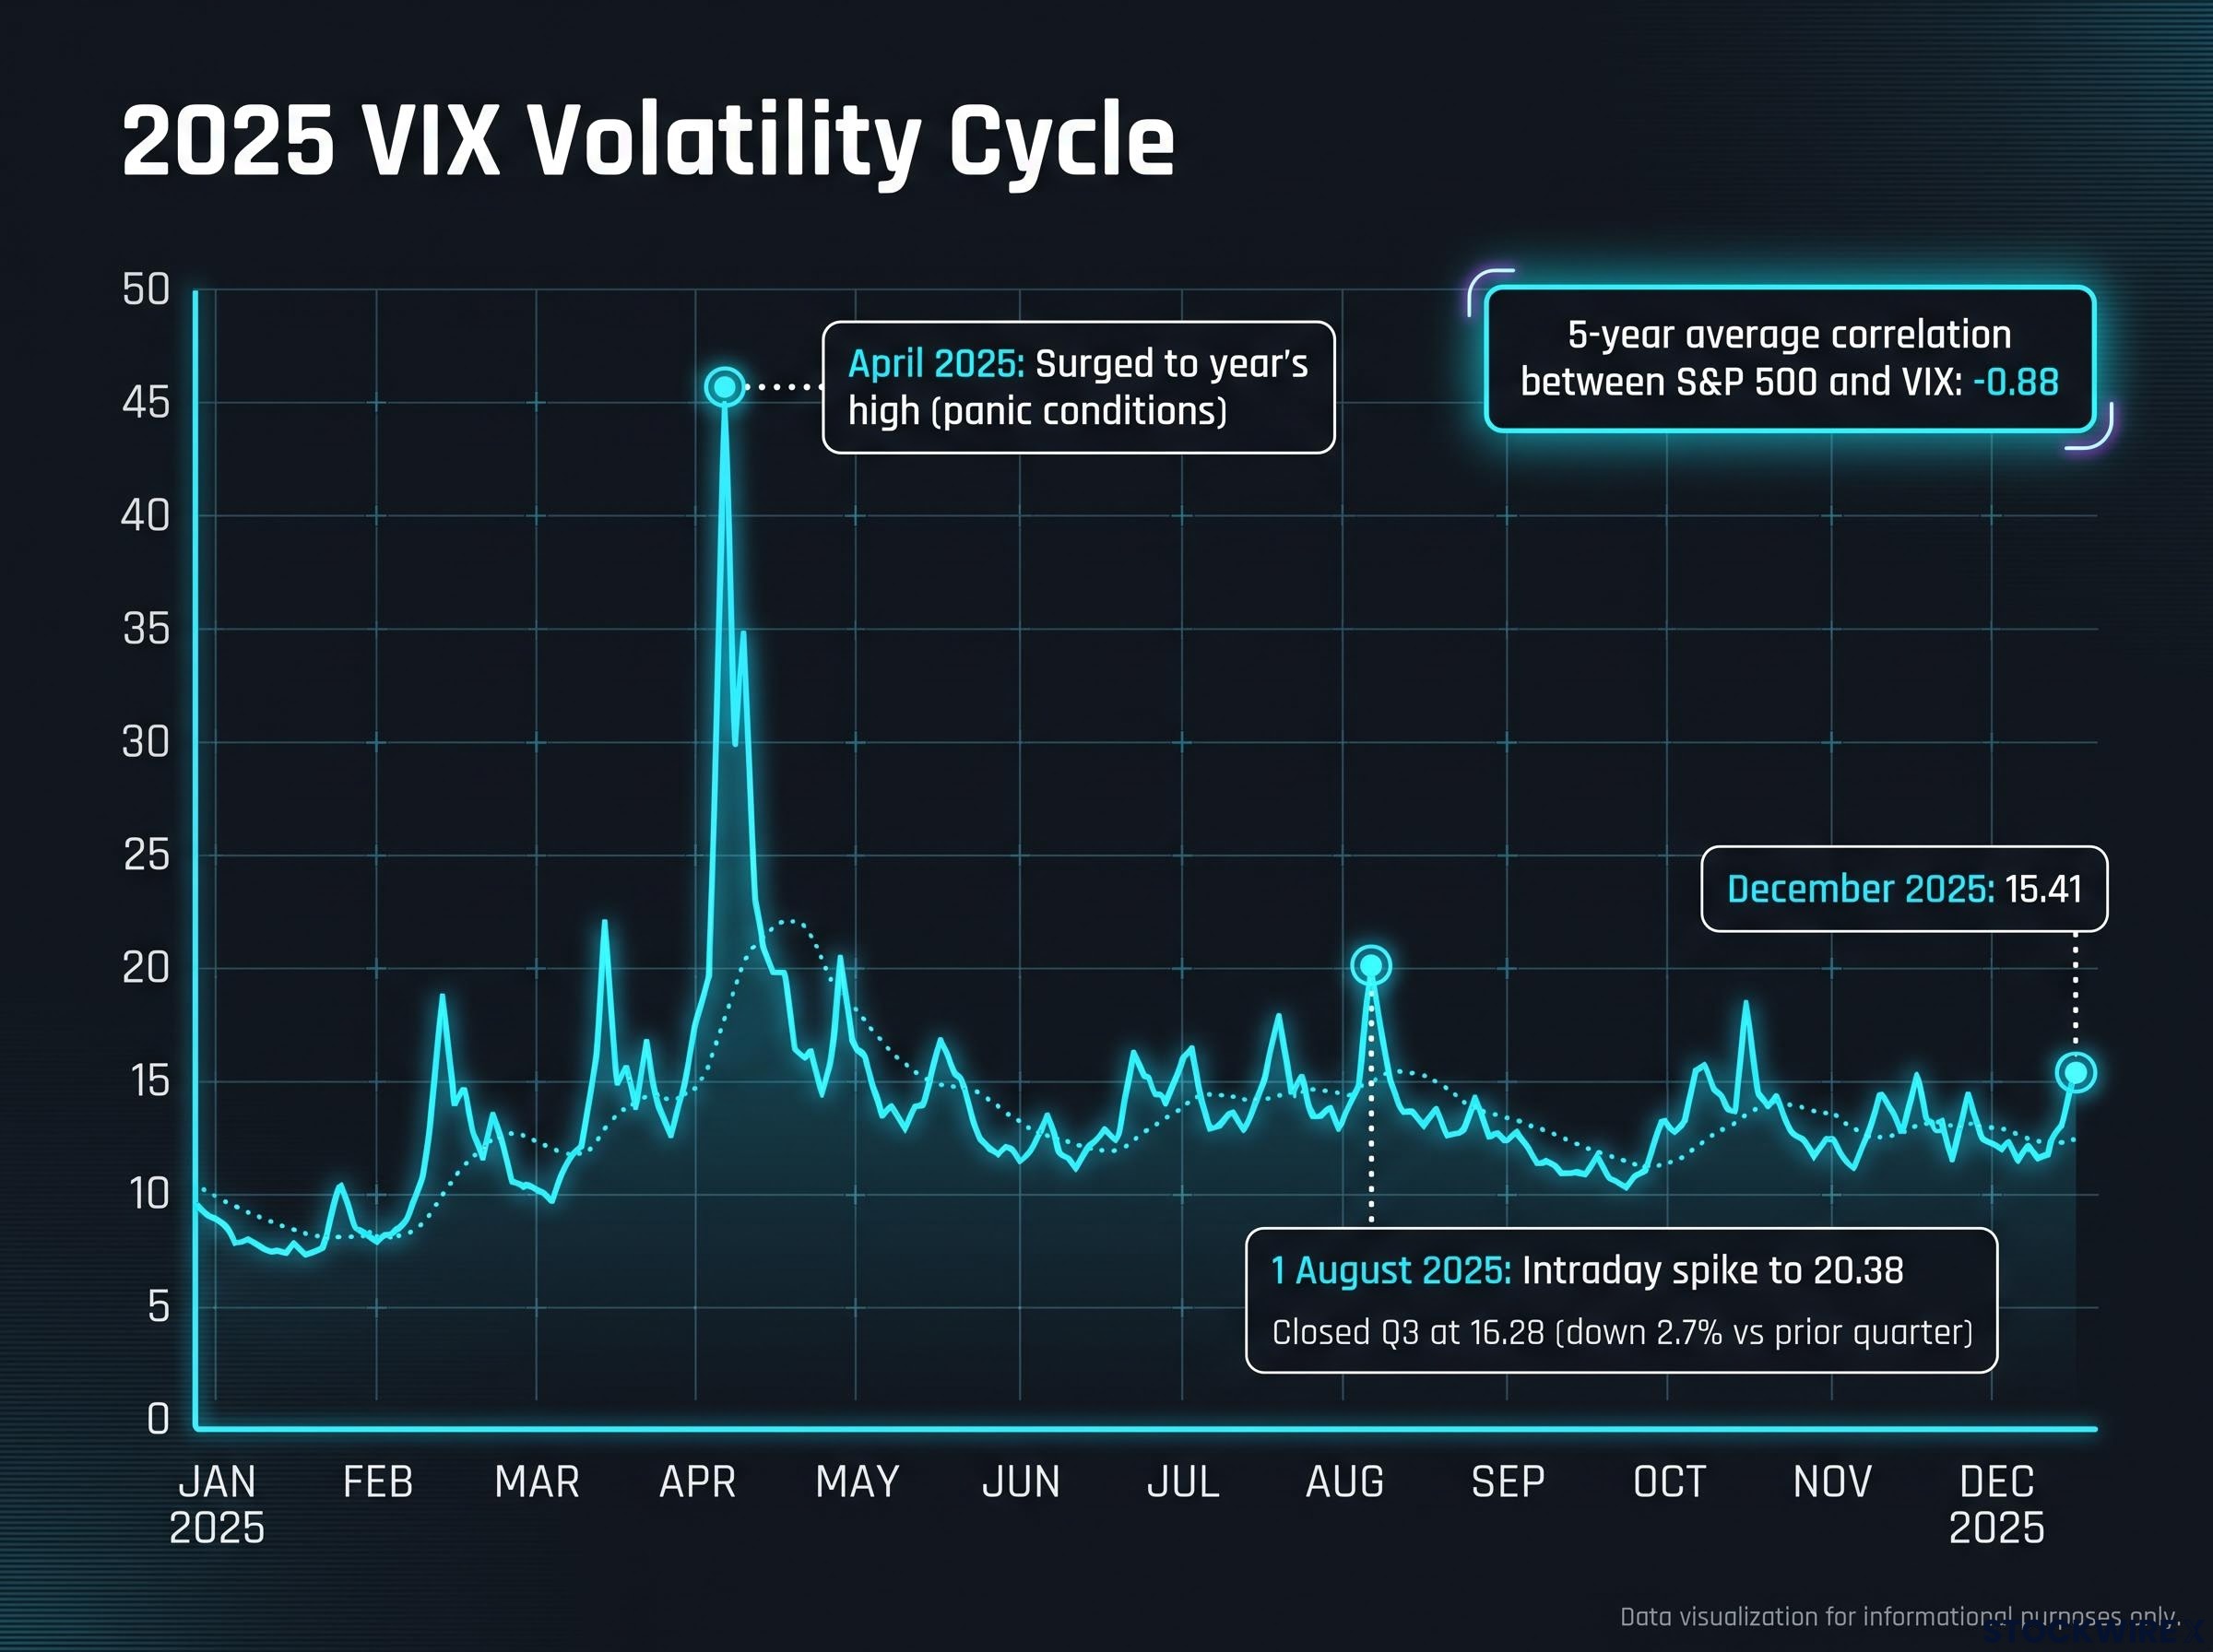
The Cboe Volatility Index (VIX) is sitting in the mid-teens as of December 2025, with the S&P 500 volatility gauge at roughly 15.41. On the surface, that reads as calm. Global equity markets look composed, and headline fear is nowhere to be found.
That calm is exactly what makes it dangerous. In a macro environment shaped by currency debasement and central bank intervention, a low VIX does not mean risk has disappeared. It means the market is under-pricing it, and the traders who understand this are quietly buying protection while it is cheap.
This is where options strategies for volatile markets earn their place. Here is the framework for building protective trades using spreads and hard assets, so you can hold through market turbulence without bleeding your capital dry while you wait for the storm to arrive.
Structural vulnerabilities in a low volatility regime
The quiet of December 2025 is not the same as safety. The VIX near 15.41 reflects a market that has stopped pricing systemic risk, not one that has resolved it.
Rewind through the current cycle and the pattern is jagged, not smooth. On 7 April 2025, the VIX surged to its highest level of the year during a global equity rout that Bloomberg described as panic. Then it compressed. On 1 August 2025, a sharp downward revision to US payroll data pushed the VIX to an intraday spike of 20.38, before it closed the third quarter at 16.28, down 2.7% versus the prior quarter.
That is the rhythm of this market: brief bursts of fear, followed by renewed calm as equities climb back. The five-year average correlation between the S&P 500 and the VIX sits at -0.88, confirming that rising markets and falling volatility move together almost mechanically.
The $1.5 trillion in short-volatility exposure from systematic strategies and structured product issuers that are manufacturing low VIX warning signals are a central reason the current calm is mechanically engineered rather than genuinely earned, a distinction that shapes how aggressively you should be acquiring protection right now.
The macro thesis driving professional positioning runs underneath all of this. Cem Karsan of Kai Wealth frames the coming period around currency debasement and large-scale government balance-sheet expansion, a setup he expects to end with government equity buying that traps short sellers and triggers a sharp reversal.
Karsan makes one distinction that matters for how you position. He cautions against treating bond volatility as a standalone trade, because quantitative easing (central banks buying bonds to suppress yields) is likely to cap any volatility spike in that channel. That pushes the real opportunity into equities and foreign exchange.
The table below shows why waiting for headline news to buy protection is a mistake. The spikes were violent but short-lived, and each one compressed before most retail buyers could react.
| Event | VIX Reading | Outcome |
|---|---|---|
| April 2025 equity rout | Year’s high (panic conditions) | Compressed as equities recovered |
| August 2025 payroll shock | Spiked to 20.38 | Closed Q3 at 16.28 |
| December 2025 baseline | 15.41 (mid-teens) | Systemic risk under-priced |
The suppressed VIX tells you something useful: this is a rare window to acquire cheap protection, provided you structure it so time does not eat you alive first.
When big ASX news breaks, our subscribers know first
The hidden cost of volatility bleed
If you have ever bought a put option to protect a position, watched nothing happen, and then watched that put slowly rot to nothing, you have already met the problem this section solves.
The culprit is theta, or time decay. Every option loses value as it approaches expiration, and it does so at an accelerating rate. The closer expiration gets, the faster the value drains, which is why simply buying protection and waiting is a losing posture when the crisis is late.
This is what practitioners call volatility bleed: the daily erosion you suffer while the anticipated macro event fails to show up on schedule. The August 2025 episode illustrates it perfectly. Anyone who bought volatility at the 20.38 spike watched it mean-revert to 16.28 over the following weeks, a material loss for holding the trade a few weeks too long.
Raw tail hedges make this worse, not better. Individual out-of-the-money contracts can carry extreme implied volatility: an example from the TLT options chain showed a 65-strike put pricing near 137.5% implied volatility. Buying that kind of insurance means paying a fortune for protection that decays almost entirely if the feared shock never lands.
The extreme end of this spectrum is the zero-days-to-expiration contract, where theta decay runs so fast it can be measured intraday. That is time decay in its purest, most punishing form.
There is one more layer worth understanding: the volatility term structure. When near-term fear is high, short-dated options price richer than longer-dated ones, meaning the market charges you more for immediate protection than for protection further out.
Here are the specific ways long volatility trades fail:
- Vol crush: After an event passes, implied volatility collapses across the board, dragging down every long option you hold.
- Path dependency: A straddle or put needs the underlying to move far enough and fast enough to overcome the premium paid. A move that is too small or too late leaves you with nothing.
- Timing delays: If the macro event arrives after your short-dated option has already expired, you have paid the decay and captured none of the payoff.
You must treat time as an active headwind. Buying standard hedges means paying a daily premium just for the privilege of waiting, and that is the single most common way self-directed investors turn a correct thesis into a losing trade.
Funding your hedges with calendar spreads
The fix for time decay is not to fight it. It is to sell it to someone else.
A calendar spread does exactly that. You sell a near-term option to collect fast time decay, and you simultaneously buy a longer-dated option at the same strike to hold your macro view. The short leg bleeds quickly in your favour; the long leg decays slowly and keeps your thesis alive.
This structure exploits the volatility term structure directly. You sell the expensive short-term premium and use the proceeds to finance the cheaper long-term optionality, flipping theta from a drain into a funding mechanism that pays you to wait.
The same calendar spread construction logic applies when near-term implied volatility runs 1.5x to 3x higher than back-month options before earnings, a differential that mirrors the term-structure opportunity this article describes for macro crisis windows and makes the front-to-back IV ratio the critical go/no-go threshold before entering any calendar trade.
The table below breaks down the two legs and what each one does for you.
| Leg | Expiration | Theta Impact | Strategic Purpose |
|---|---|---|---|
| Short leg (sold) | Near-term | Rapid decay works in your favour | Collects premium to fund the hedge |
| Long leg (bought) | Longer-dated | Slow decay preserves value | Holds the macro view over the crisis window |
The net effect is a position with far smaller theta drag than a single long option, and in some cases even positive net theta. That is the mechanical bridge between the bleed problem and the solution.
Real-world application
The iShares 20+ Year Treasury Bond ETF (TLT) shows how this plays out in long-duration bonds. As of September 2026, TLT traded around $81.79 with aggregate implied volatility near 15.43%, a level that makes longer-dated optionality reasonably priced.
During a live broadcast, one host disclosed building TLT call positions across January 2026, January 2028, and January 2029 expirations, buying three additional contracts at the 90 strike for $2.80 each. The rationale was a multi-year mean-reversion trade based on TLT sitting near multi-decade price lows, and the far-dated expirations give that thesis room to play out.
Karsan’s own framework favours March or June expirations of the following year for the long leg, with June preferred for the extra safety margin it provides over a six-month crisis window.
The logic travels across asset classes. The same broadcast covered a corn calendar spread, a long November 520 put financed by short October 505 puts, both tied to the December futures contract, before it was closed following a decline in corn prices.
By selling short-term premium to fund your long-dated hedge, you buy yourself months of protection without the catastrophic bleed that sinks most standing tail hedges.
Evolving the trade with diagonals and straddles
A calendar spread is a defensive tool. But once your conviction shifts from “something will break” to “here is the direction,” you can evolve the trade into something that actually profits from the move.
That evolution is the diagonal spread. It works like a calendar, except the long and short legs sit at different strikes as well as different expirations, which introduces directional exposure (delta) while keeping the time-decay benefit intact.
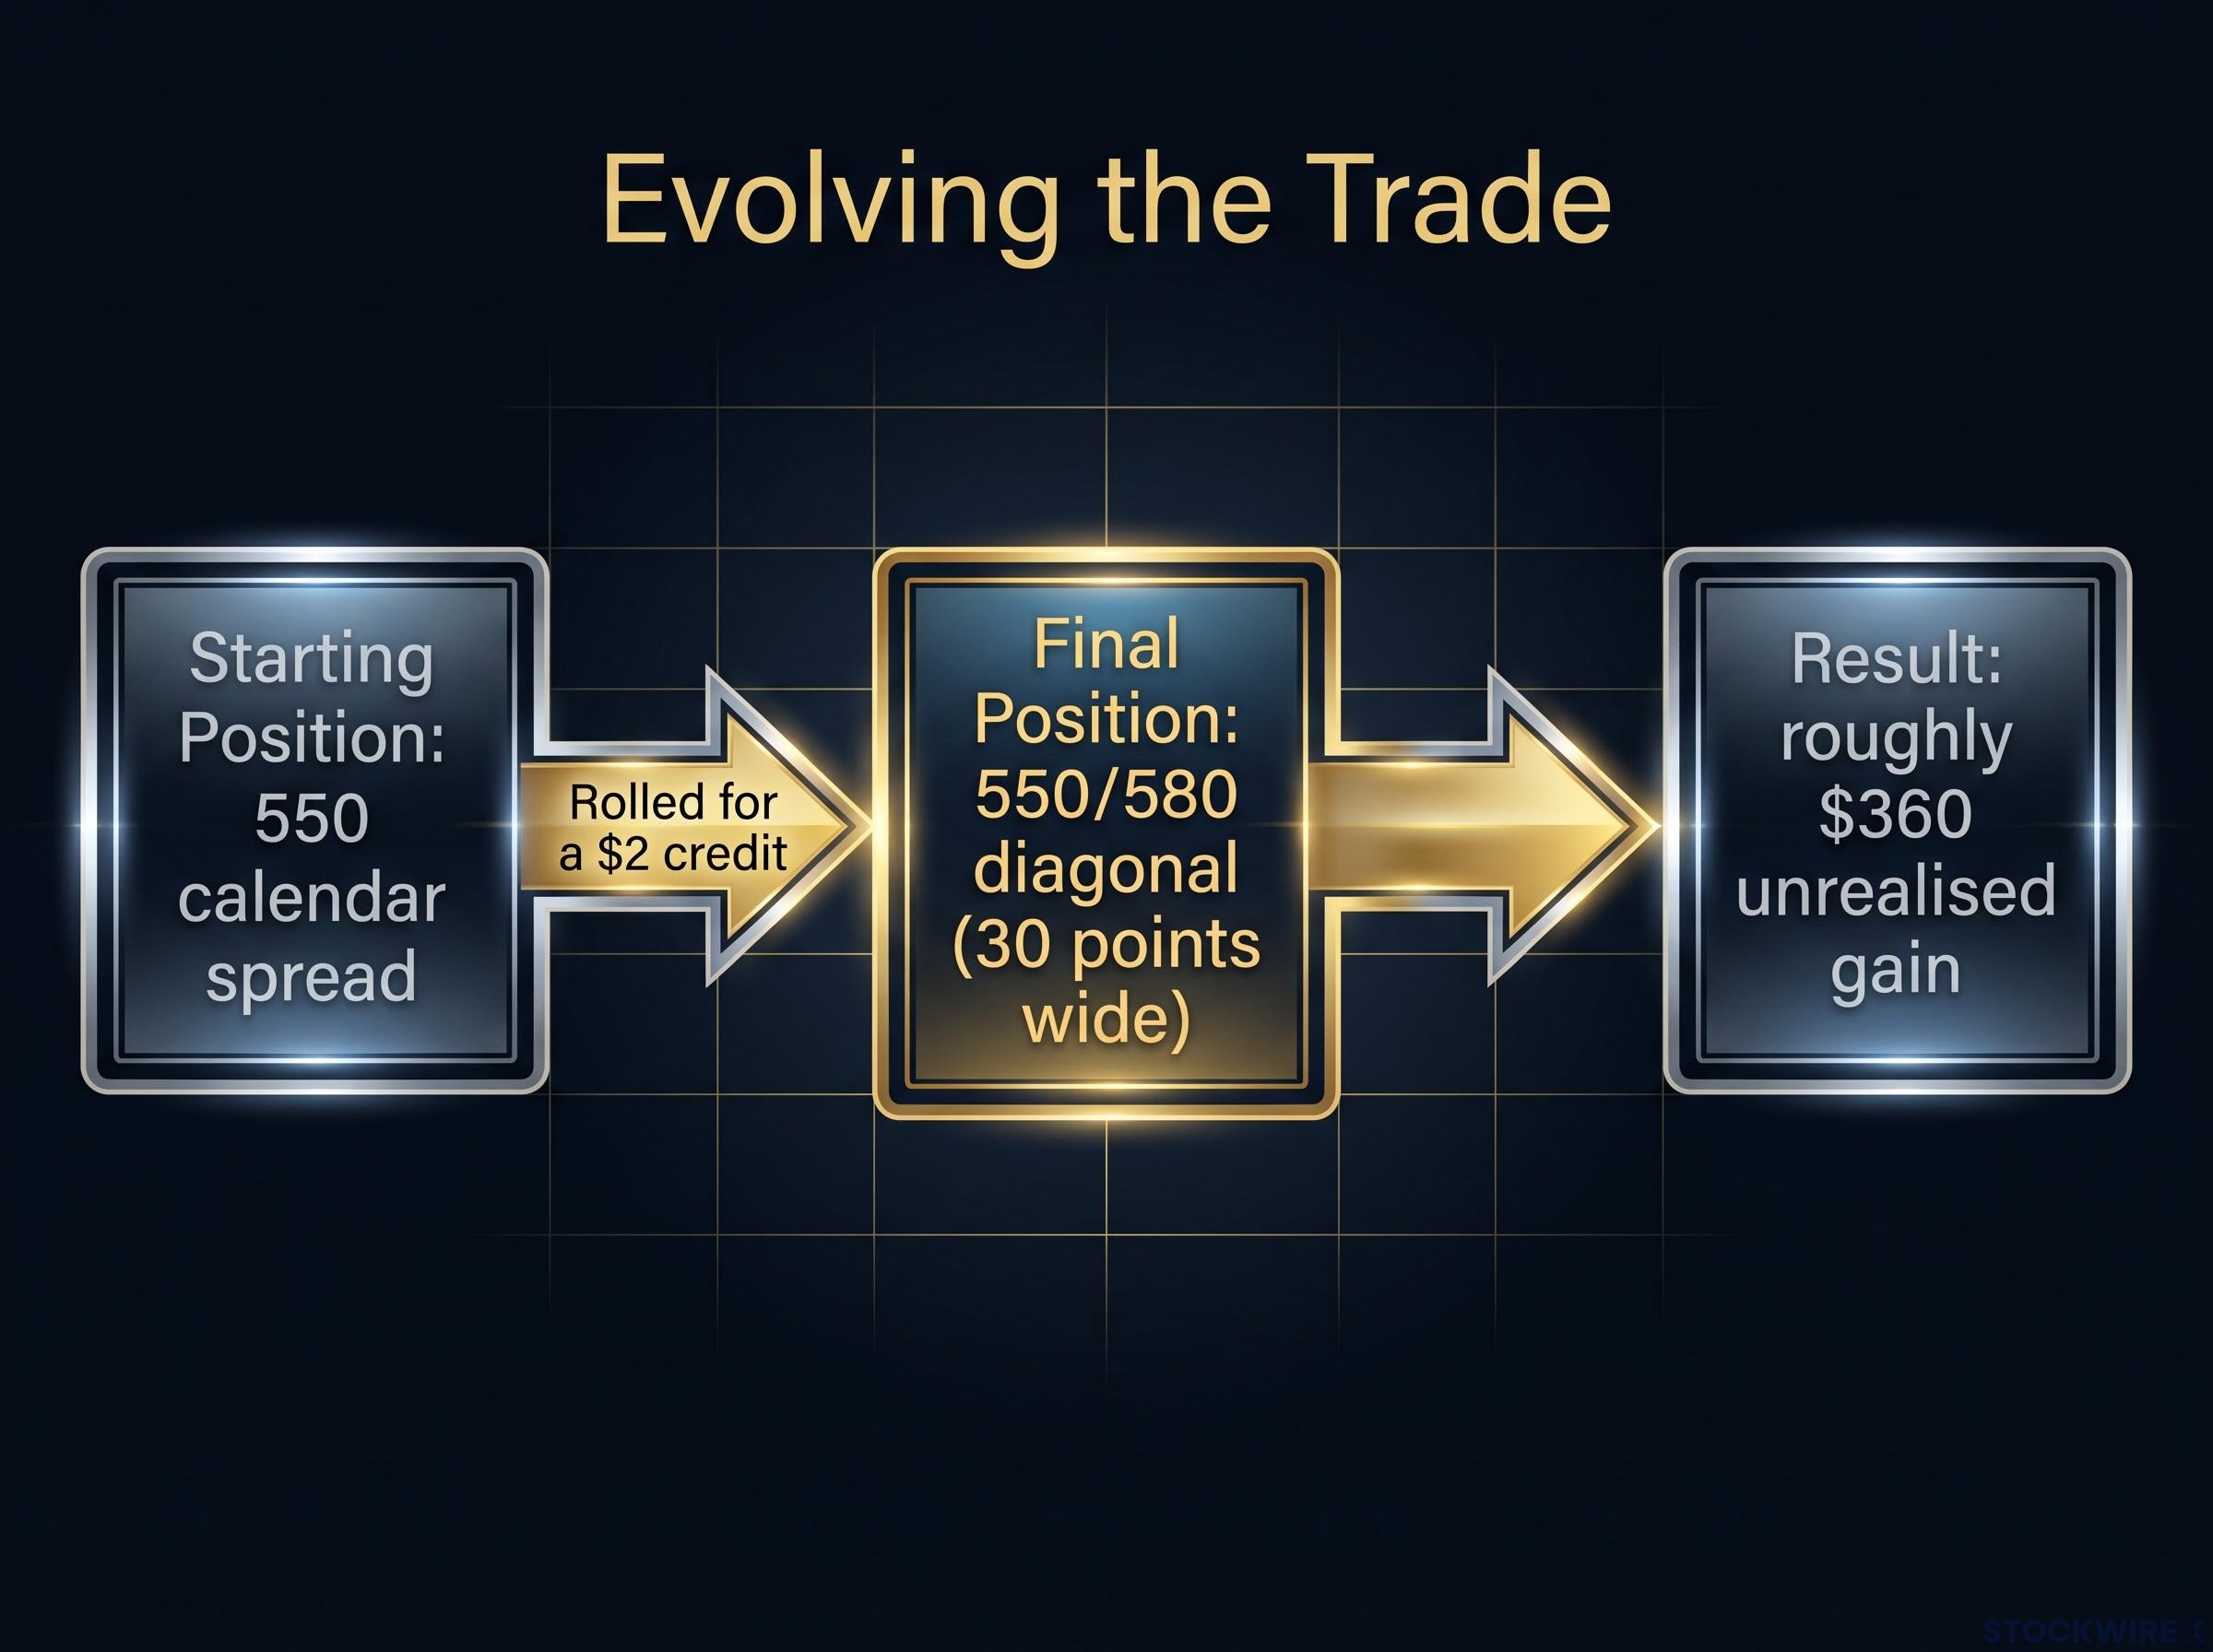
The Microsoft position from the broadcast shows the mechanic in action. A 550/580 diagonal, 30 points wide, began life as a 550 calendar. The host rolled it and converted it to a diagonal for a $2 credit, and by the time of the broadcast it showed an unrealised gain of roughly $360.
Here is how that conversion works, step by step:
- Start with a calendar spread, both legs at the same strike, positioned for mean reversion.
- Watch for a directional trend to establish itself in the underlying.
- Roll the long leg to a strike closer to the anticipated move, creating the diagonal.
- Capture a credit on the adjustment where possible, as the Microsoft roll did.
- Hold the reshaped position, which now profits from trend plus controlled volatility rather than pinning around a single strike.
Adjusting the strikes changes your risk profile in specific ways. Moving the short leg further out-of-the-money lowers your assignment risk (the chance of being forced to exercise early), while the shift also rebalances your vega and theta toward a blend of price trend and time decay.
Straddles occupy the other end of the spectrum. Buying a call and a put at the same strike captures a sudden volatility shift regardless of direction, but only if your timing is precise. The Intel 130-strike November straddle profited on a down day for the stock, a roughly $114 gain that came from the earnings-related implied volatility cycle pulling volatility into an earlier expiration than expected.
You can turn a neutral crisis hedge into a directional profit engine once a trend becomes clear, capturing upside without ever taking on outright stock risk. That is what active management looks like across a volatile cycle: not setting a trade and hoping, but reshaping it as conviction builds.
Multi-leg position management under pressure follows a three-step filter: identify which risk is no longer acceptable, find the smallest mechanical action that removes it, and execute without anchoring to entry price or theoretical expiration profit, a discipline that becomes especially critical when rolling a diagonal after the directional trend has shifted.
Anchoring portfolios with hard assets and currencies
Derivatives protect you against sudden shocks. They do nothing about the slow, grinding erosion of purchasing power that a debasement cycle inflicts, and for that you need something that does not expire.
The transmission logic is straightforward. Large-scale money creation, persistent fiscal deficits, and yield-curve control (central banks pinning bond yields at chosen levels) reduce the real value of cash and nominal bonds, pushing capital toward assets that represent claims on real resources rather than paper units.
Gold and strong foreign currencies sit at the centre of this rotation. Karsan highlights gold and the Swiss Franc as preferred stores of value, both entering and exiting the anticipated crisis, with the Franc favoured because Switzerland’s credible monetary policy and current-account surplus make it a hedge against weakness in heavily leveraged sovereigns, including the US dollar.
Gold’s roughly 10% surge in August 2026 to near $4,436 per ounce, alongside Bitcoin’s 90-day correlation with gold climbing above 50%, shows how debasement trade dynamics have shifted from crisis hedge to structural portfolio position, directly validating the hard-asset allocation framework this article recommends alongside options protection.
Leveraged real estate with long-term fixed-rate debt rounds out the framework. The practitioner view is counterintuitive: holding real estate without leverage is actually the riskier posture during intense debasement, because fixed-rate debt lets you inflate away your liabilities as the currency weakens.
The macro thesis points to mid-2026 as the resolution window for the anticipated liquidity crisis, which frames how long these anchors need to hold.
None of this is without risk. The main limitations to weigh:
- Real yield headwinds: If real interest rates rise, non-yielding assets like gold can underperform even as debasement fears persist.
- Correlation instability: The relationship between gold, the dollar, and inflation is not fixed, and hedges can fail if everything sells off together in a risk-off episode.
- Foreign policy risk: Relying on the Swiss Franc introduces foreign monetary policy and intervention risk, as central banks can lean against their own currency’s strength.
While options guard your portfolio against sudden market shocks, physical assets and strong foreign currencies guard your actual purchasing power against the slow bleed of government money printing. You need both.
Synthesising a resilient portfolio across asset classes
The pieces are not separate bets. Calendar spreads, diagonal adjustments, and hard-asset allocations form a single system, each covering a weakness the others cannot.
The calendar spread solves your short-term problem: staying hedged through a six-month crisis window without the theta bleed that destroys standing tail positions. The diagonal lets you convert that defence into offence once direction becomes clear. Gold, the Swiss Franc, and leveraged real estate anchor the whole thing against the slower erosion no option can address.
Survival in this environment does not come from guessing market direction correctly. It comes from capital efficiency and disciplined time-decay management, structuring trades so that waiting costs you as little as possible.
The practical next step is to review your current hedges and strip out the inefficient, high-theta positions. Any protection that bleeds you daily while you wait is a candidate for restructuring into something that funds itself.
This article is for informational purposes only and should not be considered financial advice. Investors should conduct their own research and consult with financial professionals before making investment decisions. Past performance does not guarantee future results. Financial projections are subject to market conditions and various risk factors, and forward-looking statements are speculative and subject to change based on market developments.