Most index funds allocate capital based on company size, not company quality. A bloated, debt-heavy business earns a larger slice of a portfolio simply because its market capitalisation is big enough. A growing category of ASX-listed quality ETFs takes a different approach, using rules-based screens for financial strength, specifically metrics like return on equity, earnings stability, low debt, and cash flow consistency, to determine which companies make the cut. As of early 2026, funds like BetaShares QLTY and AQLT collectively represent hundreds of millions of dollars in investor capital following this methodology. What follows explains exactly how quality-factor screening works on the ASX, where QLTY and AQLT differ despite sharing the same investment philosophy, how they compare with other quality-adjacent funds, and what Australian investors should weigh before choosing between them.
Why market-cap weighting can leave investors exposed to the wrong businesses
Market-cap-weighted index funds allocate capital proportionally to a company’s total market value. The larger the company, the bigger its position in the fund, regardless of whether that company carries heavy debt, generates inconsistent earnings, or struggles to convert reported profits into actual cash.
This creates a structural tilt toward sectors that happen to be large rather than financially sound. In the Australian context, broad index funds like those tracking the S&P/ASX 200 carry significant exposure to leveraged financial institutions, banks and insurers whose balance sheets depend on debt by design. According to Morningstar analysis published in March 2026, quality screens systematically underweight financials precisely because leveraged balance sheets fail low-debt filters. The corresponding overweight flows toward technology and healthcare, sectors where asset-light business models tend to generate high return on equity with less financial fragility.
Cap-weighted index concentration in Australia is more acute than most investors realise: the top 10 companies in the ASX 200 account for 48.6% of the index as of May 2026, meaning a standard domestic index ETF places nearly half of an investor’s local equity exposure into a small cluster of banks and miners whose financial profiles quality screens would treat very differently.
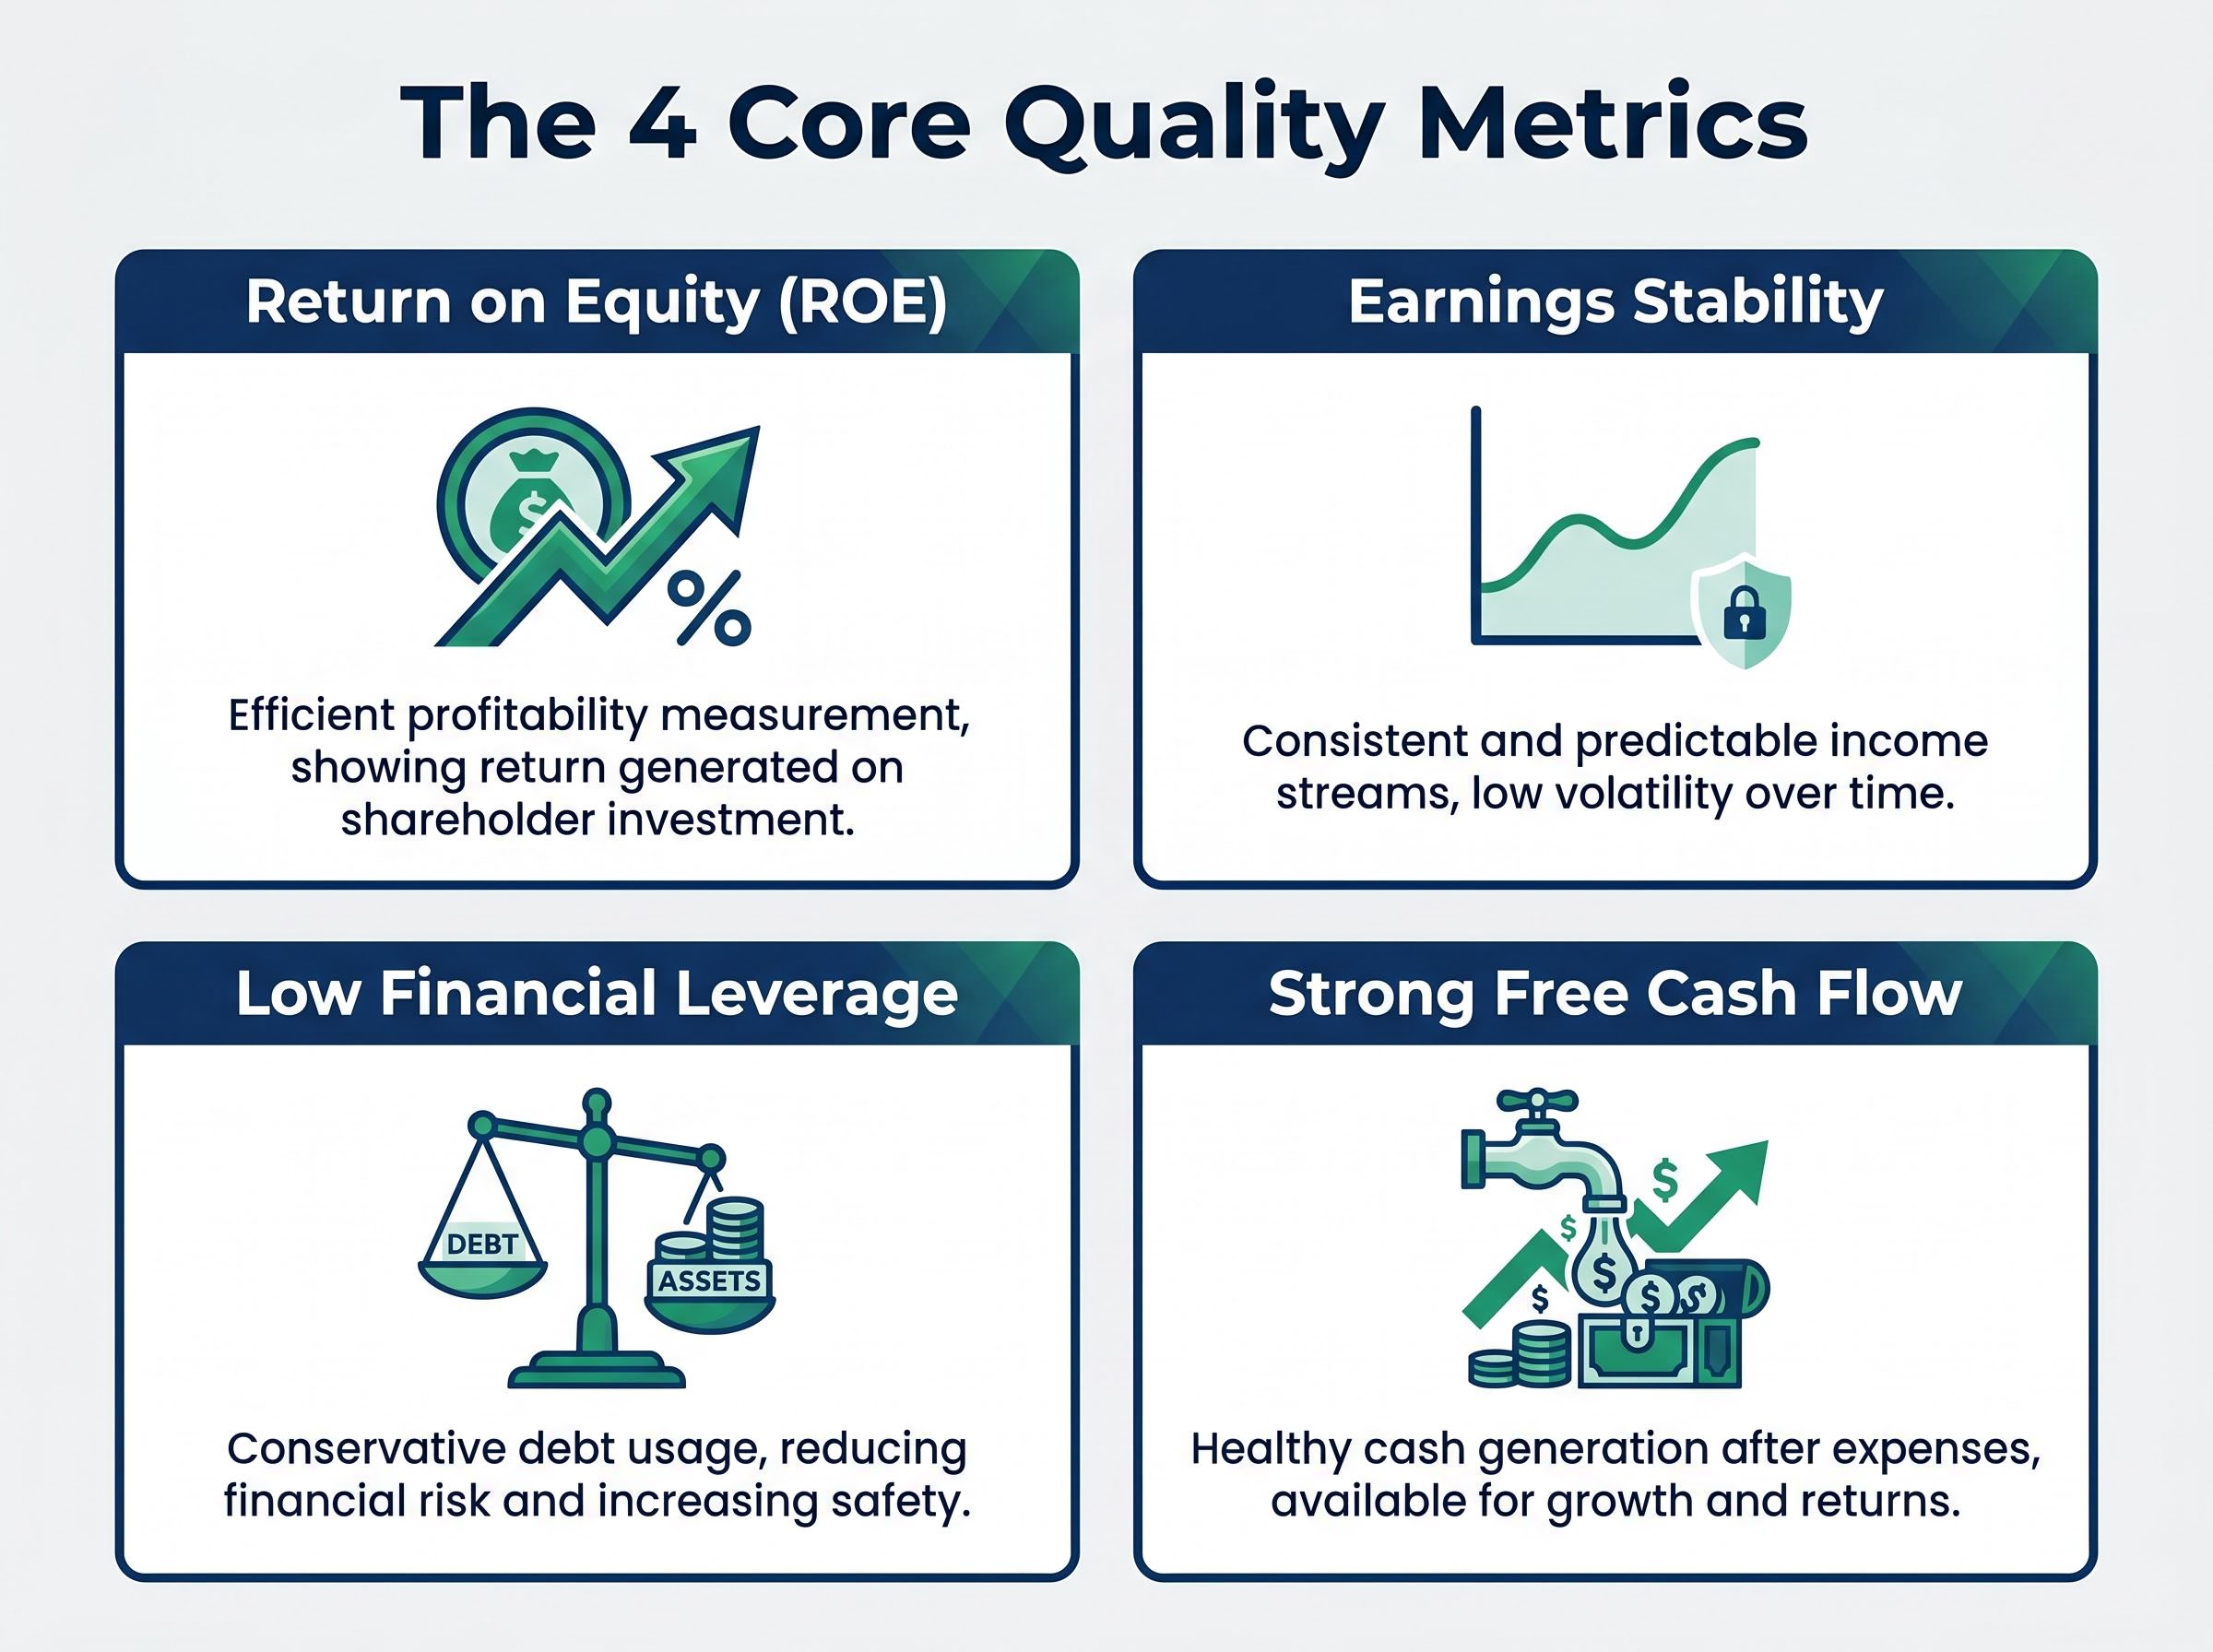
Quality screening is not merely an alternative style choice. It is a deliberate correction to the structural weakness of cap-weighted indexing. The four core quality metrics that underpin most screens are:
- Return on equity (ROE): Measures how efficiently a company generates profit from shareholder capital
- Earnings stability: Favours businesses with consistent, predictable profit patterns over cyclical or volatile earners
- Low financial leverage: Screens out companies carrying debt loads that amplify downside risk
- Strong free cash flow: Confirms that reported earnings translate into real cash generation rather than accounting artefacts
“Adding exposure to ETFs that focus exclusively on quality companies can help investors improve overall resilience of their portfolios during economic downturns while also positioning for potential long-term growth.” — BetaShares
Australian investors whose portfolios lean on broad index products may not realise they are carrying meaningful exposure to leveraged businesses. Understanding this structural difference is the first step in evaluating whether a quality tilt complements or replaces existing holdings.
When big ASX news breaks, our subscribers know first
What “quality” actually means as an investment factor
The word “quality” gets used loosely in investing. Quality-factor investing attaches specific, measurable criteria to the label, removing the ambiguity. Each metric earns its place in the screen because it isolates a different dimension of financial strength.
| Quality Metric | What It Measures | What Failing the Screen Looks Like |
|---|---|---|
| Return on Equity | How efficiently a company turns shareholder capital into profit | Low or declining ROE, suggesting the business needs more capital to generate the same returns |
| Earnings Stability | Consistency of profit patterns over multiple reporting periods | Volatile or cyclical earnings that swing sharply between profit and loss |
| Low Financial Leverage | Whether the company operates with manageable debt relative to equity | High debt-to-equity ratios that amplify losses during downturns |
| Strong Free Cash Flow | Whether reported earnings translate into actual cash the business can deploy | Positive accounting profits but weak or negative cash generation |
These screens are rules-based and systematic. No fund manager is making discretionary calls about which companies “feel” like quality. The algorithm applies the criteria uniformly, and companies either clear the filters or they do not.
Quality factor scores in broad indexes reveal why passive exposure across size segments produces very different outcomes: US small-cap indexes carried a quality factor score of -0.64 as of December 2025, a structural tilt toward lower-quality businesses that is invisible to investors who only look at sector weights and expense ratios.
Quality screens also deliberately de-emphasise speculative or high-growth businesses where future earnings remain uncertain. A company with extraordinary revenue growth but unpredictable profitability would typically fail the earnings stability and cash flow tests.
Quality versus speculation
This is where quality-factor investing parts company with momentum or growth-driven strategies. Momentum funds chase recent price performance. Growth funds chase revenue expansion. Quality screens actively exclude businesses with unstable earnings, even popular ones riding sentiment-driven rallies.
The trade-off is real. A quality screen will not capture the full upside of a speculative bull run. What it aims to do instead is reduce exposure to businesses that are fragile under stress, favouring companies whose financials hold together when conditions deteriorate.
Inside QLTY: how BetaShares screens 1,800 global companies down to 150
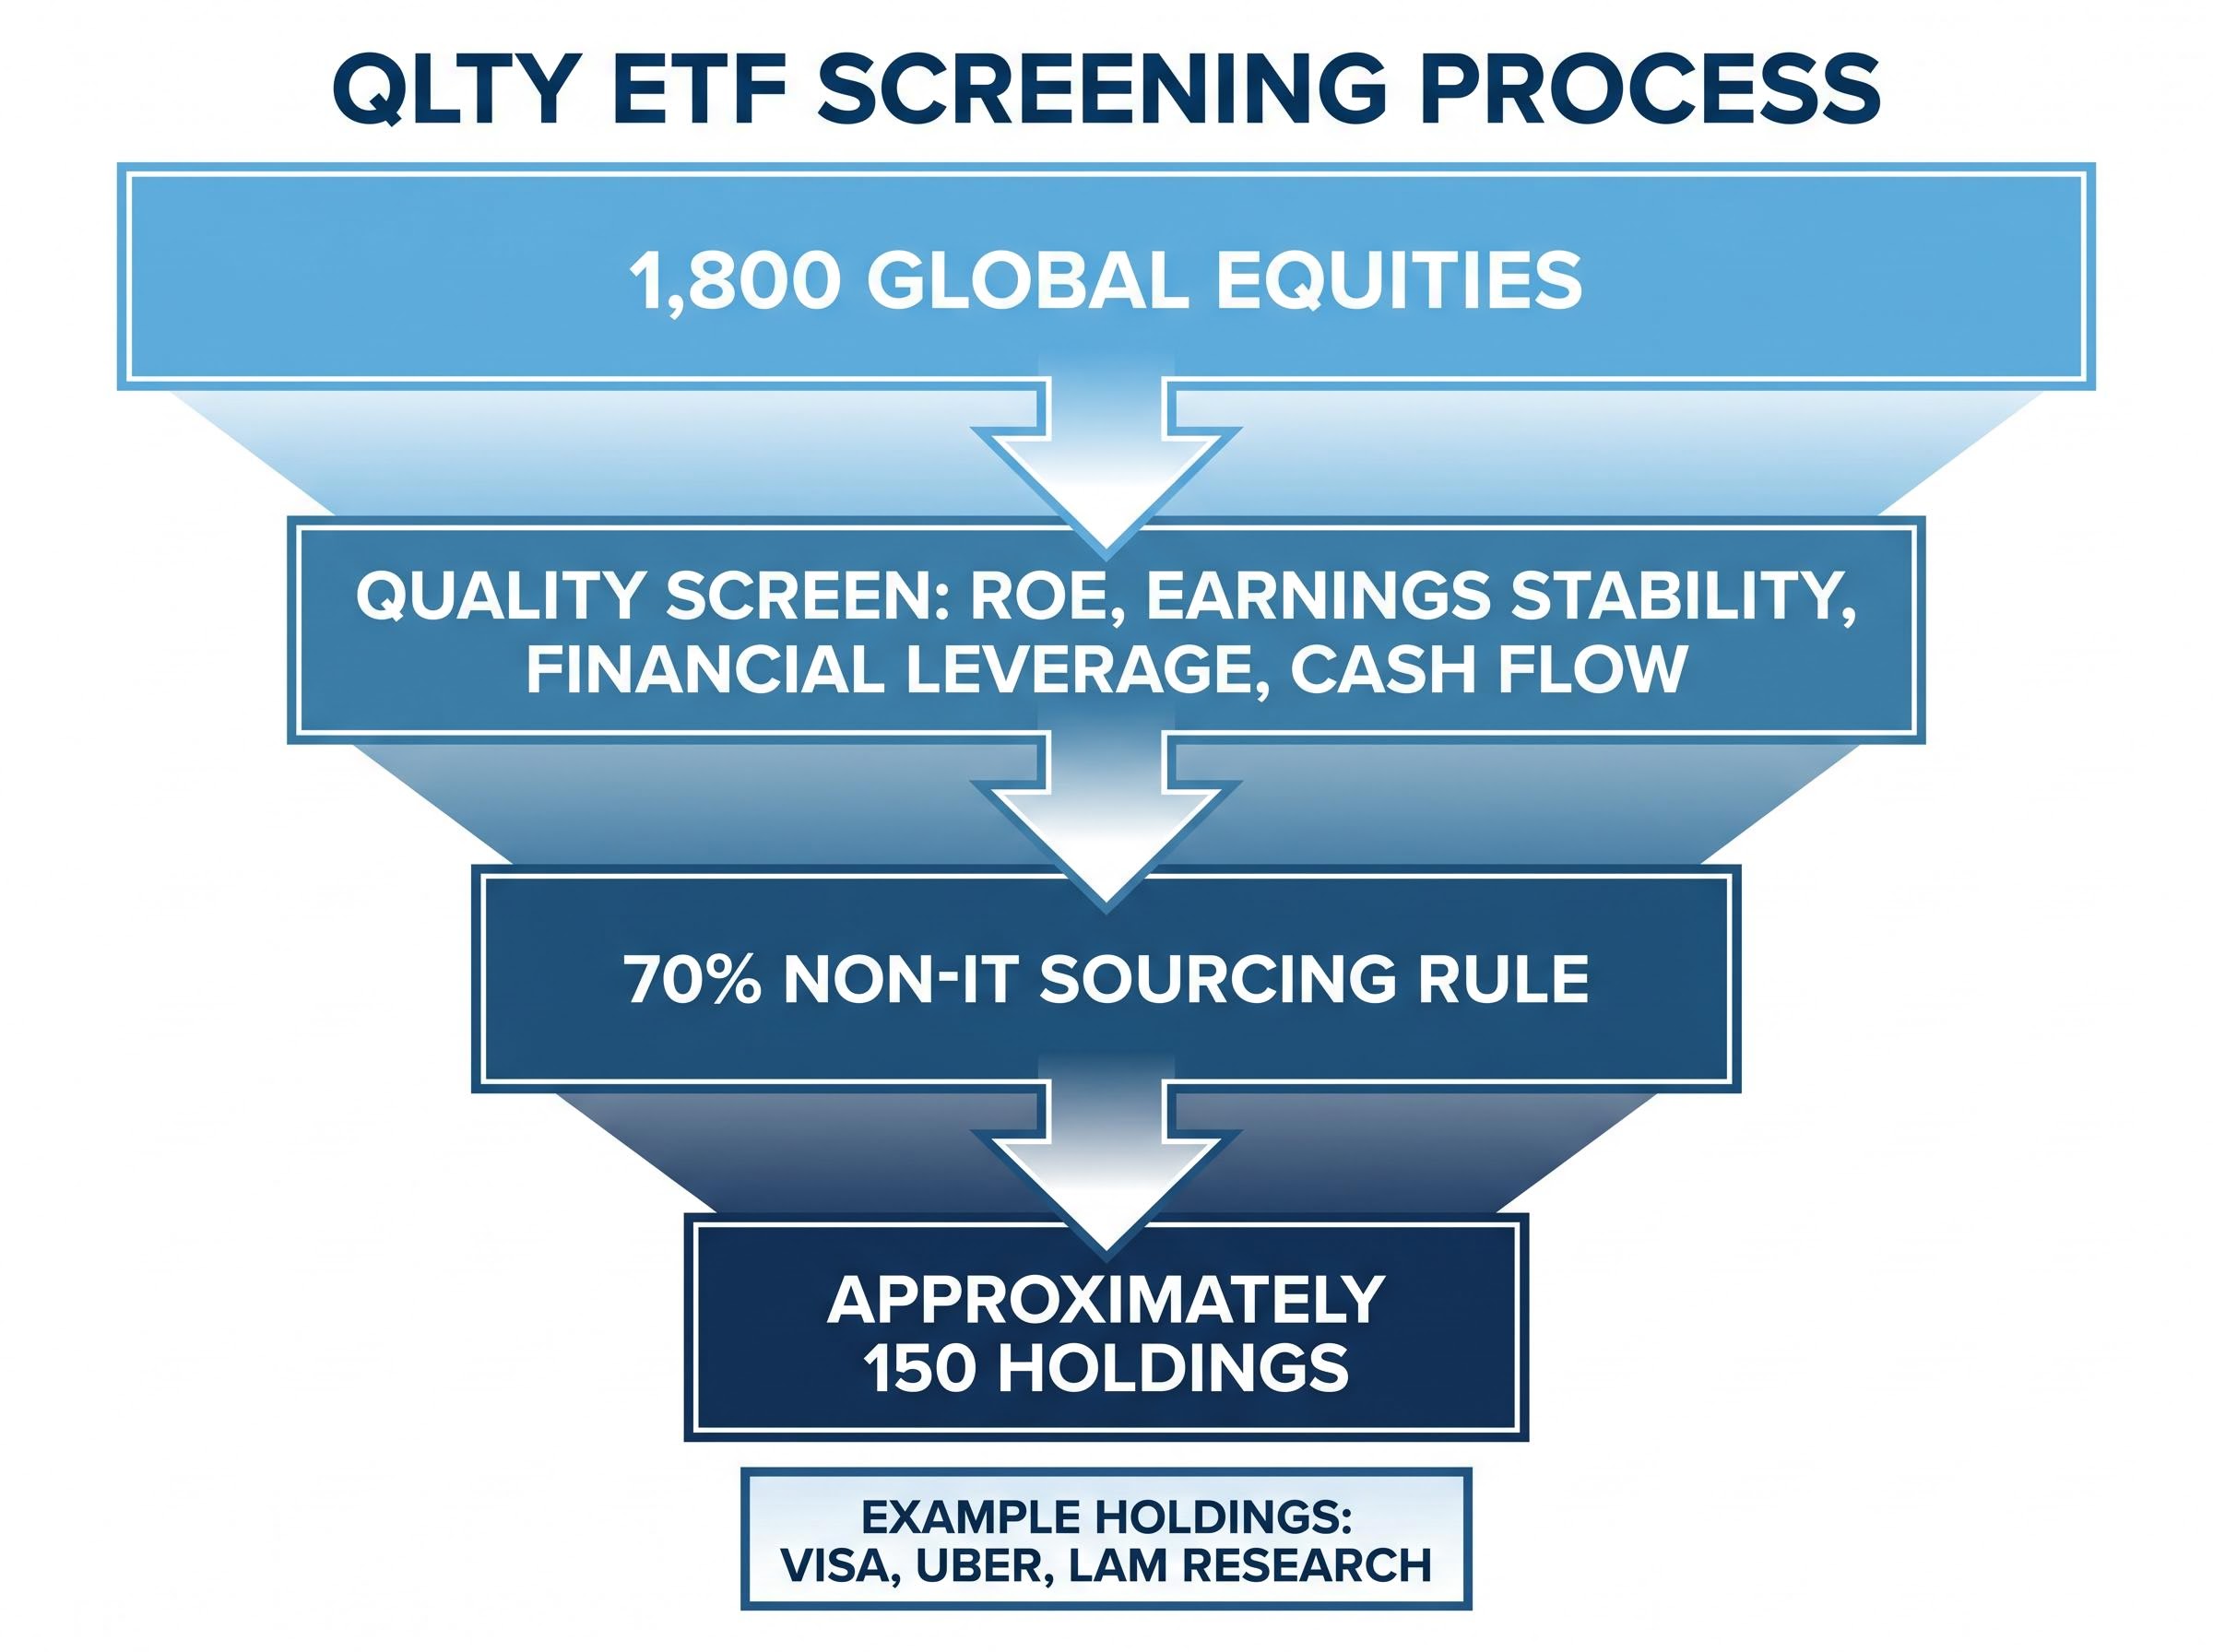
BetaShares Global Quality Leaders ETF (QLTY) starts with a universe of approximately 1,800 global stocks and runs them through a multi-step filtering process. The result is a concentrated portfolio of roughly 150 companies that clear every quality threshold. The selection sequence works as follows:
- Begin with the full universe of approximately 1,800 global equities
- Apply the quality screen: rank companies on ROE, earnings stability, financial leverage, and cash flow strength
- Enforce the 70% non-IT sourcing rule, capping technology sector concentration to prevent the portfolio from becoming a de facto tech fund
- Arrive at a final portfolio of approximately 150 holdings
The 70% non-IT sourcing constraint is a design choice worth understanding. Global quality screens naturally overweight technology because asset-light tech businesses tend to score well on ROE and cash flow metrics. Without the cap, the portfolio would concentrate heavily in one sector, undermining the diversification that quality screening is meant to provide.
Current holdings illustrate the methodology in practice. Visa (V) clears quality filters through consistently high margins and low capital intensity. Uber (UBER) has shifted into sustained profitability with strong cash generation. Lam Research (LRCX) operates in semiconductor equipment with stable earnings and high returns on equity.
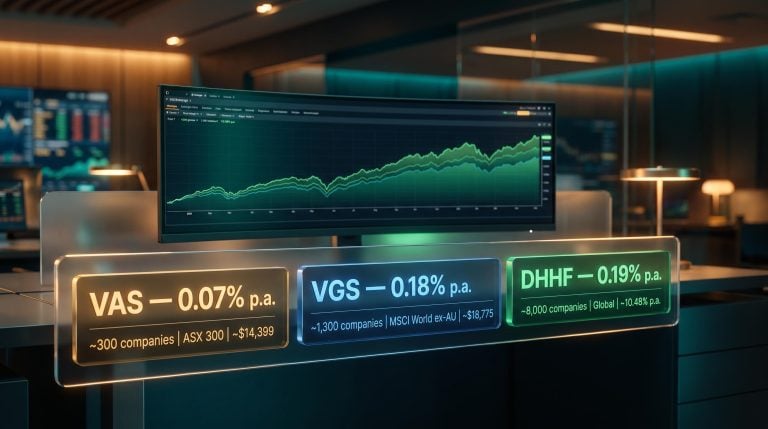
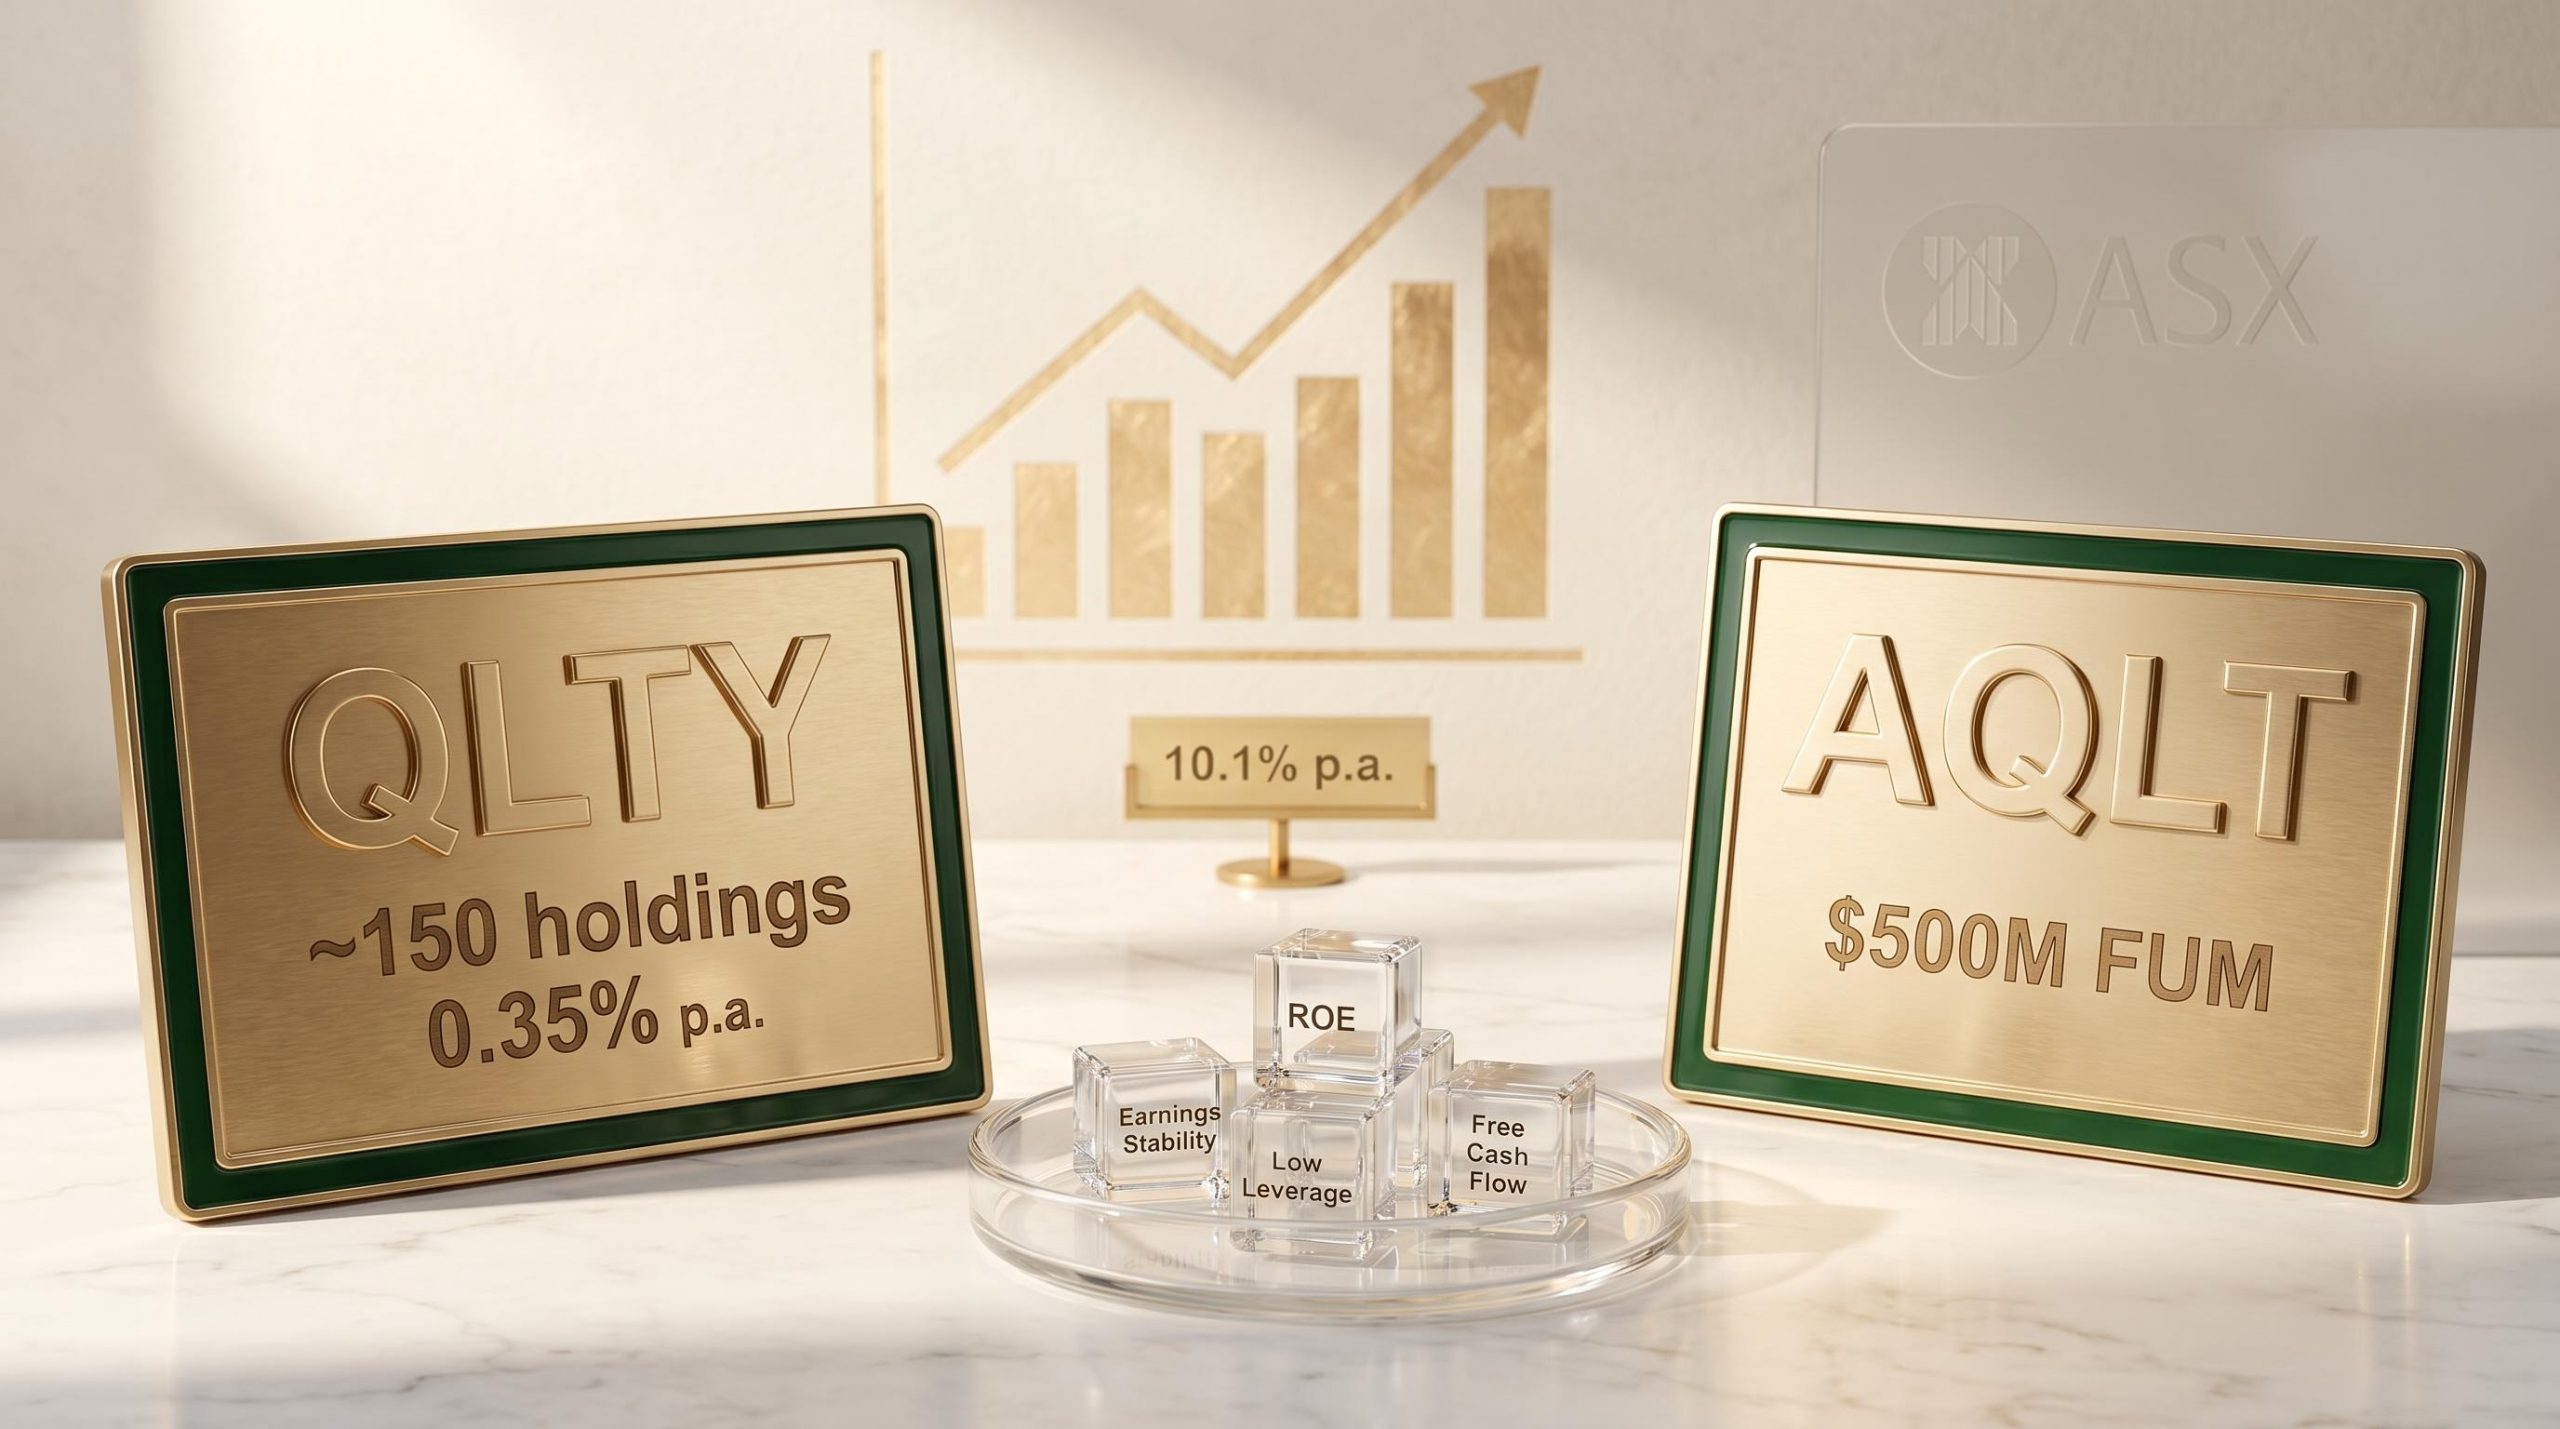
QLTY’s management expense ratio sits at 0.35% per annum. The ETF launched on 5 November 2018, though the underlying index dates back to 27 December 2002.
Historical index performance shows a return of 10.1% per annum since inception versus 7.7% per annum for the MSCI World ex-Australia benchmark. Note: this data is as of September 2023 and is now more than two years old. Investors should verify current performance figures directly from the BetaShares product dashboard.
The wider quality ETF landscape: GOAT, QUAL, and how moat-based strategies fit in
QLTY and AQLT are not the only quality-tilted options on the ASX. Several other funds operate in this space, each reflecting a different interpretation of what “quality” means in practice.
VanEck Morningstar International Wide Moat ETF (GOAT) adds a layer that pure quality screens do not: valuation assessment. GOAT selects international companies with sustainable competitive advantages, what Morningstar calls “wide moats”, and then applies a valuation overlay to avoid overpaying for them. Current holdings include Etsy (ETSY), NXP Semiconductors (NXPI), and Nike (NKE). A wide moat refers to a durable competitive advantage that protects a company’s profits from competitors over extended periods. These advantages typically arise from one of five sources:
- Brand strength: Consumer loyalty that supports pricing power (e.g., Nike’s global brand recognition)
- Scale advantages: Cost efficiencies that smaller competitors cannot replicate
- Switching costs: High barriers for customers to move to a rival product or service
- Intellectual property: Patents, proprietary technology, or regulatory licences that block competition
- Network effects: Platforms that become more valuable as more users join (e.g., Etsy’s marketplace dynamics)
VanEck MSCI International Quality ETF (QUAL) tracks the MSCI World Quality Index, screening global companies on ROE, earnings stability, and low leverage. Current holdings include Microsoft (MSFT), NVIDIA (NVDA), and Visa (V). Morningstar awarded medalist ratings to quality ETFs in its March 2026 coverage.
SPDR MSCI World Quality Mix ETF (QMIX) takes a different approach entirely, blending quality with value and low volatility factors. Its MER of 0.18% per annum, confirmed as of 19 March 2026, sits significantly below QLTY’s 0.35%.
How fees compare across quality ETFs
The fee differential between QLTY (0.35%) and QMIX (0.18%) is notable but requires context. QMIX is a multi-factor blend, meaning investors are not getting pure quality exposure; they are also accepting value and low-volatility tilts that change the portfolio’s behaviour. A lower fee does not automatically make a fund the better choice when the underlying methodology differs.
MERs for AQLT and GOAT remain unconfirmed in available research. Investors should verify directly from BetaShares and VanEck product pages respectively before making fee comparisons.
Inside AQLT: applying the same philosophy to the Australian market
Where QLTY casts a global net, BetaShares Australian Quality ETF (AQLT) applies the same quality philosophy exclusively to ASX-listed companies. The screening criteria remain familiar: high ROE, low financial leverage, strong cash flow, and earnings consistency. What changes is the universe the filters operate on, and that changes the output materially.
Applying quality screens to the Australian market produces a portfolio with a different sector composition than the broad S&P/ASX 200. The Australian market is heavily weighted toward financials and resources; a quality filter reshapes that exposure based on which companies clear the financial strength thresholds.
One instructive detail: Commonwealth Bank of Australia (CBA) appears among AQLT’s holdings. CBA’s inclusion signals that quality screens do not automatically exclude all financials. When a bank’s return on equity, earnings consistency, and balance sheet metrics clear the filter, it passes. This distinguishes AQLT’s methodology from a pure leverage-exclusion approach. Other current holdings include Goodman Group (GMG) and Wesfarmers (WES), though earlier research cited CSL and REA Group, indicating the portfolio evolves as companies’ financial metrics shift.
AQLT launched in April 2022 and reached over $500 million in funds under management by July 2025, according to the BetaShares FY25 report card. Reaching that milestone within approximately three years signals meaningful investor adoption. The Motley Fool Australia included AQLT among three recommended ASX ETFs focused on quality in March 2026.
AQLT’s management expense ratio was not confirmed in available research and should be verified directly from the BetaShares product page before investing.
| Dimension | QLTY | AQLT |
|---|---|---|
| Geographic Focus | Global (approximately 1,800-stock universe) | Australia (ASX-listed companies) |
| Portfolio Size | Approximately 150 holdings | Not confirmed; ASX-focused quality selection |
| Example Holdings | Visa, Uber, Lam Research | CBA, Goodman Group, Wesfarmers |
| MER | 0.35% p.a. | Unconfirmed; verify via BetaShares |
| FUM | Unconfirmed; verify via BetaShares | Over $500M (July 2025) |
What a disciplined quality screen actually delivers for Australian investors
Understanding what quality screens are is one thing. Understanding what they do to a portfolio over time is what matters for allocation decisions.
Structural advantages of quality screens:
- Reduced exposure to financially fragile businesses that carry high debt or generate inconsistent earnings
- Systematic selection based on measurable financial strength rather than market sentiment or momentum
- Sector concentration in technology and healthcare, where asset-light, high-ROE business models tend to cluster
- Historical evidence of outperformance: QLTY’s underlying index returned 10.1% per annum versus 7.7% for the MSCI World ex-Australia benchmark (as of September 2023; current figures require verification from BetaShares)
Trade-offs to understand before investing:
- Quality screens may lag during momentum-driven rallies, such as the AI-driven equity surge in 2024-2025, when speculative growth stocks outperform financially stable ones
- Sector underweights (particularly financials) mean the portfolio will behave differently from broad Australian indices during periods when banks rally
- Quality is a style factor, not a guarantee; 2025-2026 quality-versus-benchmark comparison data is not available in current research, and investors should review current figures directly from fund providers
- Quality ETFs are most coherent as a complement to broad market exposure rather than a wholesale replacement, particularly for investors already holding a core Australian or global index fund
“Adding exposure to ETFs that focus exclusively on quality companies can help investors improve overall resilience of their portfolios during economic downturns while also positioning for potential long-term growth.” — BetaShares
AQLT’s growth to over $500 million in funds under management within approximately three years of inception suggests Australian investors are increasingly recognising this portfolio role.
AQLT within a broader ETF portfolio typically sits alongside a global quality or index fund rather than replacing one entirely, because the domestic quality screen and an international allocation address different geographic risk exposures that compound separately over time.
Picking the right quality ETF for your portfolio
Four investor dimensions determine which quality ETF fits best: geographic preference, cost sensitivity, methodology purity, and whether the allocation serves as a core holding or a satellite position.
| Fund | Geographic Focus | Methodology | Confirmed MER | Best Suited For |
|---|---|---|---|---|
| QLTY | Global | Pure quality screen | 0.35% p.a. | Investors wanting diversified global quality exposure at a moderate fee |
| AQLT | Australia | Pure quality screen | Unconfirmed | Investors seeking quality-filtered ASX exposure as a domestic allocation |
| GOAT | International | Wide moat + valuation | Unconfirmed | Investors who want quality with a valuation discipline overlay |
| QMIX | International | Multi-factor blend | 0.18% p.a. | Cost-sensitive investors comfortable with blended factor exposure |
An investor who wants pure quality exposure to global markets and is comfortable with a 0.35% fee has a clear answer in QLTY. An investor who wants that same discipline applied to ASX-listed companies looks to AQLT. An investor willing to accept a multi-factor blend in exchange for a lower fee at 0.18% may find QMIX more appropriate. And an investor who values competitive-advantage durability alongside a valuation check has GOAT as a differentiated option.
Before acting on any of these, investors should verify current MERs, funds under management, and performance data directly from BetaShares and VanEck product pages. Several figures cited in this article remain unconfirmed or are dated, and current data may differ.
ASIC’s regulatory guide for exchange traded product issuers (RG 282) establishes the disclosure and governance obligations that ETF providers operating on the ASX must meet, setting the compliance baseline that funds like QLTY and AQLT operate within.
This article is for informational purposes only and should not be considered financial advice. Investors should conduct their own research and consult with financial professionals before making investment decisions. Past performance does not guarantee future results.
Quality investing rewards patience, not prediction
Quality-factor investing substitutes systematic financial discipline for market prediction. That substitution is the primary reason the approach has attracted hundreds of millions of dollars in Australian investor capital. The methodology does not attempt to forecast which sectors will outperform next quarter. It identifies businesses whose financial characteristics have historically been associated with resilience and compounding.
QLTY offers that discipline across a global universe of approximately 150 companies screened from 1,800 candidates. AQLT applies the same logic domestically, filtering ASX-listed businesses on the same financial strength criteria. The two funds share a philosophy but serve different portfolio purposes: one for international exposure, one for Australian.
The practical next step is straightforward. Review current fund performance data from BetaShares and VanEck. Verify management expense ratios. Assess how a quality ETF fits alongside existing holdings. Quality screening rewards investors who take the time to understand what they own and why they own it.
For investors who have decided quality ETFs belong in their allocation and want to situate that decision within a broader wealth-building framework, our comprehensive walkthrough of long-term portfolio construction covers how index ETFs, dividend income, and patient holding periods interact with compounding across a full investment lifecycle, including the tax-advantaged account structures available to Australian investors.