Here is a question worth sitting with before you buy a single international share: are you actually under-exposed to the rest of the world, or does it just feel that way?
If you hold Australian superannuation, the honest answer is that you are probably already carrying a heavy home-country tilt, with most of that concentrated in a handful of banks and miners. So the real question is not whether to invest internationally. It is how to do it cheaply and simply, through instruments you can buy on the ASX the same way you buy any other share.
Right now, in October 2026, that decision feels sharper than usual. Australian investors are caught between the continued dominance of US large-cap technology and a structural growth story building across Asia, and two ASX-listed funds sit at opposite ends of that spectrum: the iShares S&P 500 ETF (IVV) and the Vanguard FTSE Asia ex Japan Shares Index ETF (VAE).
Here is what this guide gives you. Using a $10,000 illustrative investment as the anchor throughout, you will know exactly what each fund owns, what it costs you per year, the specific risks baked into each one, and how a practical split between the two might look depending on the kind of investor you are.
What ASX-listed ETFs actually do and why they matter for Australian investors
An exchange-traded fund (ETF) holds a basket of underlying securities and trades on the ASX just like an ordinary share. That single feature is what makes international investing accessible: you get a slice of hundreds of foreign companies through one trade, without ever having to buy individual overseas stocks.
Both IVV and VAE are domiciled in Australia and listed on the ASX. That means you do not need a US or Hong Kong brokerage account to own them. You buy them through your existing broker, with the same settlement and tax treatment you already use for BHP or CBA.
Both funds are also physically replicated and unhedged. Physical replication means the fund actually holds the underlying shares, not derivatives or swaps standing in for them. Unhedged means you carry live currency exposure: US dollars for IVV, and a mix of Asian currencies for VAE.
The ASIC Moneysmart ETF guidance covers how physical replication and dividend pass-through work in practice, giving Australian investors a regulator-endorsed baseline for understanding what they actually own when they buy an ASX-listed fund.
Here is what that boils down to in practice:
- They trade on the ASX like any share, so you buy and sell during normal market hours through your broker.
- They hold the actual underlying securities through physical replication, so you own a real slice of each company.
- They pass through dividends from those underlying companies back to you as the holder.
Once you understand this mechanism, the comparison stops feeling like a leap into foreign markets. It becomes a choice between two tools you already know how to use.
Why Australian investors specifically need international diversification
The ASX has a concentration problem, and you are likely living inside it without realising. Australian equities lean heavily on two sectors, financials and resources, which means a portfolio built around domestic shares is really a bet on banks and miners.
ETF concentration risk is more common than the headline stock count suggests: the top 10 stocks in the ASX 200 account for roughly 48-50% of the entire index, meaning a broad domestic ETF already concentrates nearly half of every invested dollar into a handful of names before you add any international exposure.
Superannuation amplifies this. Default super allocations typically skew toward Australian equities, stacking even more exposure onto the same narrow base. International ETFs let you reduce that single-economy risk without having to pick individual foreign stocks, which is exactly why they function as a structural complement rather than a speculative punt.
When big ASX news breaks, our subscribers know first
IVV vs VAE: what each fund owns, what it costs, and how big it is
Start with the raw numbers, because the gap between these two funds is where the whole decision lives.
IVV tracks the S&P 500, giving you the 500 largest US-listed companies in one fund. Its top holdings read like a roll call of American mega-cap technology: Nvidia, Apple, Microsoft, and Amazon. That headline of 500 stocks sounds broadly spread, but technology alone accounts for roughly 39-40% of the portfolio.
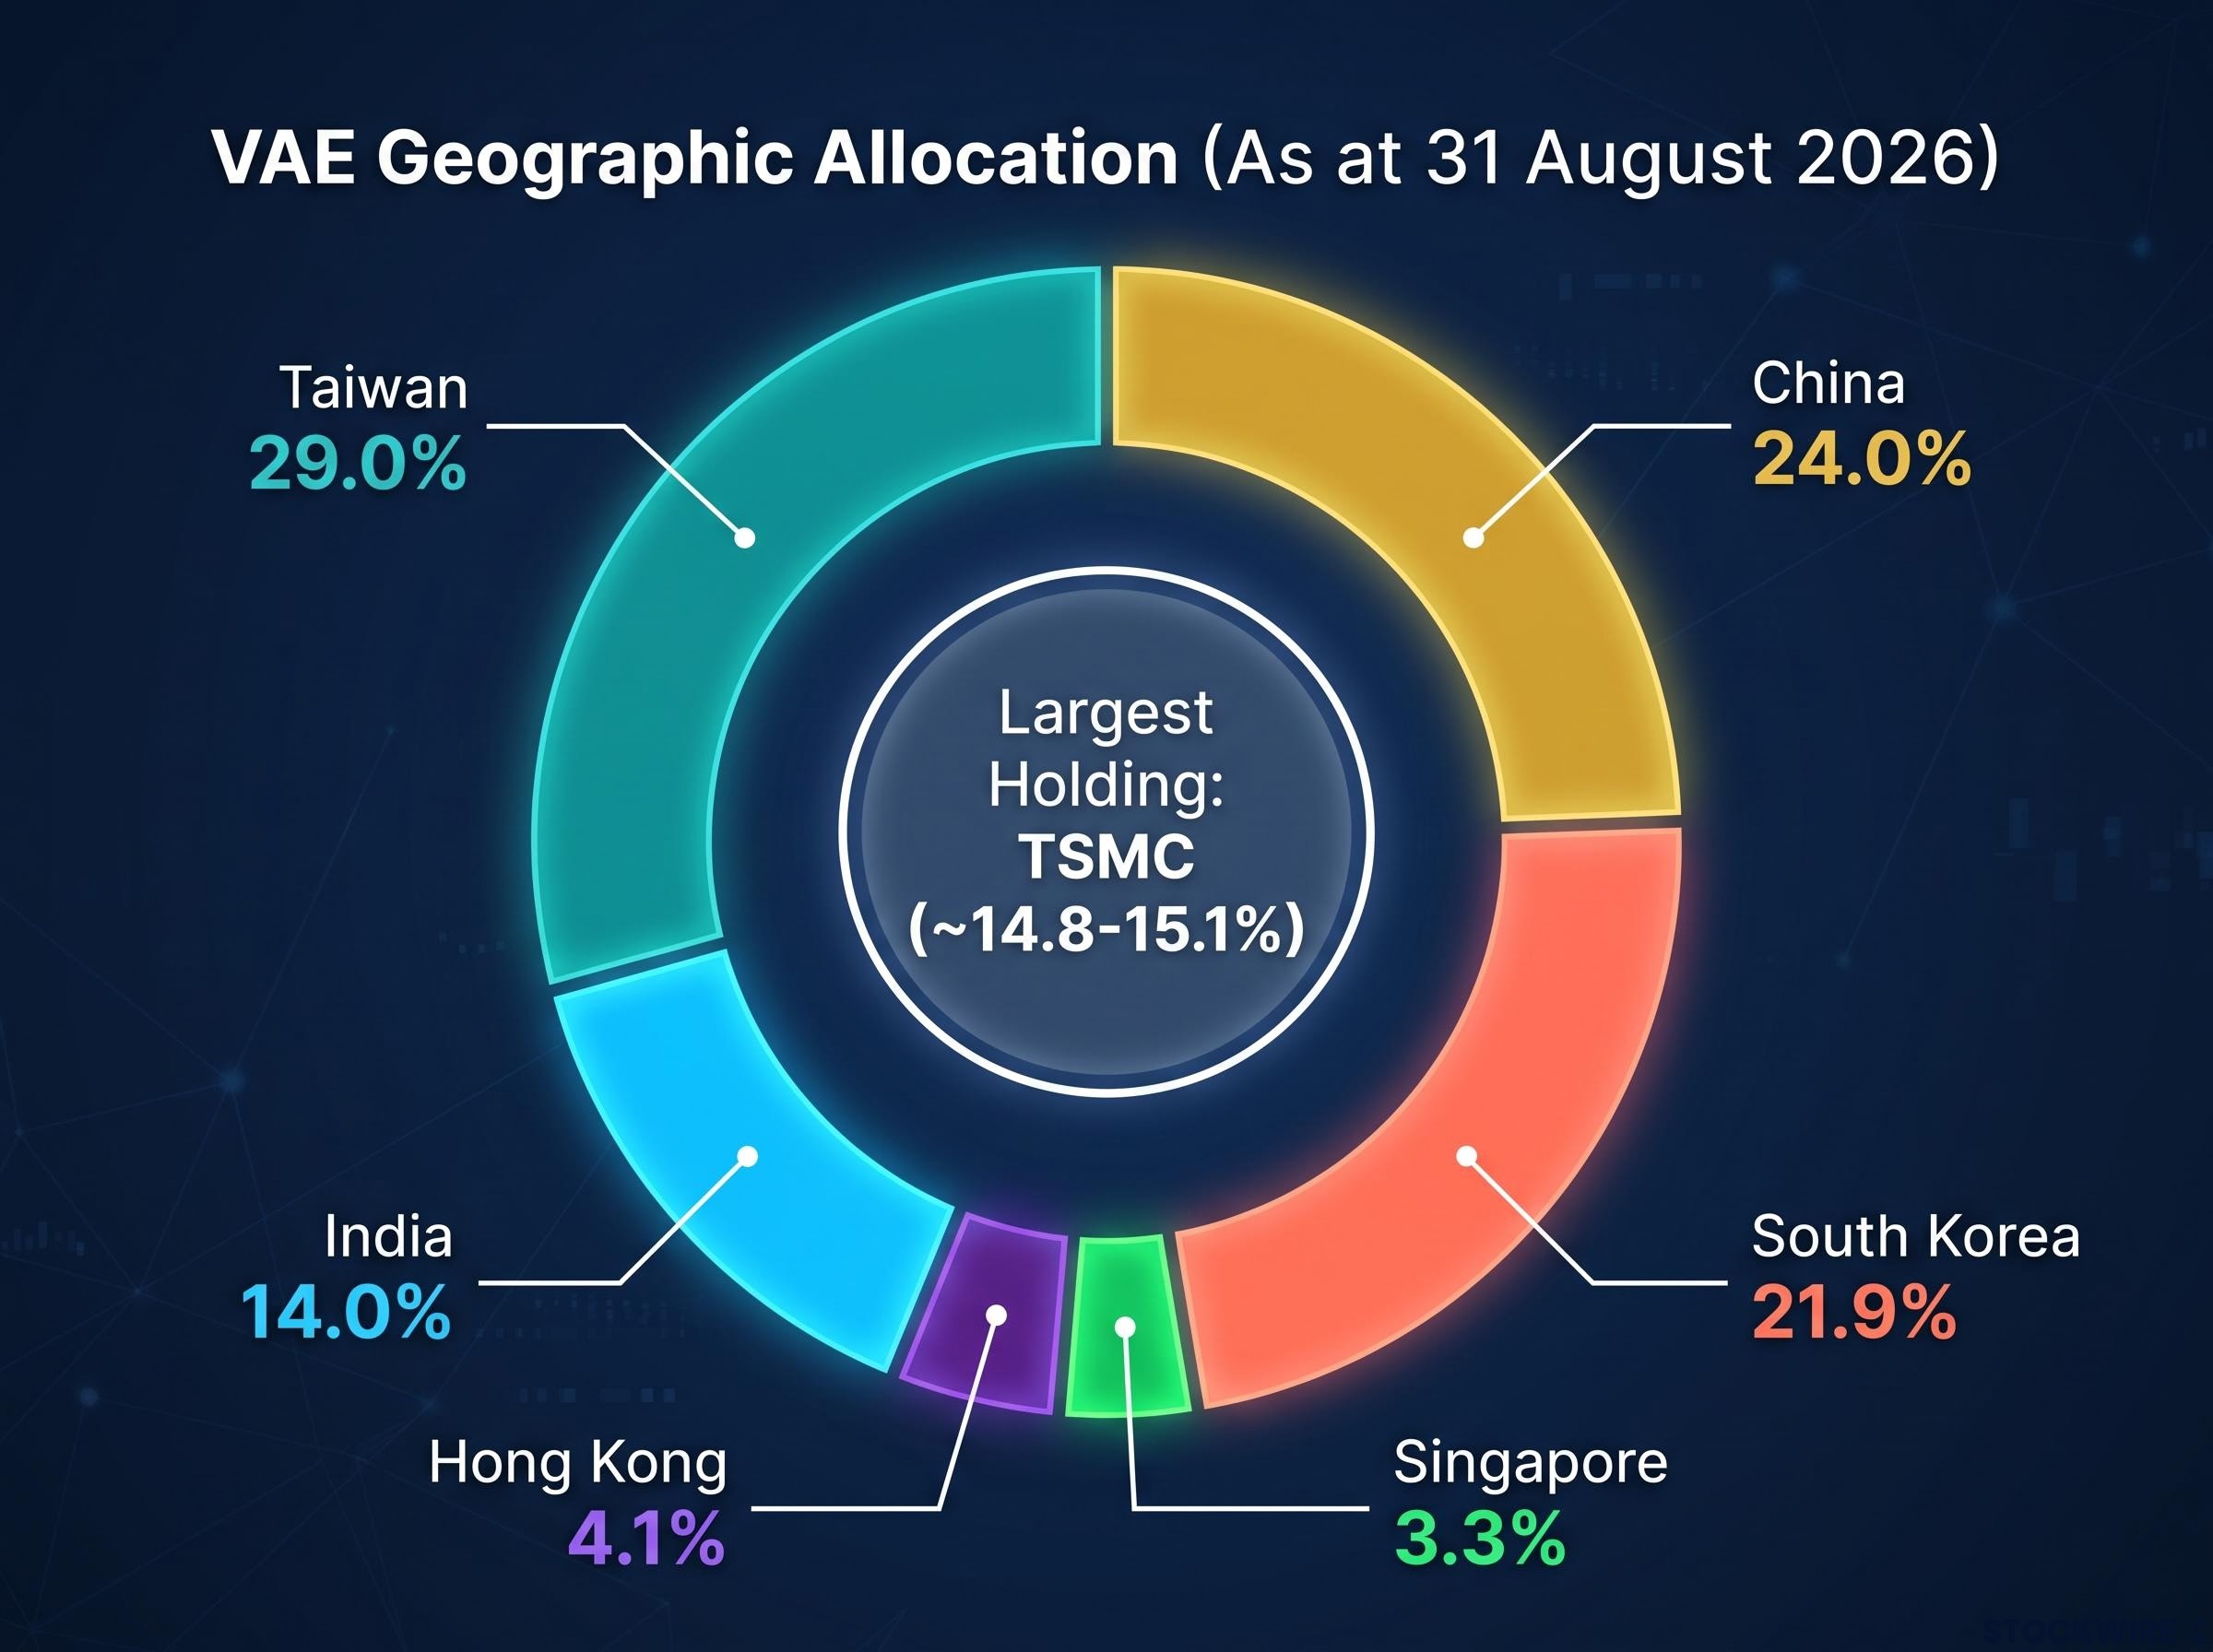
VAE takes a different path. It holds Asian equities excluding Japan, spread across Taiwan at 29.0%, China at 24.0%, South Korea at 21.9%, India at 14.0%, Hong Kong at 4.1%, and Singapore at 3.3% (as at 31 August 2026). Its single largest holding is Taiwan Semiconductor Manufacturing Company at roughly 14.8-15.1% of the fund.
The size difference is stark. IVV carries AUD 14,847.35 million in assets (as at 30 September 2026), while VAE holds AUD 780.4 million (as at 31 August 2026). IVV is roughly 19 times larger, which matters for how smoothly you can trade it and how tight the bid-ask spreads tend to be.
| Feature | IVV | VAE |
|---|---|---|
| AUM | $14,847.35M | $780.4M |
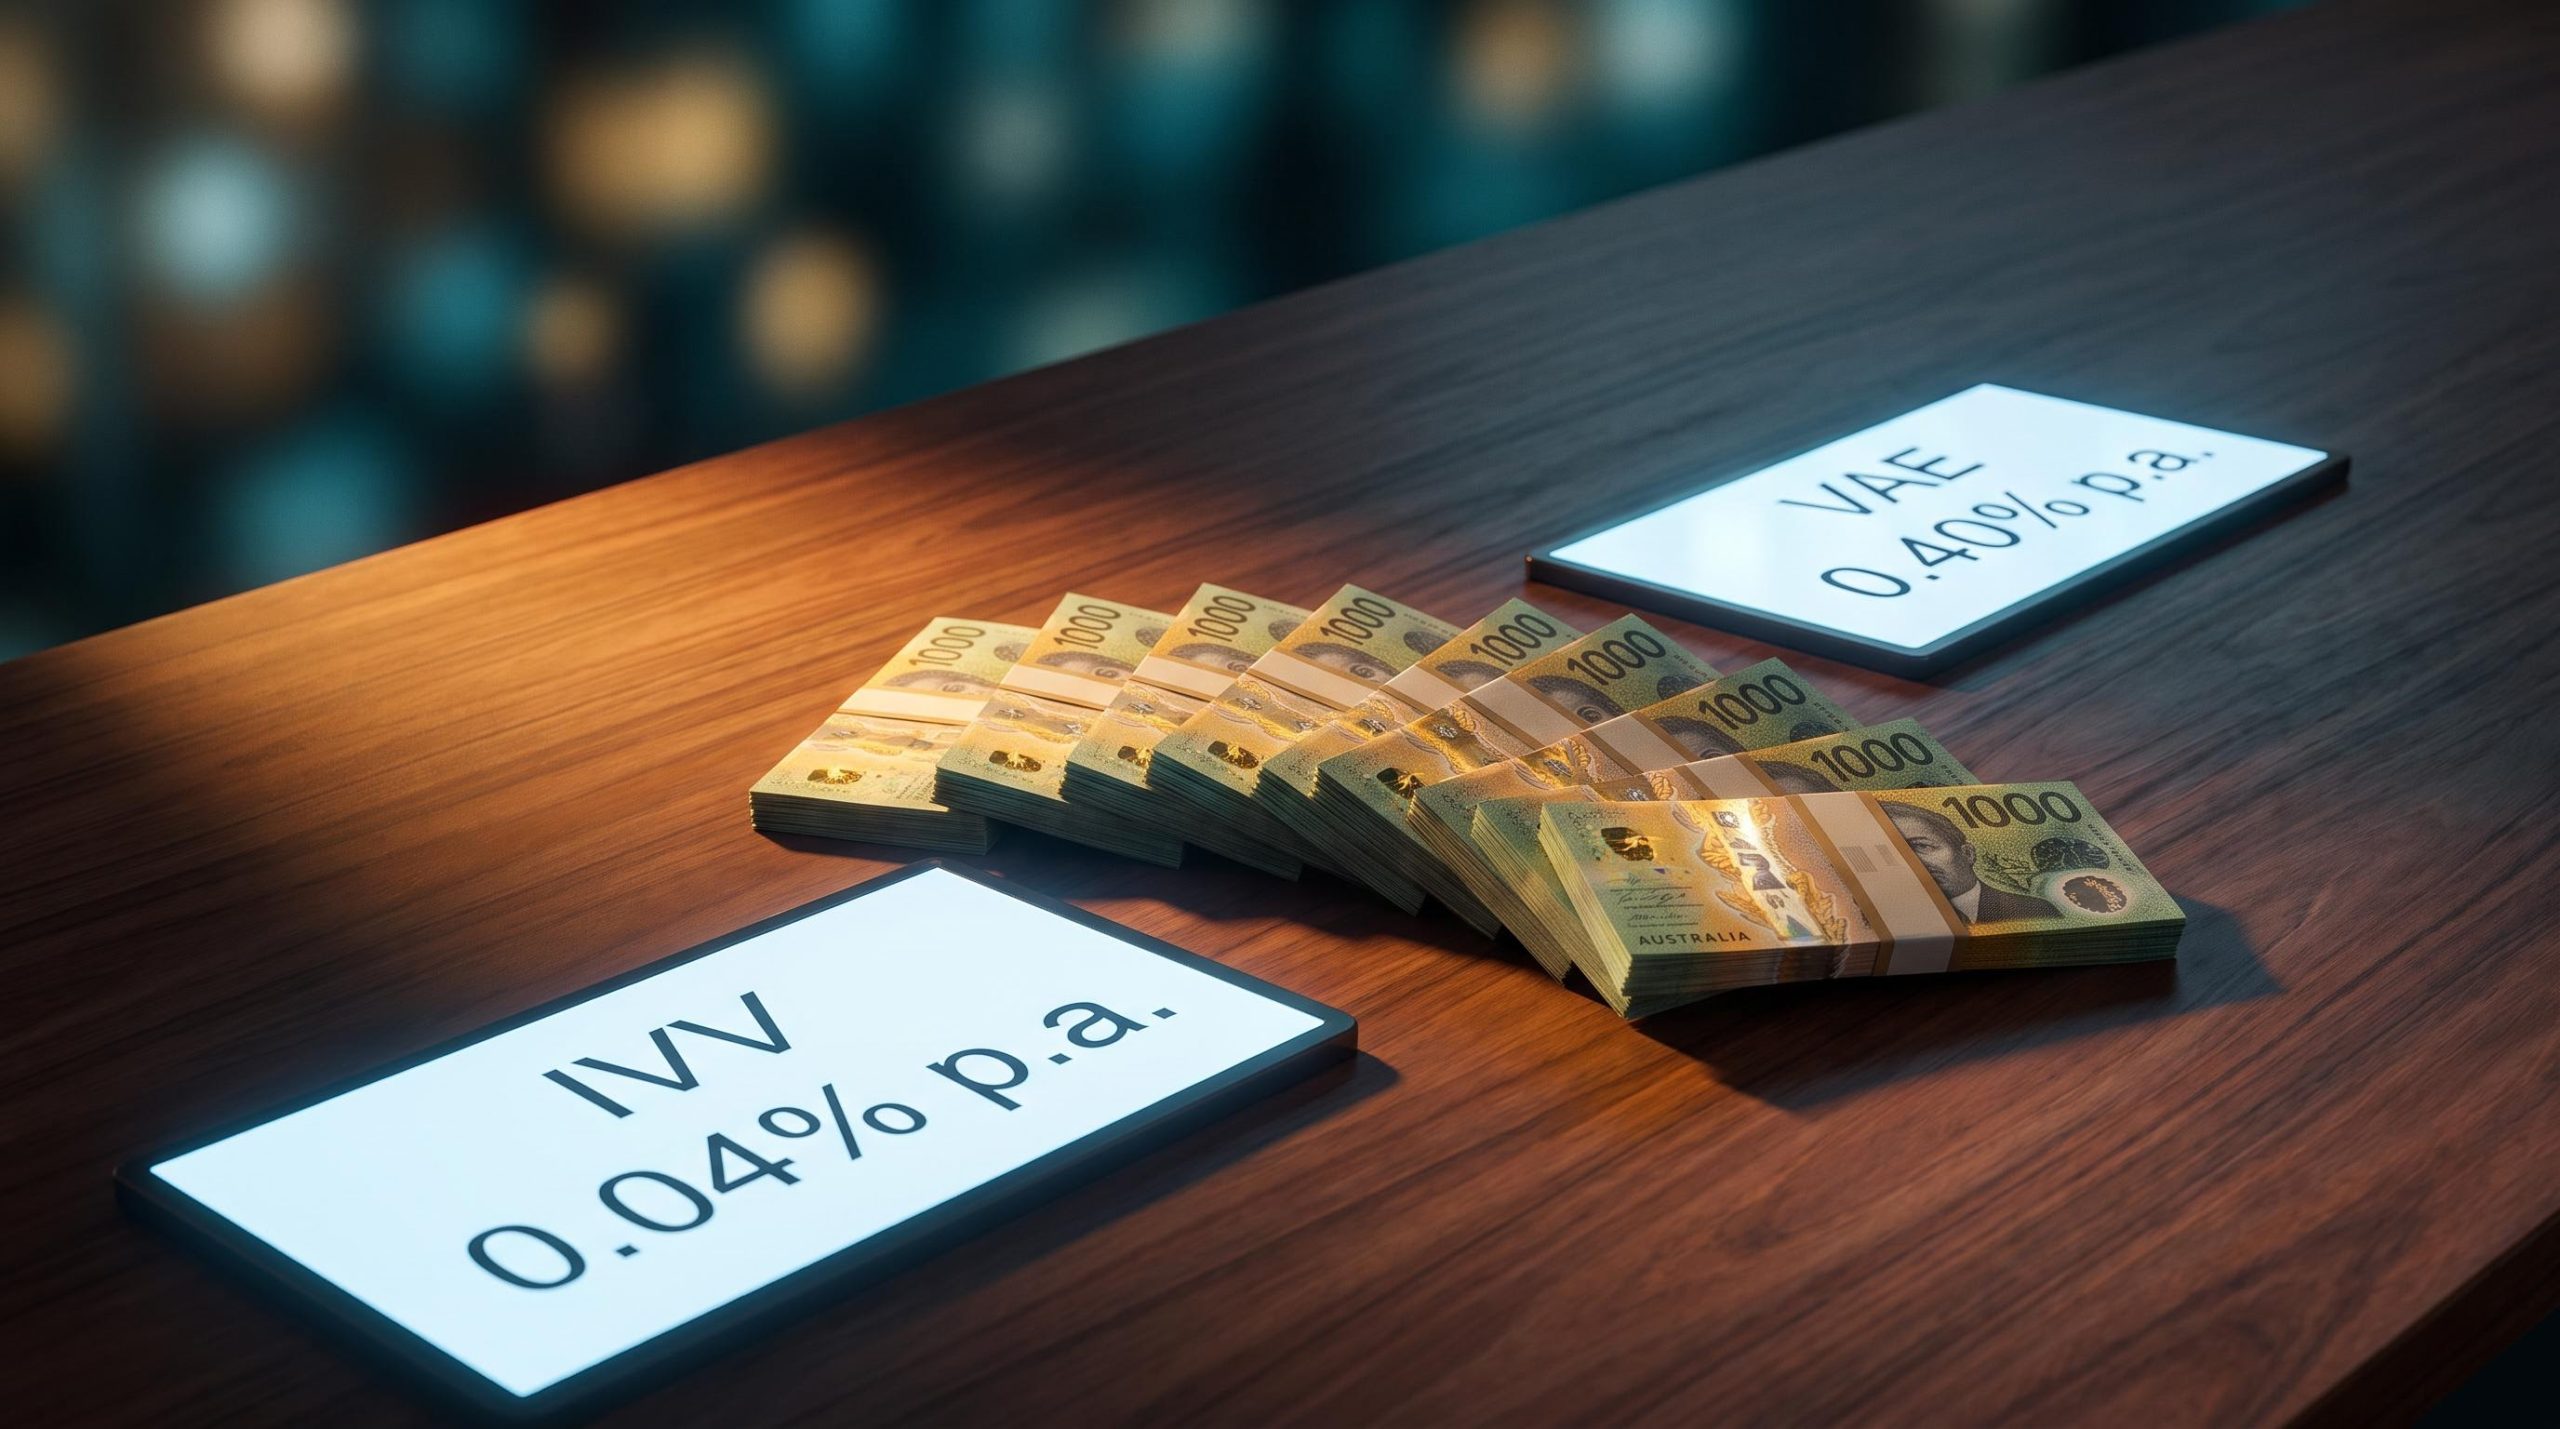
| MER | 0.04% p.a. | 0.40% p.a. |
| Annual fee on $10,000 | ~$4 | ~$40 |
| Number of holdings (approx) | 500 | Multi-market Asia ex-Japan basket |
| Largest geographic exposure | United States (100%) | Taiwan (29.0%) |
| Top single holding | Nvidia | TSMC (~14.8-15.1%) |
| Technology sector weight | ~39-40% | Significant (TSMC, Samsung, SK hynix) |
The single most important number in that table is the management expense ratio (MER), the annual percentage the fund charges to run your money.
At 0.04% p.a., IVV costs approximately $4 per year on a $10,000 holding. VAE, at 0.40% p.a., costs approximately $40 on the same amount.
That is a 10x fee difference, and it compounds. Over a decade or more, you are effectively paying ten times as much to hold VAE’s regional exposure, which means that premium only makes sense if you genuinely believe Asian markets will outperform over your investment horizon. If you do not hold that view, the extra cost is hard to justify.
Performance in context: what the historical returns actually tell you
IVV’s long-run numbers are strong: 9.66% over one year, 16.76% p.a. over three years, 12.96% p.a. over five years, and 15.65% p.a. over ten years (as at 31 August 2026). Read those figures with care. They reflect an exceptional stretch for US equities, not a permanent baseline you can count on repeating.
VAE’s comparable history is shorter and bumpier. A one-year return of 39.49% was reported as at 23 June 2026, but that is a single snapshot sitting on top of a higher-volatility profile, not a return you should pencil in annually.
The honest takeaway is that both sets of figures describe the past, under specific market conditions. Past performance is not a reliable indicator of future returns, and treating either number as a forward promise is where investors most often get burned.
The risks that come with each fund and what investors often underestimate
The holdings and performance data lean optimistic. Now comes the part that is easy to skip when markets are rising and much harder to ignore when they are not.
Start with the risk that applies to both. Because IVV and VAE are unhedged, your returns move with the Australian dollar before the underlying shares have done anything at all.
Both funds are unhedged, which means movements in the Australian dollar affect your total return before the underlying equity performance is even factored in.
Beyond currency, each fund carries its own distinct structural risks worth naming explicitly.
IVV-specific risks
IVV’s diversification is thinner than its 500-stock headline implies, and its concentration in US mega-cap technology is the main thing to watch.
- Technology makes up roughly 39-40% of the portfolio, so a small cluster of mega-cap names drives much of the fund’s performance.
- If US large-cap growth stumbles, whether through regulation, valuation compression, or a rotation in market leadership, IVV can lag broader or equal-weight indices.
- A strong US dollar is a tailwind, but a strengthening AUD erodes your returns in Australian dollar terms regardless of how the underlying companies perform.
VAE-specific risks
VAE’s risks are more concentrated and more political, clustered in two markets that carry outsized geopolitical weight.
- China represents roughly 24% of the fund, exposing you to property-sector stress and regulatory interventions that can hit the whole index.
- Taiwan accounts for roughly 29%, including TSMC at 14.8-15.1%, which ties a large chunk of the fund to US semiconductor export controls and regional tension.
- With AUD 780.4 million in assets against IVV’s AUD 14,847.35 million, VAE’s smaller size can mean wider bid-ask spreads and more tracking difference, particularly during stressed markets or when a market like China faces trading halts.
Asian market volatility during the Hormuz crisis period illustrates precisely why VAE’s geopolitical risk is not theoretical: Shenzhen fell 3.35% in a single session while the Nikkei was virtually flat, confirming that exposure within a regional fund depends far more on its sector and country composition than on the geographic label attached to it.
For your $10,000, the practical implication is straightforward. VAE’s risk profile demands a longer time horizon and firmer conviction in Asian structural growth than IVV asks of its investors, so sizing that position conservatively is the rational default unless you hold strong views.
Currency exposure as a hidden return driver
Because both funds are unhedged, a strengthening Australian dollar quietly erodes the value of your offshore holdings in AUD terms, while a weakening dollar boosts them. This happens independently of whether the underlying companies had a good year.
For long-term investors, this is not necessarily a problem; currency swings tend to wash out over time. The danger is short-term. A sudden currency-driven dip can look like a company or market failing, and that misread is exactly what triggers poorly timed selling.
How to think about splitting $10,000 between IVV and VAE
The dominant framework among Australian practitioners is core-satellite: a large, low-cost anchor holding surrounded by smaller, more targeted positions. In this structure, IVV is your core and VAE is your satellite.
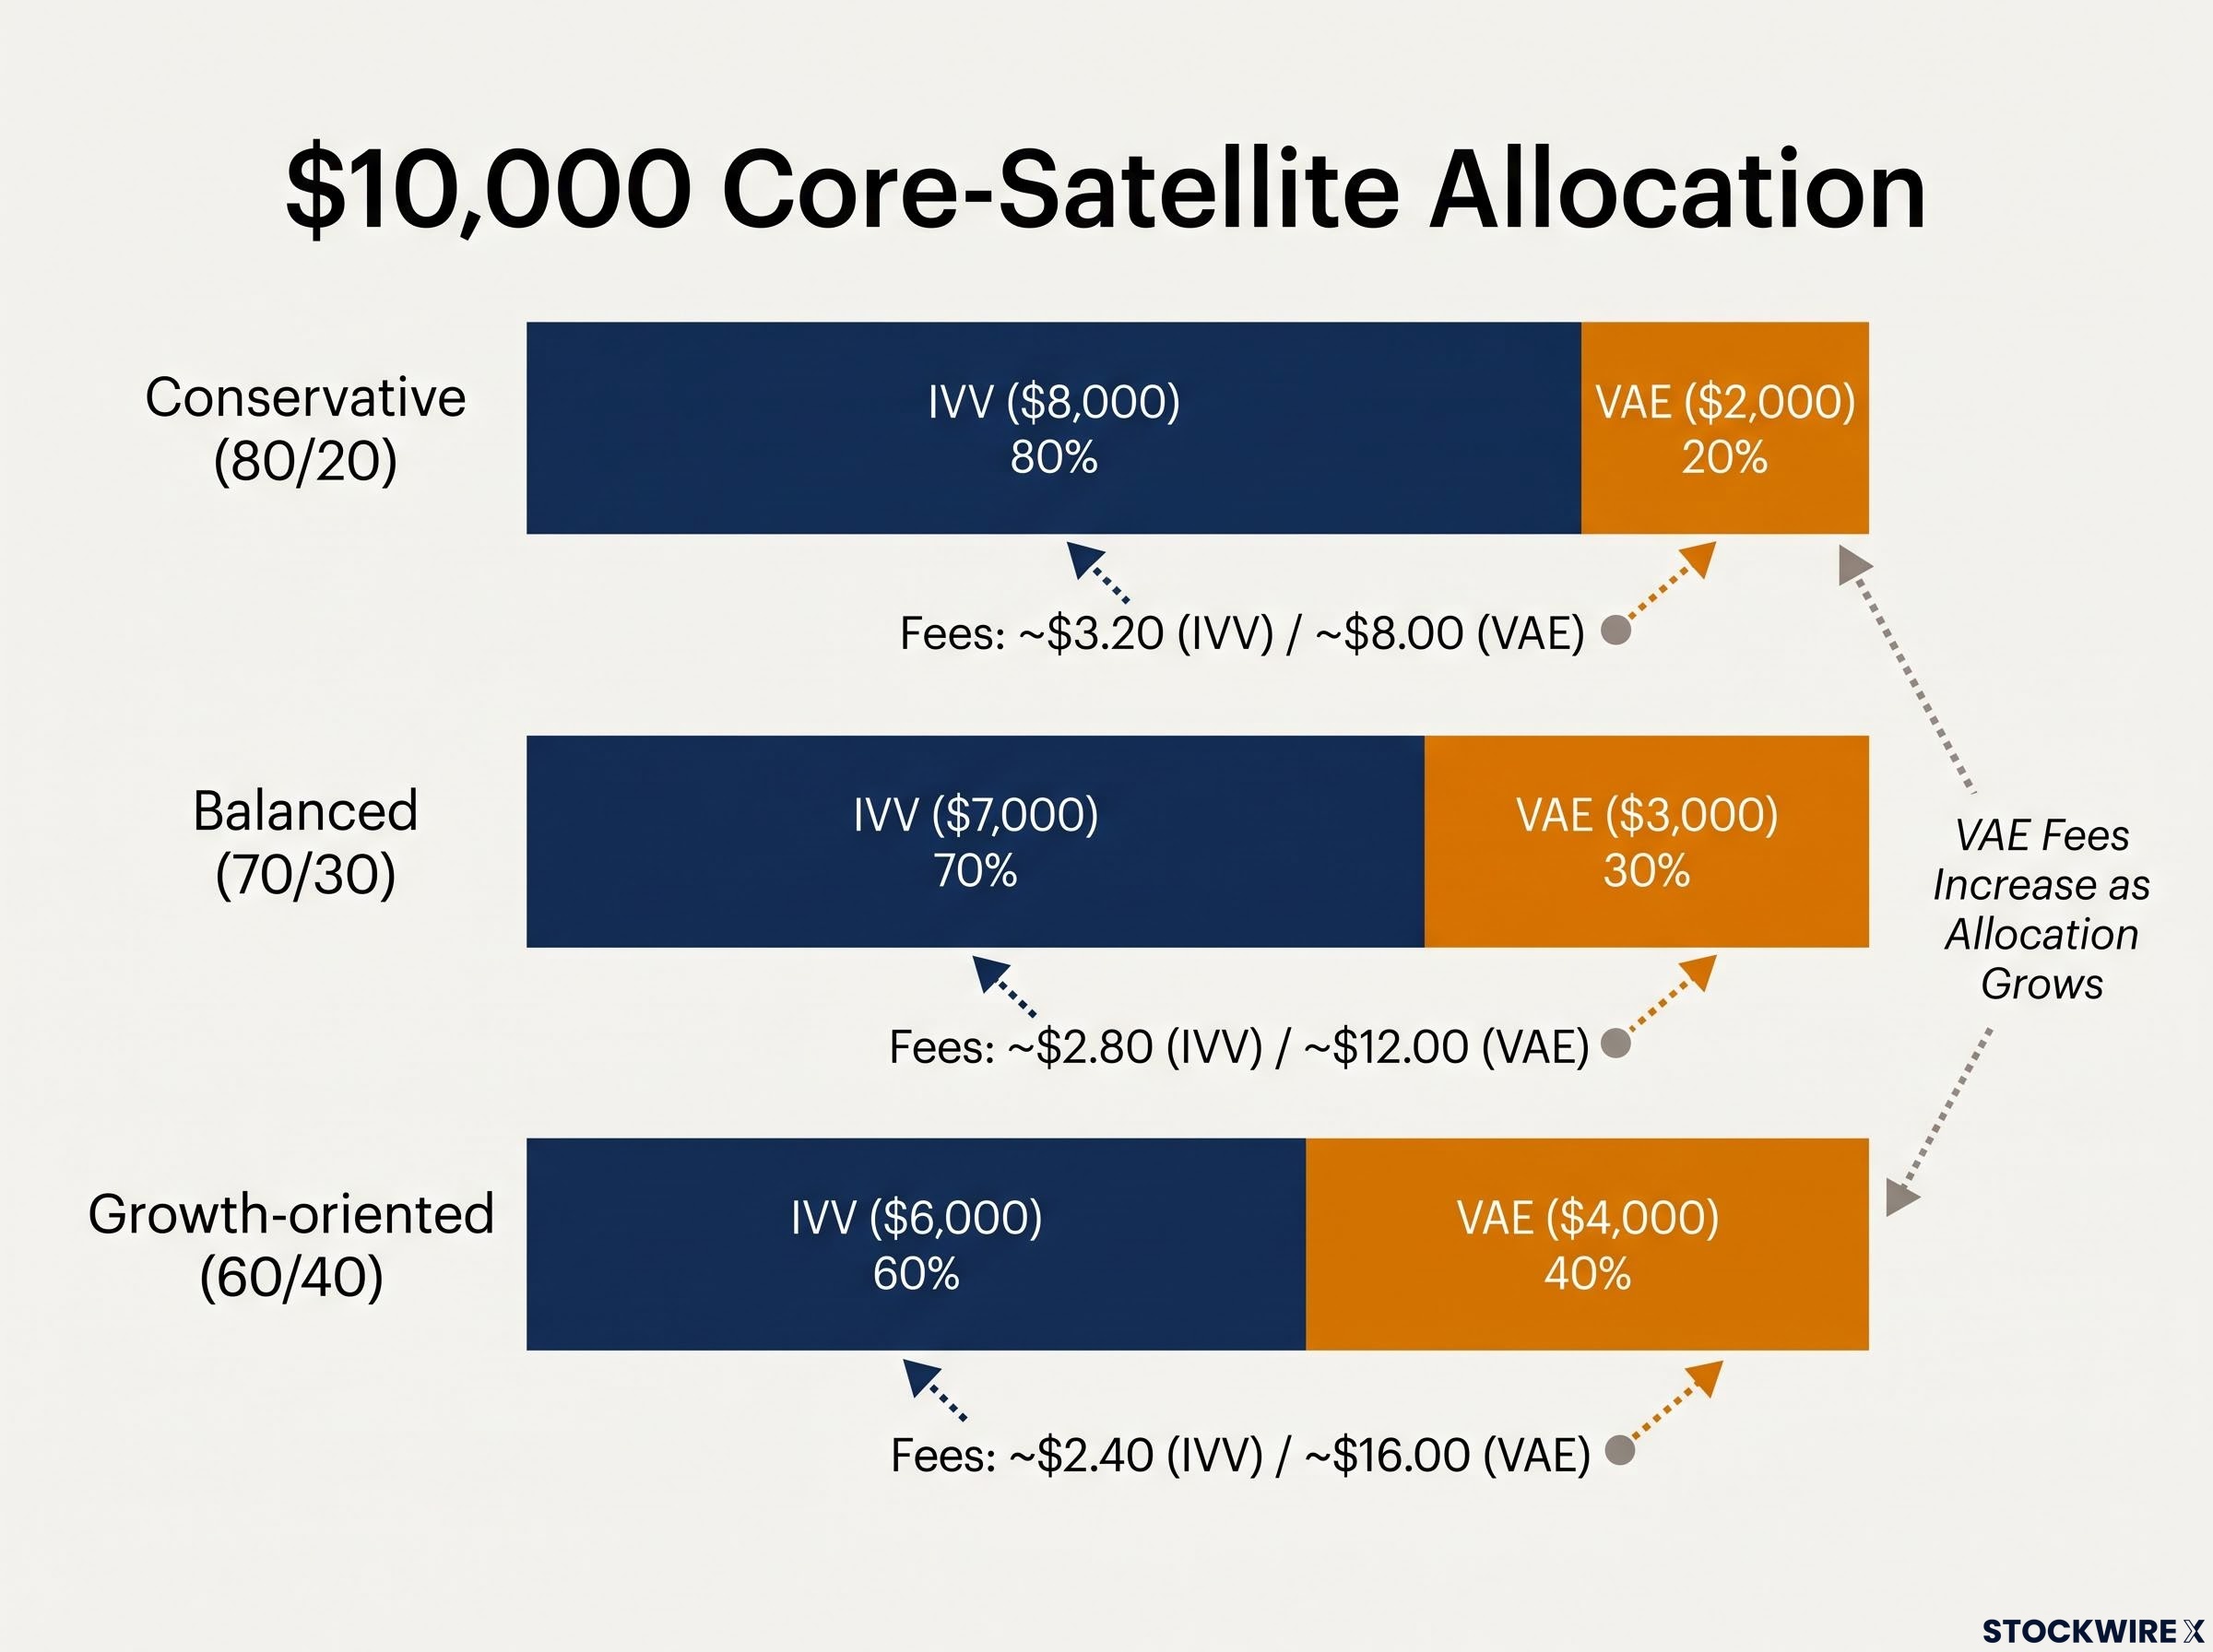
The common split runs 60-80% to IVV as the core and 20-40% to VAE as the satellite, with the exact weighting driven by your risk tolerance, time horizon, and view on Asian markets. Putting dollars to those percentages makes the trade-off concrete.
At an 80/20 split, you hold $8,000 in IVV (about $3.20 in annual fees) and $2,000 in VAE (about $8). Push to a 60/40 split and you hold $6,000 in IVV (about $2.40) and $4,000 in VAE (about $16). The more you tilt toward Asia, the more your total fee drag climbs, because VAE costs ten times as much to hold.
| Investor profile | IVV allocation | VAE allocation | IVV annual fee | VAE annual fee |
|---|---|---|---|---|
| Conservative (80/20) | $8,000 | $2,000 | ~$3.20 | ~$8.00 |
| Balanced (70/30) | $7,000 | $3,000 | ~$2.80 | ~$12.00 |
| Growth-oriented (60/40) | $6,000 | $4,000 | ~$2.40 | ~$16.00 |
Your superannuation should inform this decision. If you are already heavily exposed to Australian equities through super, you have a stronger case for a larger international allocation overall, which strengthens the argument for building out both positions rather than staying domestic.
ETF educators generally suggest a progressive build-out rather than committing to a complex split on day one. The conventional sequencing looks like this:
- Establish your IVV core position first, giving you broad, cheap developed-market exposure as the foundation.
- Assess your superannuation’s domestic equity exposure before adding VAE, so you understand your true total tilt.
- Review and rebalance annually as your conviction in the Asian growth thesis evolves.
For most readers starting with $10,000, the conservative 80/20 split is the rational entry point. It keeps your total fee drag to roughly $11.20 per year while still giving you meaningful exposure to both regions, and it leaves room to tilt toward Asia later as your conviction builds.
The core-satellite framework answers a question this guide raises but cannot fully resolve in a single section: how to decide the precise boundary between your IVV core and any satellite position, what thesis each satellite must express, and how to rebalance across positions without triggering unnecessary capital gains events.
Matching the right allocation to your investment horizon and risk profile
Pull the threads together and the picture is clear. IVV, with its 0.04% MER and AUD 14.8 billion in assets, is the lower-friction, higher-conviction anchor that suits most Australian investors as a starting point. VAE is the higher-cost, higher-risk satellite that earns its place only if you want deliberate exposure to Asian growth.
The direction you lean depends on what you already own. If your super has you drowning in bank and miner exposure, a larger international allocation makes sense, but VAE’s combined 53% weight across Taiwan and China is a geopolitical concentration to size deliberately, not to accept passively.
Three variables should drive your ongoing rebalancing, not your initial split:
- The AUD/USD trajectory, because both funds are unhedged and currency moves affect your offshore returns before the underlying shares do.
- The Chinese policy and regulatory environment, given VAE’s roughly 24% China weight and the sensitivity of that market to intervention.
- US mega-cap technology valuations, given IVV’s roughly 39-40% technology concentration and how much of its performance rides on a few names.
The key takeaway is not which fund wins in isolation. It is which combination, at which weighting, best reflects your actual time horizon, risk capacity, and existing exposures through super and Australian shares. Neither fund is a set-and-forget holding, so an annual review of your split against your circumstances is the minimum standard worth holding yourself to.
For readers wanting to build out beyond this IVV-VAE starting point, our dedicated guide to structuring an ETF portfolio covers how asset allocation decisions between growth and defensive assets drive long-term outcomes more than fund selection, with worked examples for common Australian investor profiles.
This article is for informational purposes only and should not be considered financial advice. Investors should conduct their own research and consult with financial professionals before making investment decisions. Past performance does not guarantee future results. Financial projections are subject to market conditions and various risk factors.