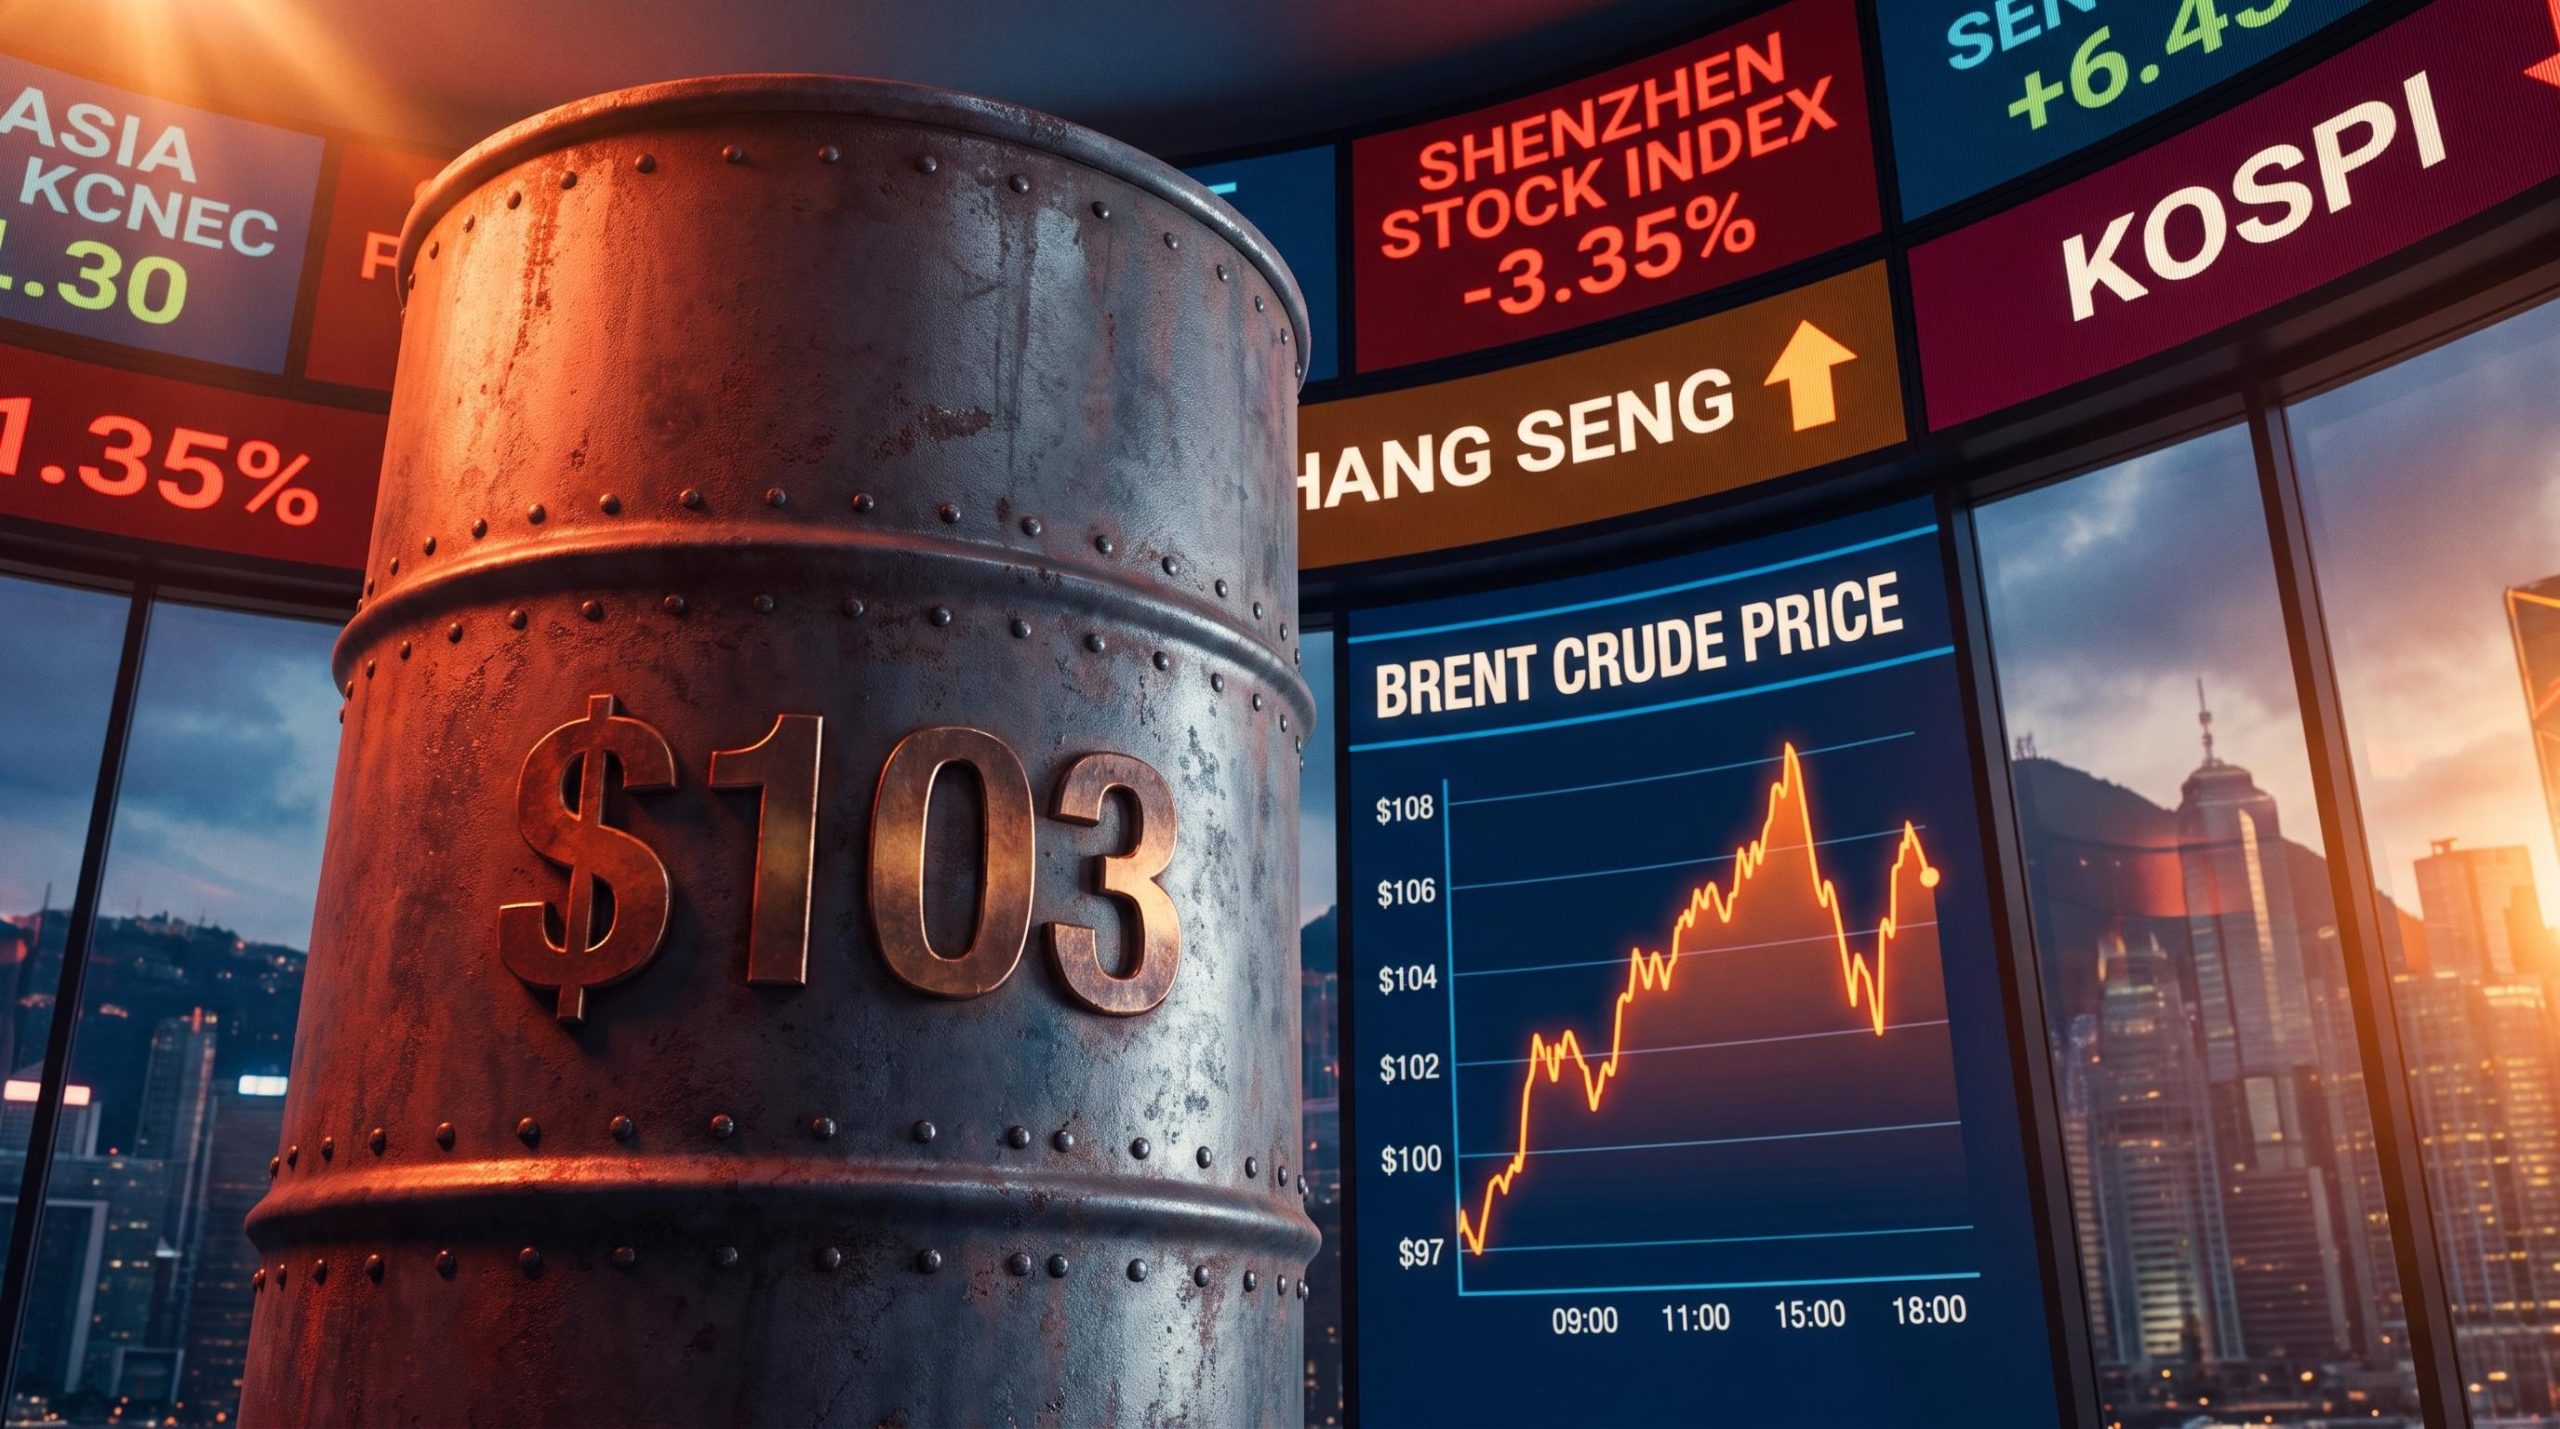
Crude oil above $100 per barrel. US Treasury yields at multi-decade highs. And a US naval blockade choking the world’s most important oil shipping lane. For Asian equity markets, the question in late September 2026 is not whether these pressures hurt, it is which markets, which sectors, and for how long.
The US-Iran standoff over the Strait of Hormuz has moved through three distinct escalation episodes since mid-July 2026, each producing the same pattern: a sharp oil spike, a broad Asian equity selloff, and then a partial unwind as supply-recovery narratives emerge. The current episode, following a US strike on an Iranian island in early September, sent Brent from approximately $97 to a peak above $108 before easing to around $103.
Asian indexes have absorbed varying degrees of that shock, with declines ranging from negligible to severe depending on market structure and sector composition. This analysis maps the transmission chain from geopolitical event to oil price to equity market impact, identifies which markets took the most damage and why, and lays out the conditions under which the current selloff either deepens into a sustained inflation shock or reverses as risk premium unwinds.
How the Strait of Hormuz became a macro risk event for Asian investors
The pattern is worth watching unfold in sequence, because the sequence is the point. Three separate escalation episodes since mid-July 2026 have each moved through the same chain: a geopolitical trigger, an oil spike, and an Asian equity selloff. Reading them in order reveals a mechanism, not a series of accidents.
- Mid-July 2026 (blockade reinstatement): Washington reinstated a blockade on Iranian shipping and imposed a 20% charge on cargo moving through the Strait of Hormuz, accompanied by renewed military strikes. According to Investing.com, oil extended a 10% Monday rally toward one-month highs, and Asian equities weakened on inflation and supply-disruption fears.
- Late August 2026 (Hormuz shutdown and counter-blockade): Tehran kept the Strait shut while Washington enforced a naval counter-blockade. Yahoo Finance reported oil jumping approximately 2.5% as peace talks stalled, with energy shares gaining even as broader indexes stayed constrained.
- Early September 2026 (US strike on an Iranian island): The US hit an Iranian island in the Strait, triggering tit-for-tat attacks. Channel NewsAsia reported crude spiking around 10% in a week, with Brent reaching $97 on 7 September before further gains.
Each episode compressed the same reflex into a shorter window.
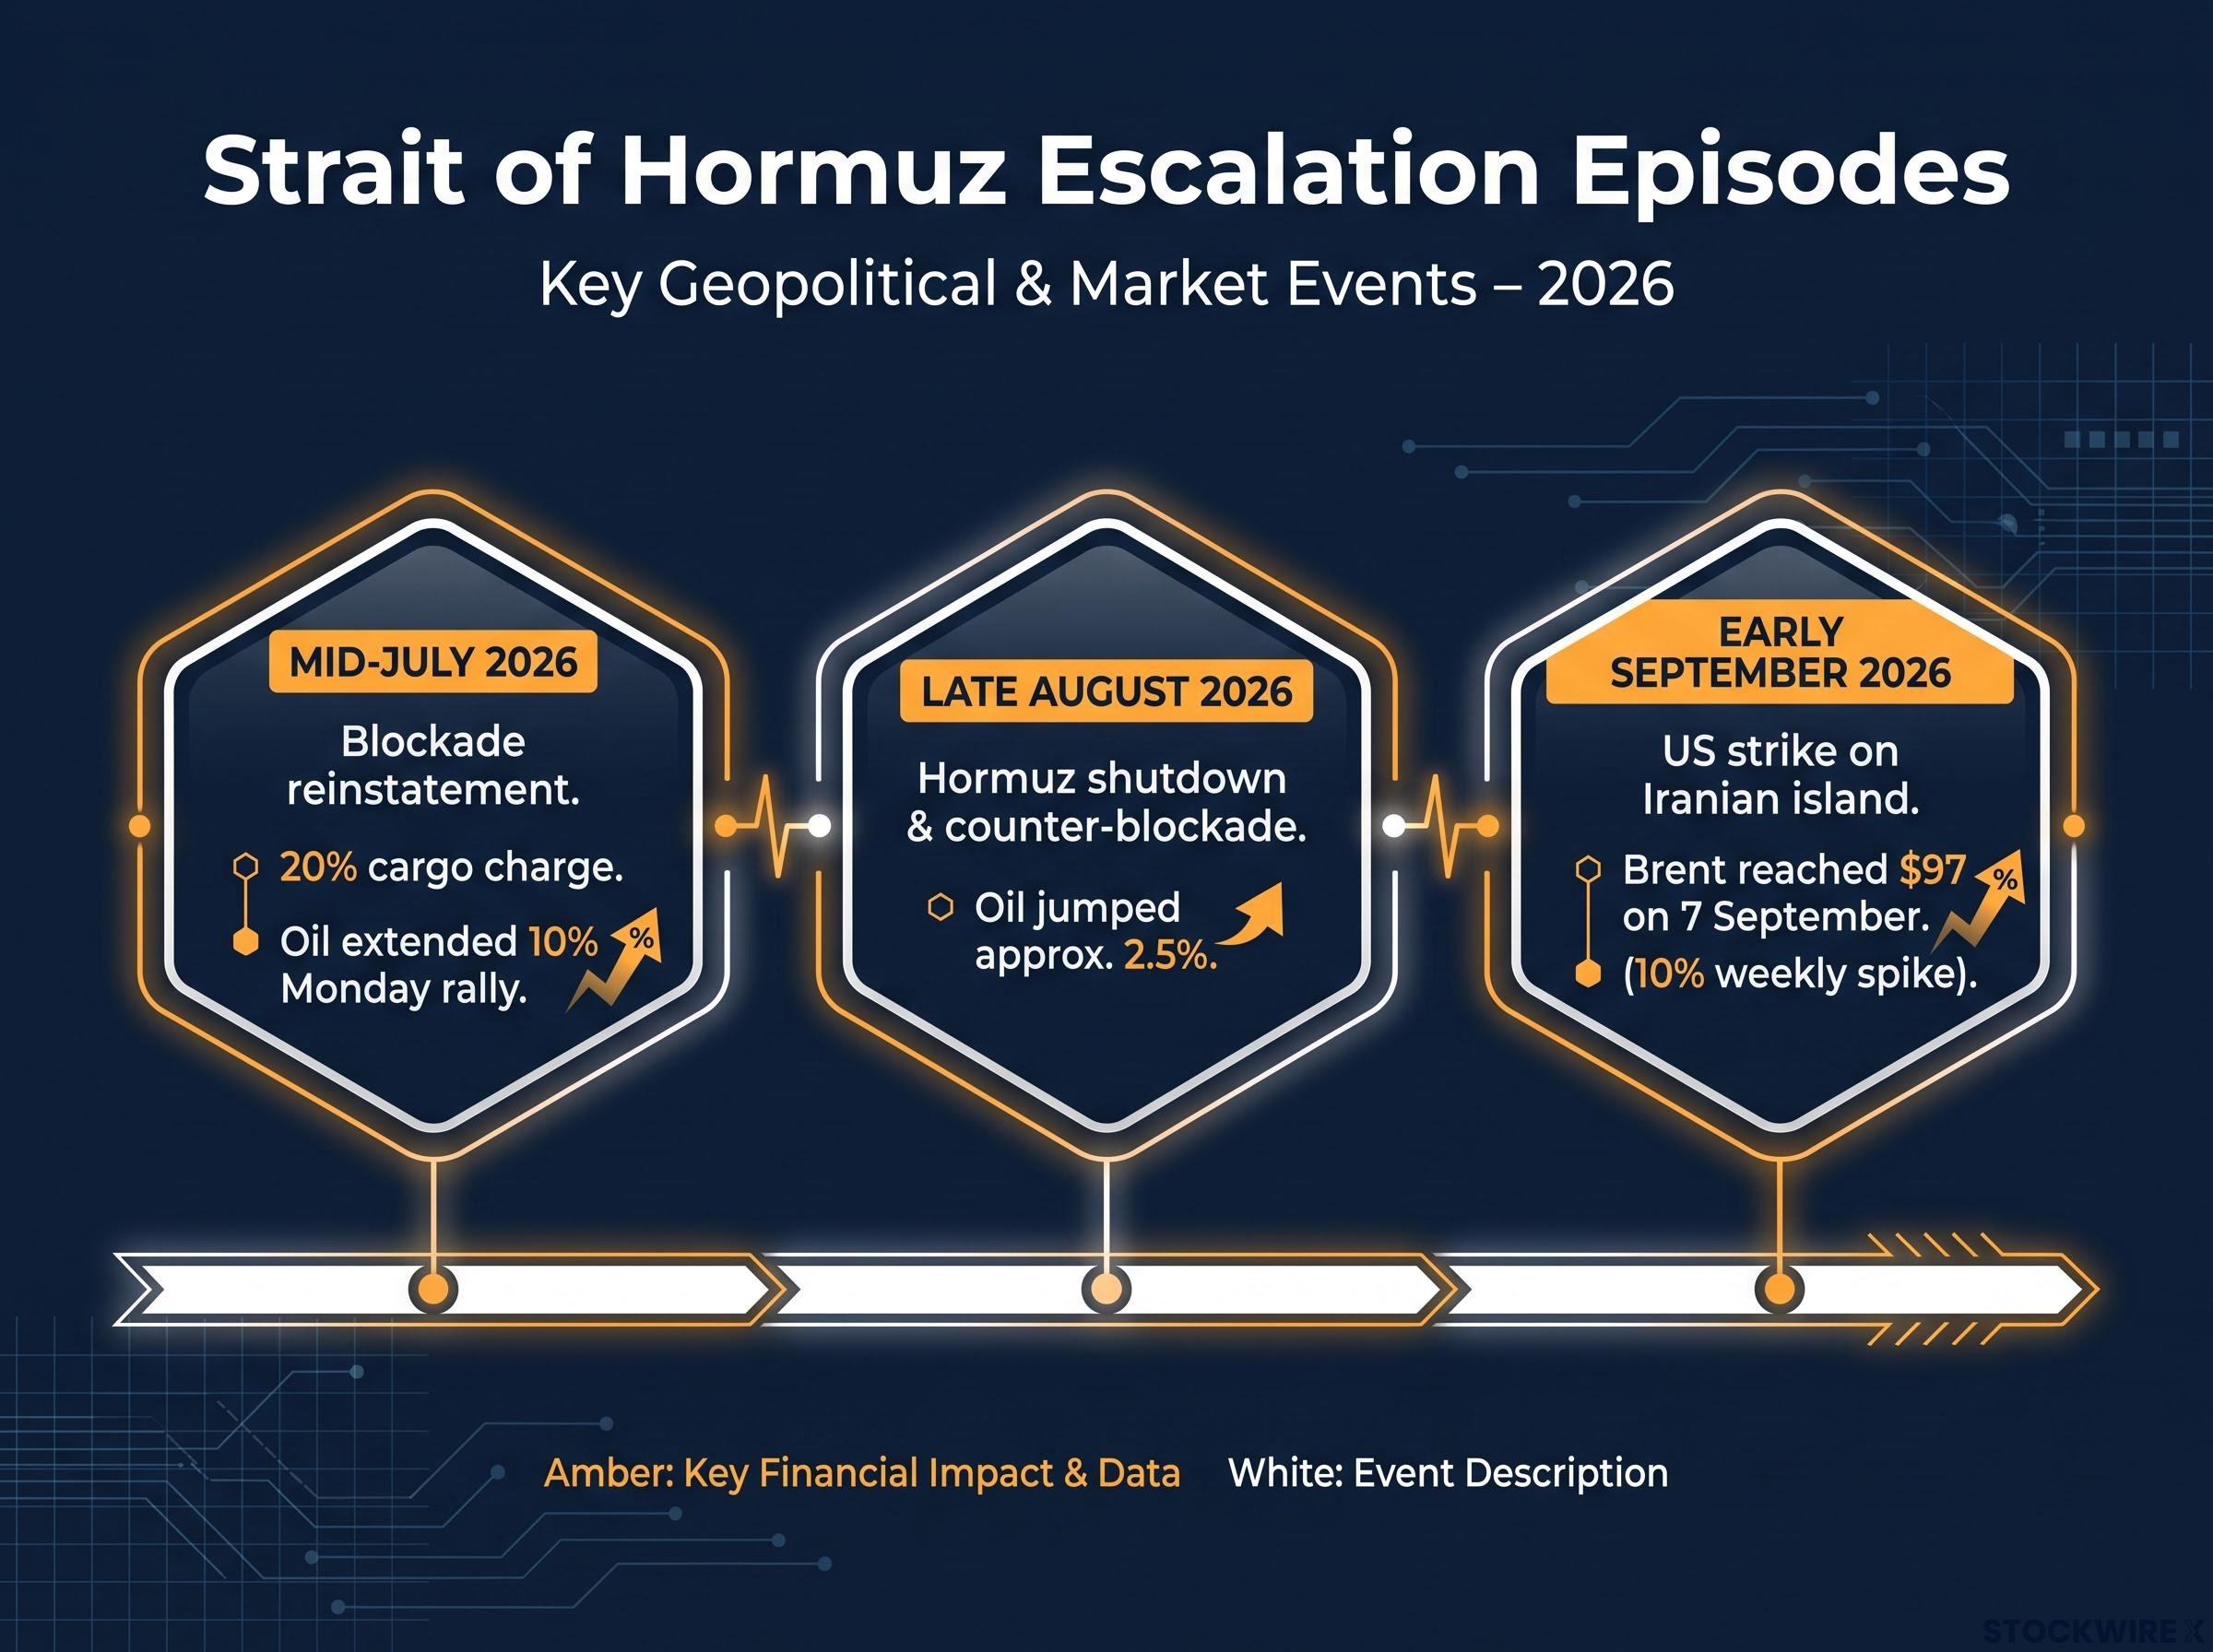
Crude “spiked around 10 per cent this week” after the United States struck an Iranian island in the Strait of Hormuz, according to Channel NewsAsia, triggering tit-for-tat attacks and another surge in oil prices.
What ties these episodes together is that markets have not been persuaded that any of them resolves the underlying dispute. Iran has shown no sign of softening its negotiating position. President Donald Trump indicated he anticipated talks to resume, as reported by Reuters, but investors remained unconvinced that a near-term ceasefire was achievable.
Shipping crisis data from August 2026 established the baseline against which September’s deterioration should be measured: commercial transits had already collapsed to just 3-14 vessels per day against a pre-war norm of 120-140, with war-risk insurance running at approximately 30 times normal rates and maritime unions classifying Hormuz as an active war zone, conditions that no diplomatic declaration alone can quickly reverse.
Here is what the repetition tells you. This is not a one-off spike driven by a single headline; it is a conflict dynamic with established market reflexes. Until the dispute itself is resolved, every fresh escalation headline carries credible price-impact risk, which means Asian markets are not simply reacting to news but pricing in a recurring, structural threat.
The EIA Hormuz chokepoint analysis quantifies roughly 21 million barrels per day transiting the strait, a volume large enough that even a partial disruption translates immediately into global supply anxiety and justifies the scale of the oil spikes observed across all three 2026 episodes.
When big ASX news breaks, our subscribers know first
Oil above $100 and yields at multi-decade highs: why Asian markets absorb a double shock
The severity of the Asian selloff makes more sense once you stop treating it as a single-variable event. Two pressures are operating at once, and they reinforce each other rather than acting in isolation.
The first is the oil-import channel. Asia is a heavy net importer of Gulf crude, so a Hormuz-driven spike feeds almost immediately into corporate input costs, wider trade deficits, and higher inflation. Investing.com linked the renewed tensions directly to reviving inflation concerns across the region, and Channel NewsAsia framed the roughly 10% weekly spike as a material cost shock for the region’s large net-importers.
The second is the yield channel, and it works through a different door. Channel NewsAsia reported bond yields at multi-decade highs, with investors ramping up rate-hike bets in response to the oil surge. Elevated US Treasury yields pull capital toward dollar assets and raise the discount rate applied to future earnings, which compresses equity valuations regardless of what oil does.
Treasury yields above 5% were already functioning as a master variable across gold, Bitcoin, and equities before the September Hormuz escalation added a second compression force; a single Treasury buyback announcement on 19 August 2026 pulled longer-dated yields lower and sent spot gold up 4% in one session, illustrating how sensitive risk assets had become to yield direction before oil added another layer of pressure.
The trajectory of crude across September shows how sharply the first pressure built.
| Date | Brent | WTI | Primary driver |
|---|---|---|---|
| 7 September 2026 | ~$97 | Not stated | ~10% weekly gain after US-Iran vessel escalation |
| Mid-September 2026 (peak) | ~$108 | ~$104-$105 | 7% overnight surge to four-month highs |
| 21 September 2026 | ~$103 | ~$99 | Saudi supply-recovery narrative partly offsets Hormuz risk |
CNBC TV18 reported a 7% overnight surge, with WTI trading around $104 and Brent above $108 in early Asian trade, describing these as four-month highs and the best weekly performance since July.
The two channels do not simply add together; they amplify one another. Oil-driven inflation strengthens the case for tighter policy, which pushes yields higher, which then deepens the valuation pressure beyond what either force would produce alone. STL.News captured the loop, tying “renewed expectations for higher interest rates” to rising oil and US-Iran tensions weighing on Asian and global markets. Yahoo Finance noted oil’s jump partially offsetting otherwise negative pressure from high bond yields, confirming both were live at once.
For anyone holding Asian equities, that interaction is the read that matters. This is not a temporary disruption but a structural compression of the risk-reward calculus, because both forces need to ease simultaneously for valuations to recover meaningfully. A partial improvement in one, while the other holds, is unlikely to be enough.
Not all markets fell equally: reading the divergence across Asian indexes
The headline “Asian markets slide” hides the more useful story. Look at the Monday session data, and what emerges is a range of outcomes, not a uniform risk-off wave.
| Index | Country | Move | Level |
|---|---|---|---|
| Shenzhen Stock Index | China | -3.35% | ~12,870 |
| KOSPI | South Korea | -2.15% | ~6,925 |
| Shanghai Composite | China | -1.75% | ~3,820 |
| BSE Sensex | India | -1.30% | ~72,945 |
| NIFTY 50 | India | -1.25% | ~22,855 |
| Taiex | Taiwan | -0.28% | ~48,025 |
| Nikkei 225 | Japan | -0.06% | ~66,330 |
| Hang Seng | Hong Kong | +0.65% | ~24,665 |
That spread, according to FXStreet data authored by Lallalit Srijandorn, runs from Shenzhen down 3.35% to the Nikkei essentially flat at -0.06%, with Hong Kong’s Hang Seng actually up 0.65% on the session. One shock, transmitted very differently.
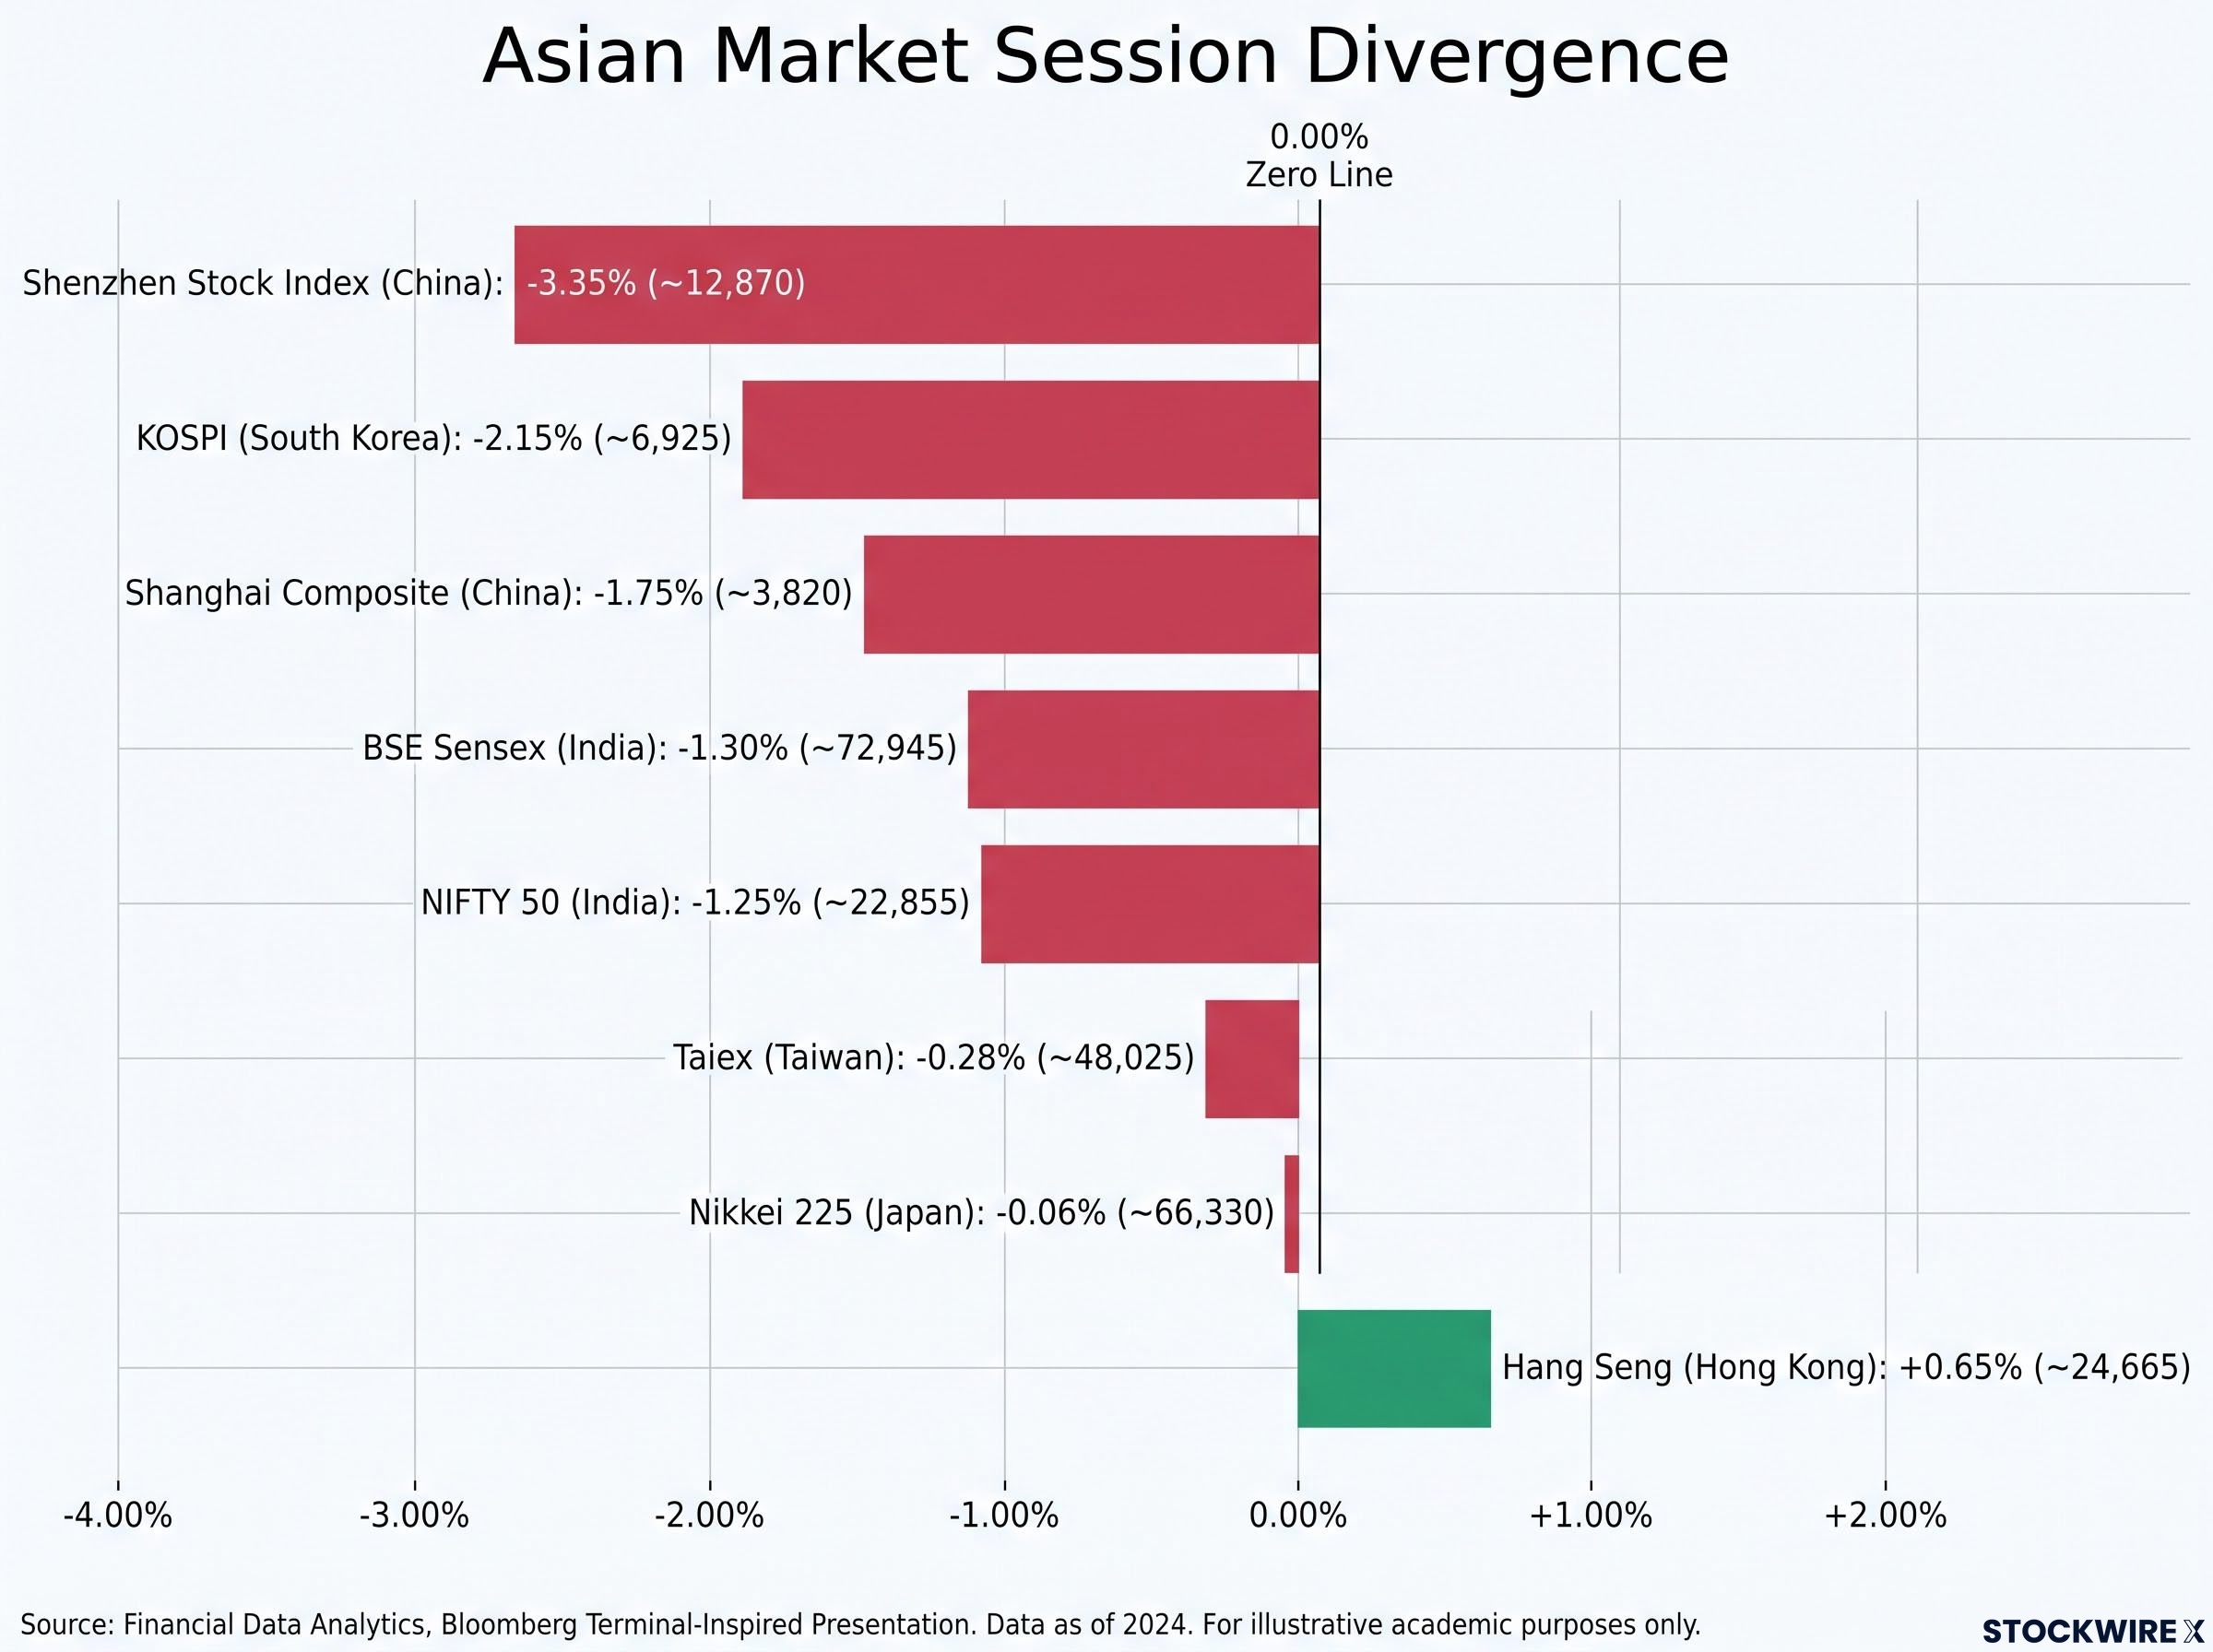
The KOSPI’s roughly 2.15% decline was not a pure macro move. It came substantially from profit-taking in large-cap technology shares, a rotation dynamic rather than a broad flight from Korean risk. Shenzhen and India’s Sensex, down 3.35% and 1.30% respectively, anchor the steeper end of the range and show how much the impact varied by market composition.
The Hang Seng’s gain is the honest anomaly here. No directly sourced analyst explanation for that single-session outperformance was located in available coverage, and it proved short-lived: late-September snapshots (25-28 September) show the Hang Seng back down around 1.01% at 24,510.09. The divergence was real but not durable.
The spread between Shenzhen and the Nikkei tells you something specific. Exposure to this shock is not a regional story but a composition story. What a market holds determines how much it hurts, and that distinction is where portfolio-level risk actually lives.
Sector rotation, not uniform risk-off
The clearest evidence that this is rotation rather than blanket selling comes from the sector split. Investing.com reported Asian energy producers and refiners gaining as crude rebounded, benefiting directly from the same oil spike that dragged rate-sensitive and domestic-demand sectors lower.
The contrast within technology is just as telling. South Korean large-cap tech saw profit-taking, yet STL.News noted semiconductor names in Japan and South Korea powering strong sessions elsewhere in the period. The sell signal was selective, not broad.
Treat index performance as a blunt instrument here. The headline decline overstates weakness in specific sub-sectors, and your individual exposure to energy, exporters, or rate-sensitive domestic names matters far more than the number at the top of the screen.
Index-level divergence driven by a single large-cap name is not a September 2026 phenomenon; the KOSPI bucked the regional downtrend on 18 May 2026 purely because Samsung Electronics rebounded on government-mediated labour talks, confirming that composition effects can decouple a national index from regional macro trends in either direction and on short timeframes.
When does the selloff reverse, and what makes it deepen instead?
The forward path splits into two genuinely competing scenarios, each with different trigger requirements. Knowing which triggers to watch is more useful than a single directional call.
The reversal case rests on the oil premium unwinding. Saxo’s Asia Market Quick Take put Brent around $108.08 and WTI at $105.12 at the mid-September peak, while stressing that some risk premium was already being pared back as markets reassessed the threat level.
“Some risk premium is pared back” as markets reassess the threat level, according to Saxo’s Asia Market Quick Take, implying a portion of the oil spike is geopolitical premium that can unwind quickly if tensions ease.
The conditions that would trigger a reversal are identifiable:
- A credible ceasefire signal or Hormuz shipping-security assurance that lets the oil risk premium unwind
- Inflation data or central-bank commentary that underplays the oil shock, reducing rate-hike bets
- Continued supply-recovery narratives, with Gulf News reporting Brent easing to approximately $103.00 and WTI to $99.22 on 21 September 2026 as Saudi recovery offset Hormuz risk
The deepening case is qualitatively different, and it hinges on time. If oil holds near or above $100 for an extended stretch, second-order effects take hold.
The conditions that would deepen the selloff:
- Oil remaining near or above $100 long enough to embed inflation expectations
- Higher transport and food prices feeding through, which Channel NewsAsia flagged as the primary downside risk
- Persistent oil strength reviving inflation concerns sufficient to alter medium-term rate paths, per Investing.com
- Key US CPI data confirming a durable inflation impulse, forcing more aggressive tightening than currently priced
The variable to watch is not the day-to-day oil price but whether the risk premium in crude starts to look structural rather than episodic. That is the threshold at which a manageable disruption becomes a durable repricing of Asian equity risk, and it is trackable in real time through inflation prints and the persistence of high oil.
What the current episode tells you about pricing geopolitical risk in Asian equities
Step back from the individual data points and a repeatable model emerges. Across the three 2026 episodes, mid-July, late August, and early September, the chain ran the same way each time: a Hormuz threat, an oil spike, an inflation fear, rate-hike pressure, a broad equity selloff, and then a partial unwind as risk premium eased.
That model reduces to three moving parts:
- Trigger: A direct US-Iran escalation over Hormuz shipping
- Amplification: Oil spikes in the mid-single-digit to low-double-digit range, feeding inflation fear and higher yields
- Unwind condition: A supply-recovery or de-escalation narrative that lets the risk premium deflate
Two variables decide whether any given episode is a trading disruption or a structural repricing: how long oil stays elevated, and how far inflation expectations become embedded. The current partial retracement, Brent falling from above $108 to around $103, shows the unwind mechanism already working within this episode.
The practical takeaway is that in a conflict with established and repeating market reflexes, the edge lies not in predicting the next escalation but in understanding how fast the reversal activates once the risk premium has room to unwind. The asymmetry is in the speed of the bounce, not the certainty of the fall.
For investors wanting to translate the repeating Hormuz escalation model into standing portfolio decisions, our comprehensive walkthrough of geopolitical portfolio positioning covers gold allocation targets, bond duration awareness, rebalancing discipline, and defence sector exposure using data from the 2025-2026 crisis cycle.
This article is for informational purposes only and should not be considered financial advice. Investors should conduct their own research and consult with financial professionals before making investment decisions.
Past performance does not guarantee future results, and the scenarios described here are speculative and subject to change based on market and geopolitical developments.