What Social Media Stock Promotions Actually Do to Prices
2 hrs ago
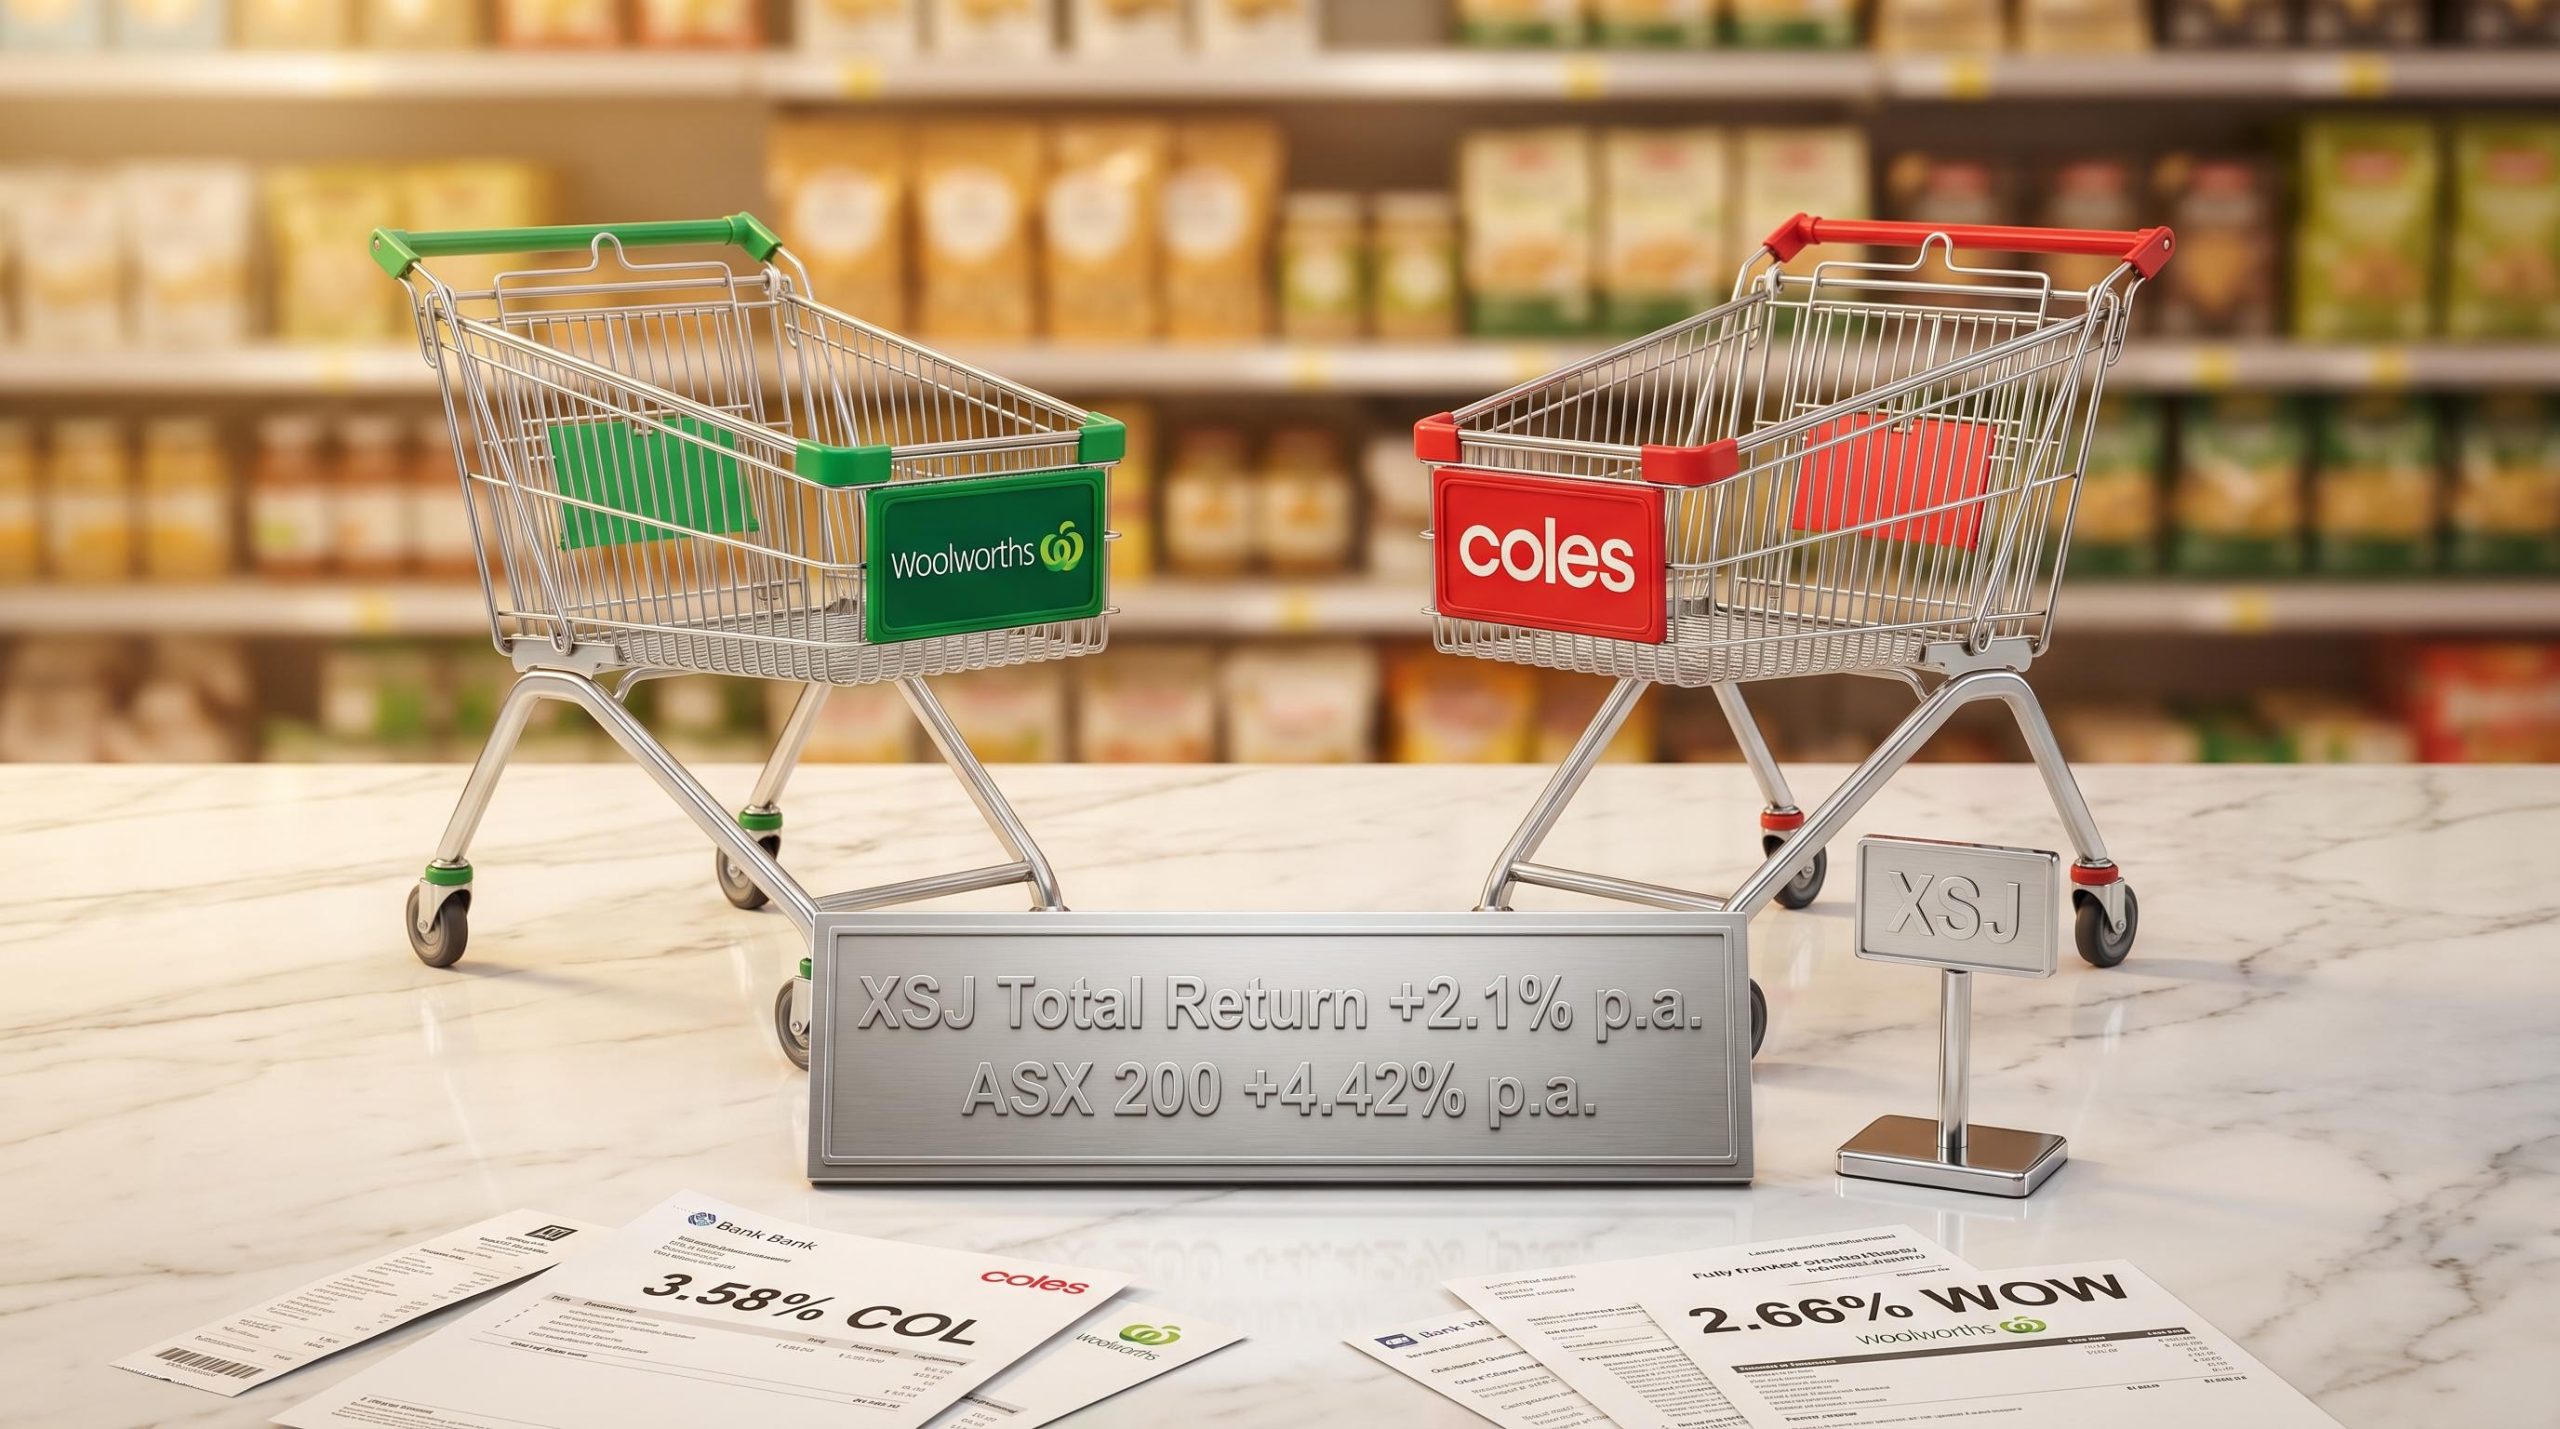
The S&P/ASX 200 Consumer Staples Index has delivered an annualised price return of -0.72% over five years. Over the same period, the broader ASX 200 returned +4.42% annually. Yet sophisticated fund managers keep buying Woolworths, Coles, and their peers, often increasing allocations while the price chart flatlines.
Consumer staples is one of the most persistently misunderstood sectors in Australian equities. Retail investors often interpret underperformance as a signal to avoid a sector entirely. Institutional allocators read the same data and draw the opposite conclusion. That gap in interpretation reveals something important about how defensive sectors actually function inside a portfolio.
This article explains why ASX consumer staples stocks lag during bull markets, what they are actually designed to do, and under what conditions an Australian investor might rationally choose to own them, even when the index chart looks discouraging.
On a price return basis, the numbers are striking.
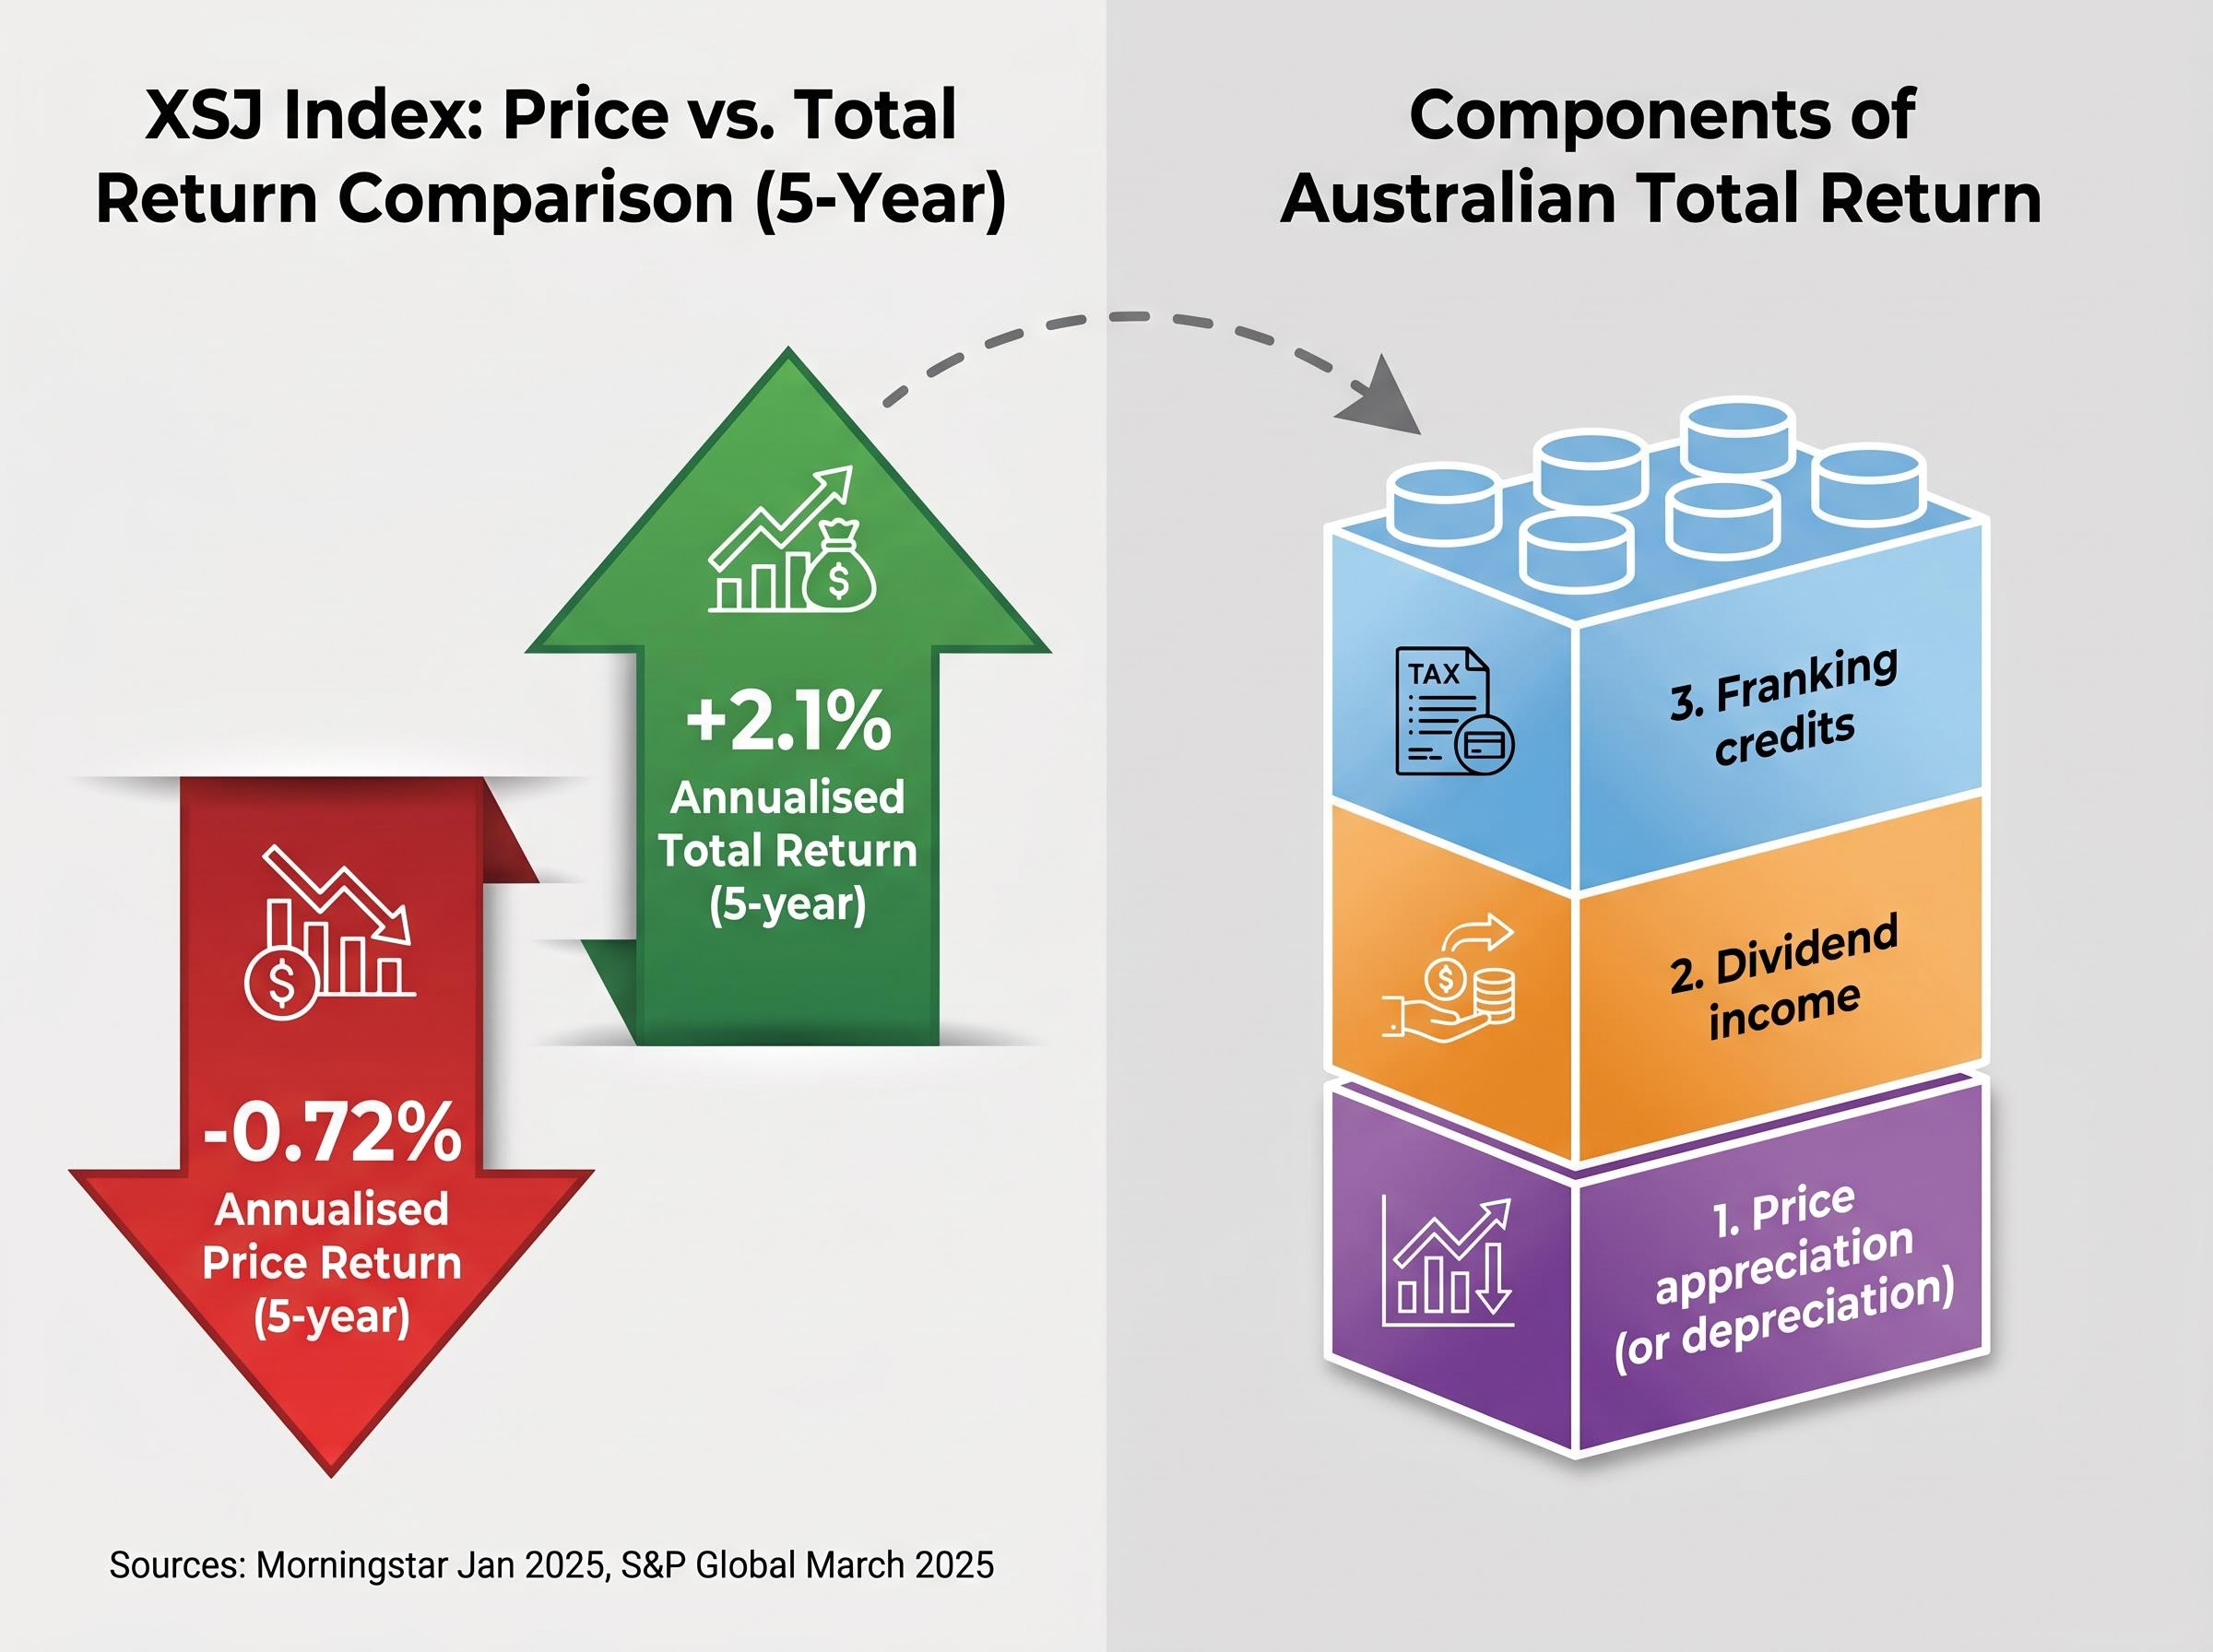
The S&P/ASX 200 Consumer Staples Index (XSJ) returned -0.72% annualised over five years (Morningstar, January 2025), while the ASX 200 delivered +4.42% annually over the same period. That is a gap of more than five percentage points per year.
Taken at face value, the comparison makes consumer staples look like a drag on any portfolio that held them. But price return is only one component of what shareholders actually received.
Price return indices exclude dividends. For a sector where companies like Coles (COL) have averaged a 3.76% annual dividend yield over five years, stripping out income produces a fundamentally incomplete picture. The XSJ total return figure, which includes reinvested dividends, comes in at approximately +2.1% per annum, according to S&P Global data from March 2025.
The distinction between price return versus total return is foundational to evaluating any income-oriented sector: on the ex-dividend date, a share price falls by approximately the amount of the dividend paid, meaning shareholders are not receiving new wealth but rather converting a portion of their equity into cash, a dynamic that makes yield in isolation a structurally incomplete performance measure.
The gap between -0.72% and +2.1% is the dividend. And for Australian resident investors, even the total return figure understates the real outcome, because franking credits are not captured in any index return.
Total return from an Australian equity has three components:
Judging consumer staples solely on price return is like evaluating a seatbelt by how fast it makes the car go. The metric is real, but it measures the wrong thing.
The defensive characteristics of staples are not a market mood or a temporary rotation trade. They are structural features of the underlying businesses.
Consumer staples companies sell products people buy regardless of economic conditions: groceries, household essentials, alcohol. Demand for these goods is relatively inelastic, meaning it does not swing dramatically with employment data, interest rate decisions, or consumer confidence readings.
The major ASX constituents operate businesses with dominant market positions and pricing influence:
A company with 28% grocery market share can influence prices rather than simply accept them. That pricing power protects margins during inflationary periods and provides earnings visibility that growth sectors cannot match.
The XSJ carries a beta of approximately 0.55-0.6 versus the broader market, meaning it historically moves roughly half as much as the ASX 200 in either direction. That is not an accident of recent trading. It is a structural expression of what these businesses do.
The defensive thesis is not theoretical. It has been tested repeatedly across the past 18 months, and the pattern is consistent.
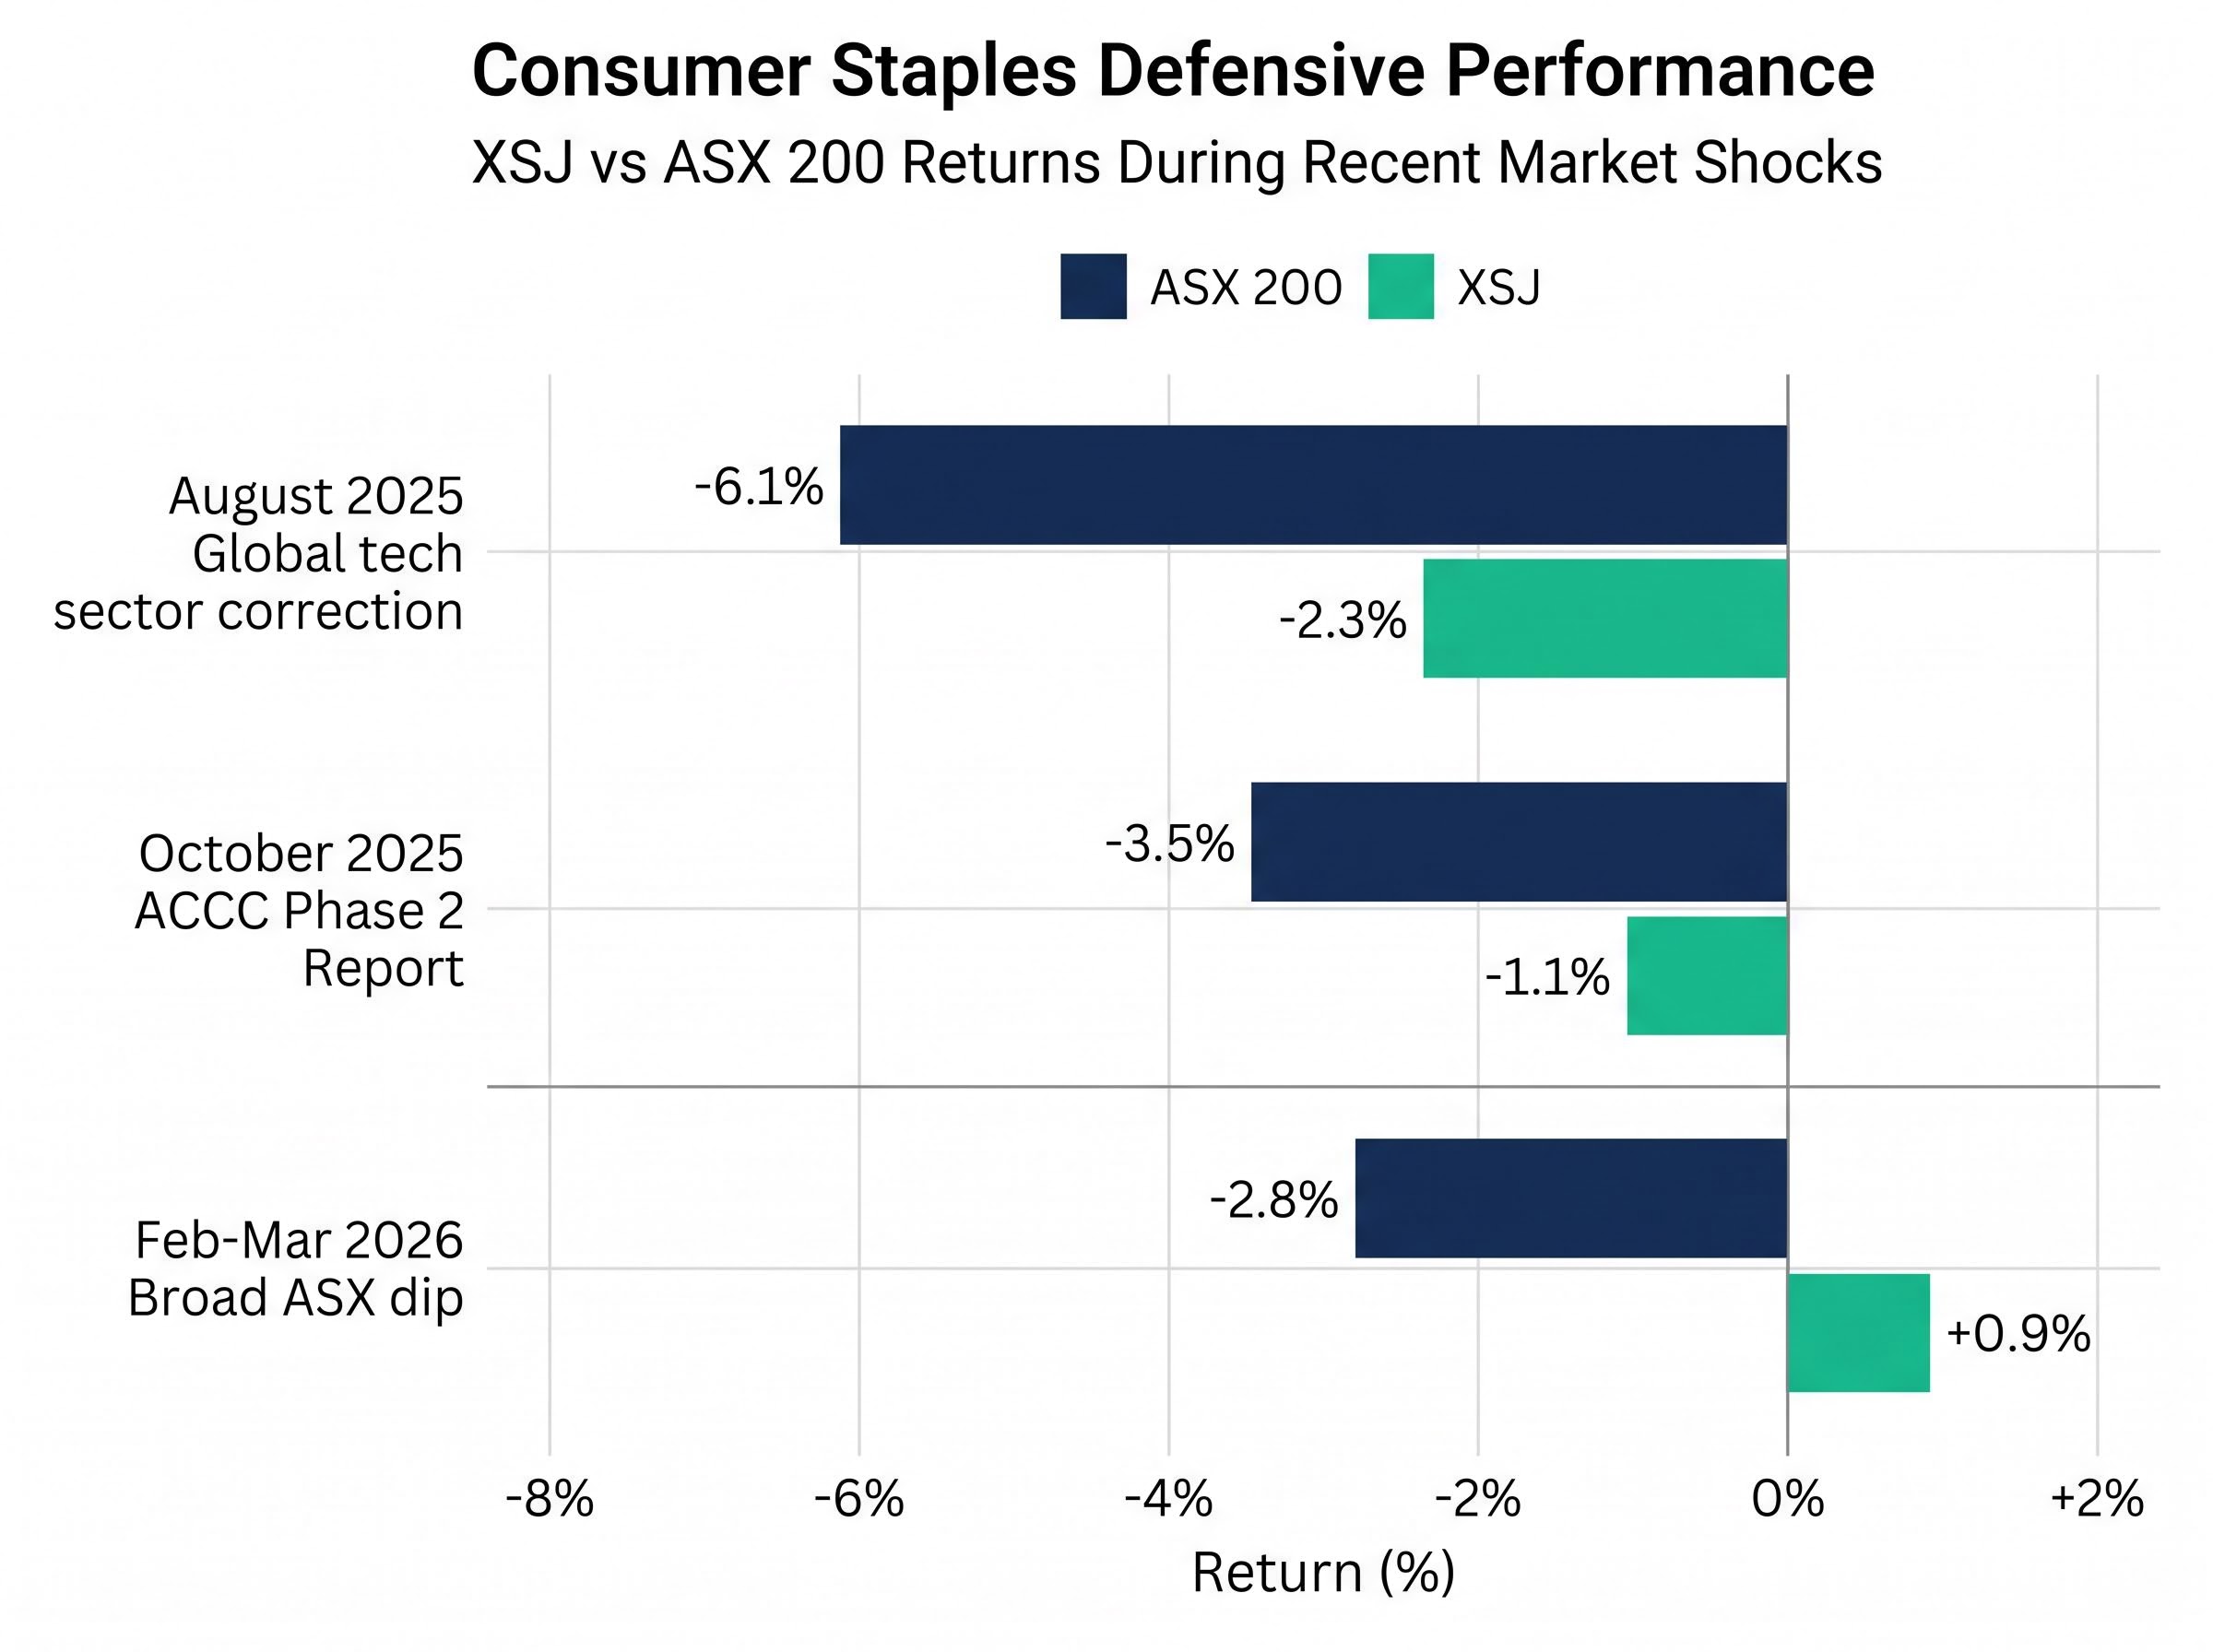
| Period | Market Event | XSJ Return | ASX 200 Return |
|---|---|---|---|
| August 2025 | Global tech sector correction | -2.3% | -6.1% |
| October 2025 | ACCC Phase 2 Report release | -1.1% | -3.5% (weekly) |
| Feb-Mar 2026 | Broad ASX dip | +0.9% | -2.8% |
In August 2025, when the ASX 200 fell 6.1% during a global tech correction, the XSJ fell only 2.3%. Coles actually rose 1.2% that month. Woolworths finished approximately flat. The sector absorbed a shock that cost diversified portfolios significantly more.
By February-March 2026, the pattern had intensified. The XSJ posted a positive 0.9% return while the ASX 200 dropped 2.8%. After the October 2025 ACCC report triggered a brief sector dip of 1.1%, staples recovered approximately +4% in November 2025.
S&P Global data from December 2025 indicated the XSJ’s maximum drawdown in 2025 was approximately -9%, compared to approximately -15% for the ASX 200.
The arithmetic of recovery explains why that gap matters more than most retail investors realise. A 15% drawdown requires an 18% gain just to return to the starting point. A 9% drawdown requires only a 10% gain. Over a decade of market cycles, that compounding difference is substantial, and it is the core institutional argument for maintaining staples allocations even during prolonged bull markets.
Compounding across market cycles rewards portfolios that minimise the depth of drawdowns rather than simply maximising peak returns: the mathematics of recovery means that a portfolio sustaining a 9% maximum drawdown reaches breakeven 37% faster than one sustaining a 15% drawdown, and that structural advantage accumulates silently over a decade of alternating bull and bear periods.
For a certain type of investor, the yield profile of consumer staples is not a consolation prize for missing capital growth. It is the primary objective.
| Company | Forward Yield (May 2026) | Franking Status |
|---|---|---|
| Coles (COL) | 3.58% | Fully franked |
| Woolworths (WOW) | 2.66% | Fully franked |
| Treasury Wine Estates (TWE) | 4.61% | Franked |
| Sector Average (XSJ) | ~3.5-4.1% | Predominantly franked |
Franking credits are tax credits attached to dividends paid from profits on which the company has already paid Australian corporate tax. For Australian resident investors, these credits either reduce their tax bill or, for those in the pension phase of a self-managed superannuation fund (SMSF), may generate a cash refund. Morgan Stanley noted in April 2025 that franking credits can boost the effective after-tax yield meaningfully for Australian resident investors.
The ATO franking credit refund rules set out the eligibility criteria under which individuals and superannuation funds can offset or receive a cash refund for credits attached to fully franked dividends, a mechanism that materially changes the effective after-tax yield calculation for SMSF trustees in pension phase relative to the headline dividend figures reported by companies.
For an SMSF in pension phase receiving fully franked dividends, the grossed-up yield, which accounts for the attached franking credits, can materially exceed the headline figure. This tax-advantaged income stream is one reason institutional and SMSF investors maintain staples allocations that headline price returns alone would not justify.
The income case is strongest in three specific scenarios:
One nuance warrants attention. Payout ratios across the sector sit in the 70-92% range. That signals income reliability, but it also creates a ceiling on dividend growth if earnings come under pressure. Bell Potter flagged this risk for Woolworths specifically in November 2025, noting payout sustainability concerns if volumes weaken further.
Payout ratios above 90% are among the clearest dividend trap signals that income investors should monitor, sitting alongside a rising yield driven by a falling share price and earnings coverage below 1.5x as the three most reliable early warnings that a distribution may be unsustainable within one to two reporting cycles.
Coles’ five-year average annual dividend yield of 3.76% compared to its current yield of approximately 3.14% reflects share price appreciation rather than dividend cuts; dividends have in fact grown. That distinction matters for income investors evaluating the trajectory.
The straightforward inflation-hedge narrative that supported consumer staples through 2022-2024 has become more nuanced in 2026. Investors considering the sector today face a specific mix of headwinds and tailwinds.
Three headwinds weigh on the near-term outlook:
The ABS Consumer Price Index data for March 2026 confirms food and non-alcoholic beverages rose 3.1% annually, down from approximately 5.1% in mid-2025, a meaningful deceleration that supports lower input costs for supermarket operators while simultaneously reducing the pricing power tailwind that had underpinned earnings growth through the inflationary period.
Two tailwinds work in the sector’s favour:
Defensive rotation in 2026 has been complicated by supply-driven stagflation, where bonds and equities have fallen together during the Iran War oil shock rather than providing the classic offsetting behaviour that traditional portfolio theory assumes, making the specific drawdown characteristics of consumer staples a more attractive alternative to long-duration bond allocations for investors seeking genuine portfolio protection.
Coles shares rose approximately 3% following its earnings release on 5 March 2026, suggesting that the underlying pricing power of the major supermarket operators continues to support the investment case despite the volume headwinds.
There are three primary routes to ASX consumer staples exposure:
There is no dedicated ASX-listed consumer staples sector ETF, unlike in the US market where products like Vanguard’s VDC exist. This limits pure-play passive options for Australian investors seeking isolated sector exposure.
The XSJ’s negative price return over five years is not a failure of the sector. It is a signal that the sector delivered exactly what it was designed to deliver during a period when the broader market rewarded risk-taking.
Three reasons explain why sophisticated investors hold consumer staples despite lagging price returns: drawdown protection that compounds over market cycles (a -9% maximum drawdown versus -15% for the ASX 200 in 2025), reliable income generation through franked dividends (sector average forward yield of approximately 3.5-4.1%), and portfolio stability that reduces the severity of the worst periods.
The appropriate allocation depends entirely on the investor’s objectives. A growth-oriented 35-year-old accumulating wealth has a different case for staples than a 62-year-old SMSF trustee drawing income. Neither is wrong; they are answering different questions.
The XSJ total return of approximately +2.1% per annum is the more complete measure for a sector explicitly designed around income generation. When Coles listed on the ASX in 2018 and built a reputation for reliable dividend distributions, it was not promising to outrun growth stocks. It was offering something different: dependable income from a business Australians cannot stop using.
The investor’s job is to decide whether they need that kind of insurance, and how much of it belongs in their portfolio.
This article is for informational purposes only and should not be considered financial advice. Investors should conduct their own research and consult with financial professionals before making investment decisions. Past performance does not guarantee future results.
ASX consumer staples stocks are companies that sell essential goods people buy regardless of economic conditions, such as groceries, alcohol, and household products. Major examples include Woolworths (WOW), Coles (COL), Wesfarmers (WES), Treasury Wine Estates (TWE), and Endeavour Group (EDV).
Consumer staples stocks are designed for stability rather than growth, so during bull markets when investors reward risk-taking, the sector typically lags. The S&P/ASX 200 Consumer Staples Index returned -0.72% annualised on a price basis over five years, compared to +4.42% for the ASX 200, but this gap narrows significantly once franked dividends are included in the total return calculation.
Franking credits are tax credits attached to dividends paid from profits already taxed at the corporate rate, and for Australian resident investors they reduce personal tax liability or generate a cash refund. For SMSF trustees in pension phase, the grossed-up yield after franking credits can materially exceed the headline dividend figure reported by companies like Coles and Woolworths.
During the August 2025 global tech correction, the XSJ fell only 2.3% while the ASX 200 dropped 6.1%, with Coles rising 1.2% that month. In February-March 2026, the XSJ posted a positive 0.9% return while the ASX 200 fell 2.8%, demonstrating the sector's consistent drawdown protection across multiple market shocks.
Investors can gain exposure through direct equities such as WOW, COL, TWE, EDV, and WES, through broader Australian equity ETFs with meaningful staples weightings like MVW or FAIR, or via active managed funds with documented staples overweights. There is currently no dedicated ASX-listed consumer staples sector ETF, unlike in the US market.