How Bond Yields and the Dollar Are Pushing Gold Prices Down
26 mins ago

ANZ shares closed at approximately A$35.21 in mid-May 2026. Two of the most widely used valuation methods, applied to the same stock with the same publicly available data, produce estimates of A$38.20 and A$35.10 respectively. The gap between those two numbers is not a flaw in either model. It is the starting point for understanding what ANZ share valuation actually involves, what each method measures, and why informed investors use both rather than choosing one.
This article walks through a price-to-earnings (PE) ratio valuation and a Dividend Discount Model (DDM) valuation of ANZ Group Holdings (ASX: ANZ) using real FY24 and FY25 figures. Each method is built step by step with the actual inputs, so the mechanics are visible rather than abstract. By the end, readers will understand how to calculate both, see exactly where the two outputs diverge, and know what the models cannot capture on their own.
ANZ is one of Australia’s four major banks, and its shares were trading at approximately A$35.21 as of mid-May 2026. That price is not hypothetical. It provides a live benchmark against which both valuation methods can be tested.
Australian bank stocks attract consistent retail investor interest for a specific reason: historically reliable dividend payments, amplified by the tax advantage of franking credits. For income-focused investors, this makes dividend-based valuation methods particularly relevant. ANZ’s FY24 results provide clean, verified inputs to work with.
Valuation inputs at a glance:
The shift to 70% franking is worth flagging early. For investors holding ANZ in superannuation or other tax-advantaged structures, reduced franking changes the after-tax income calculation and feeds directly into the DDM assumptions covered later in this piece.
The PE ratio divides a company’s share price by its annual earnings per share. “Earnings” here simply means profit allocated on a per-share basis. The result tells an investor how many dollars the market is currently paying for each dollar of annual profit the company generates.
Two practical uses follow from that single number. First, comparing a stock’s PE against its sector peers reveals whether the market is pricing it at a premium or discount relative to similar companies. Second, multiplying EPS by an assumed “fair” PE, often derived from the sector average, produces an estimated price target.
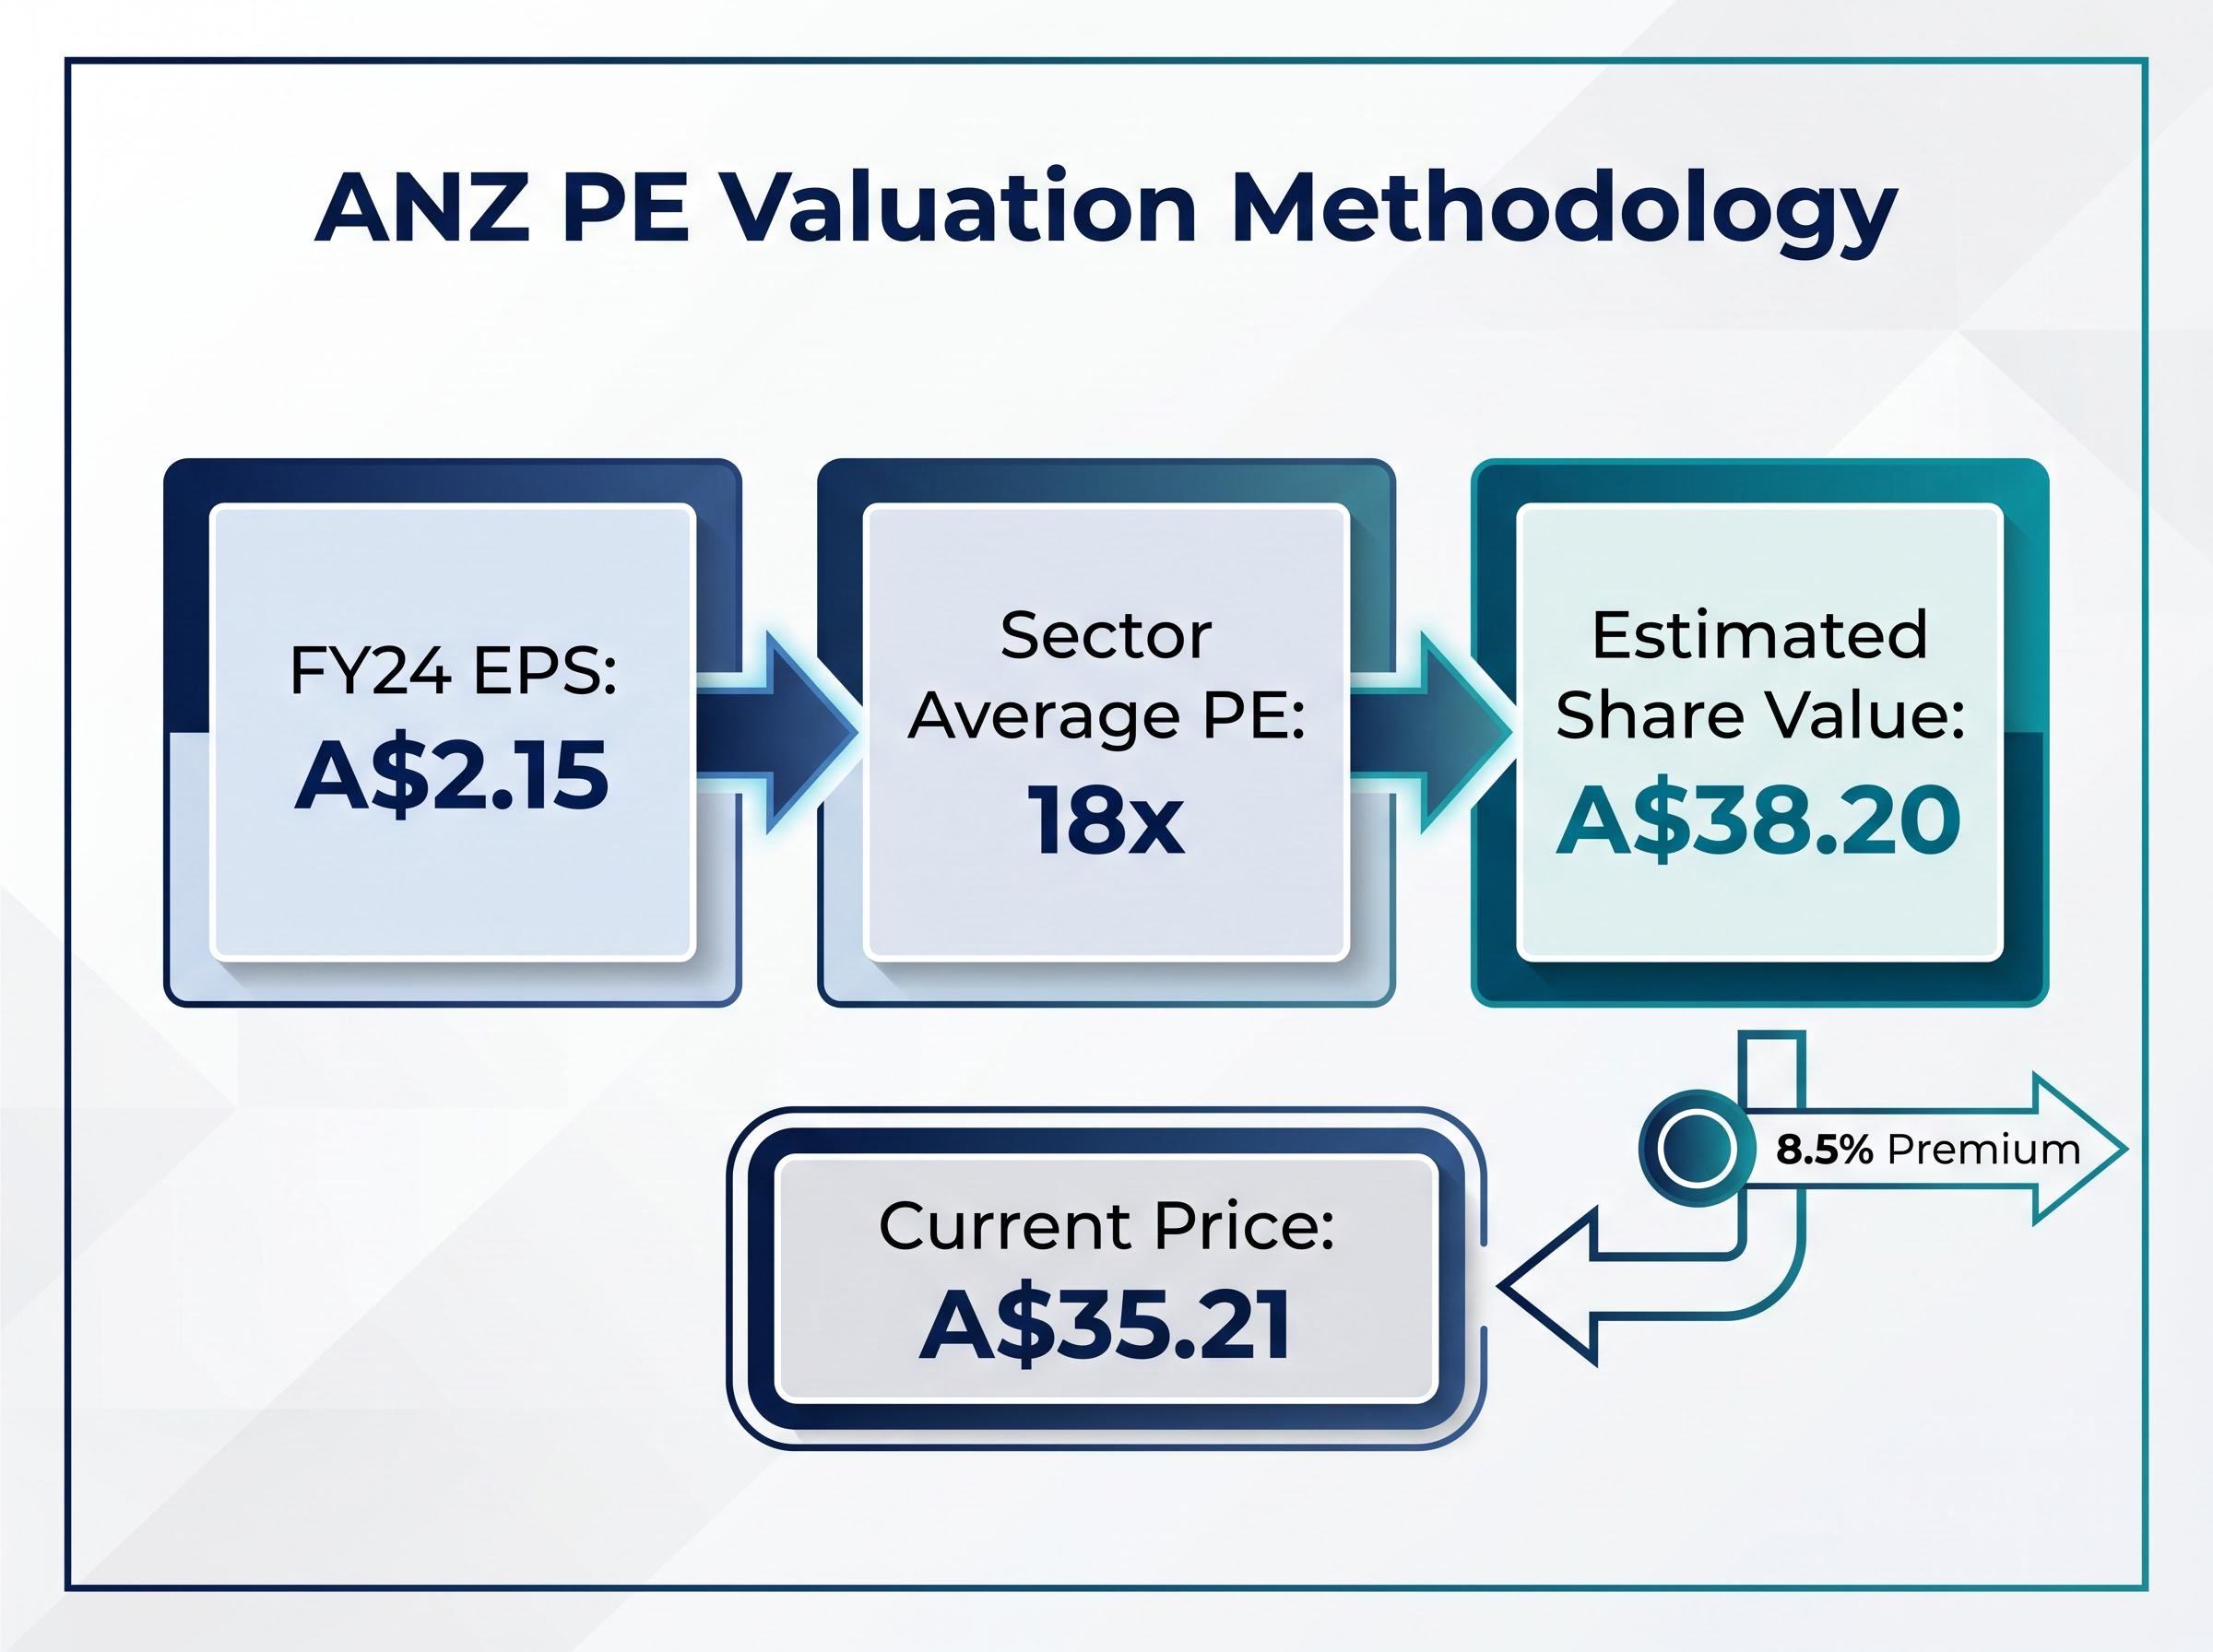
The three-step calculation for ANZ:
Applying the sector average PE of 18x to ANZ’s FY24 EPS of A$2.15 produces an estimated share value of A$38.20, approximately 8.5% above the current market price.
A word of caution specific to bank stocks: PE is a blunt instrument during periods of earnings cyclicality. ANZ’s net interest margin (NIM) peaked during FY23-24 and has been declining since. A low PE multiple can reflect a market that is pricing in future earnings compression rather than signalling genuine undervaluation. This is precisely why analysts covering the major banks tend to prefer forward PE over trailing PE when margins are shifting.
Applying the PE ratio for bank shares across the big four requires care around CBA’s structural premium multiple, which sits significantly above the sector average and can inflate implied fair value estimates for ANZ, NAB, or Westpac if it is included uncritically in the peer benchmark calculation.
The DDM is one of the oldest equity valuation methods. It values a stock as the present value of all future dividends, discounted back to today. For a stable, mature dividend payer like ANZ, the simplified perpetual-growth version of the formula applies:
The DDM for income stocks is structurally well-suited to Australian banks, REITs, and utilities precisely because regulatory constraints and established payout histories produce the kind of predictable dividend streams the model requires; without that predictability, the formula’s inputs become too speculative to anchor a valuation.
DDM Formula: Share Value = Annual Dividend ÷ (Risk Rate − Dividend Growth Rate)
Three inputs drive the output. The base dividend is A$1.66 per share (ANZ’s FY24 and FY25 full-year dividend). An adjusted figure of A$1.69 per share has also been used in some analyses to account for minor variations. The risk rate, which represents the investor’s required rate of return, ranges from 6% to 11% depending on the assumptions used. The dividend growth rate, reflecting expected long-term growth in ANZ’s annual payout, ranges from 2% to 4%.
The model is acutely sensitive to small changes in those assumptions. The table below illustrates why.
| Risk Rate | Growth Rate | Dividend Used | Estimated Value |
|---|---|---|---|
| 6% | 2% | A$1.69 | A$42.25 |
| 8% | 3% | A$1.66 | A$33.20 |
| 8% | 4% | A$1.69 | A$42.25 |
| 11% | 4% | A$1.66 | A$23.71 |
| 11% | 2% | A$1.69 | A$18.78 |
| Blended average (base dividend) | ~A$35.10 | ||
| Blended average (adjusted dividend) | ~A$35.74 | ||
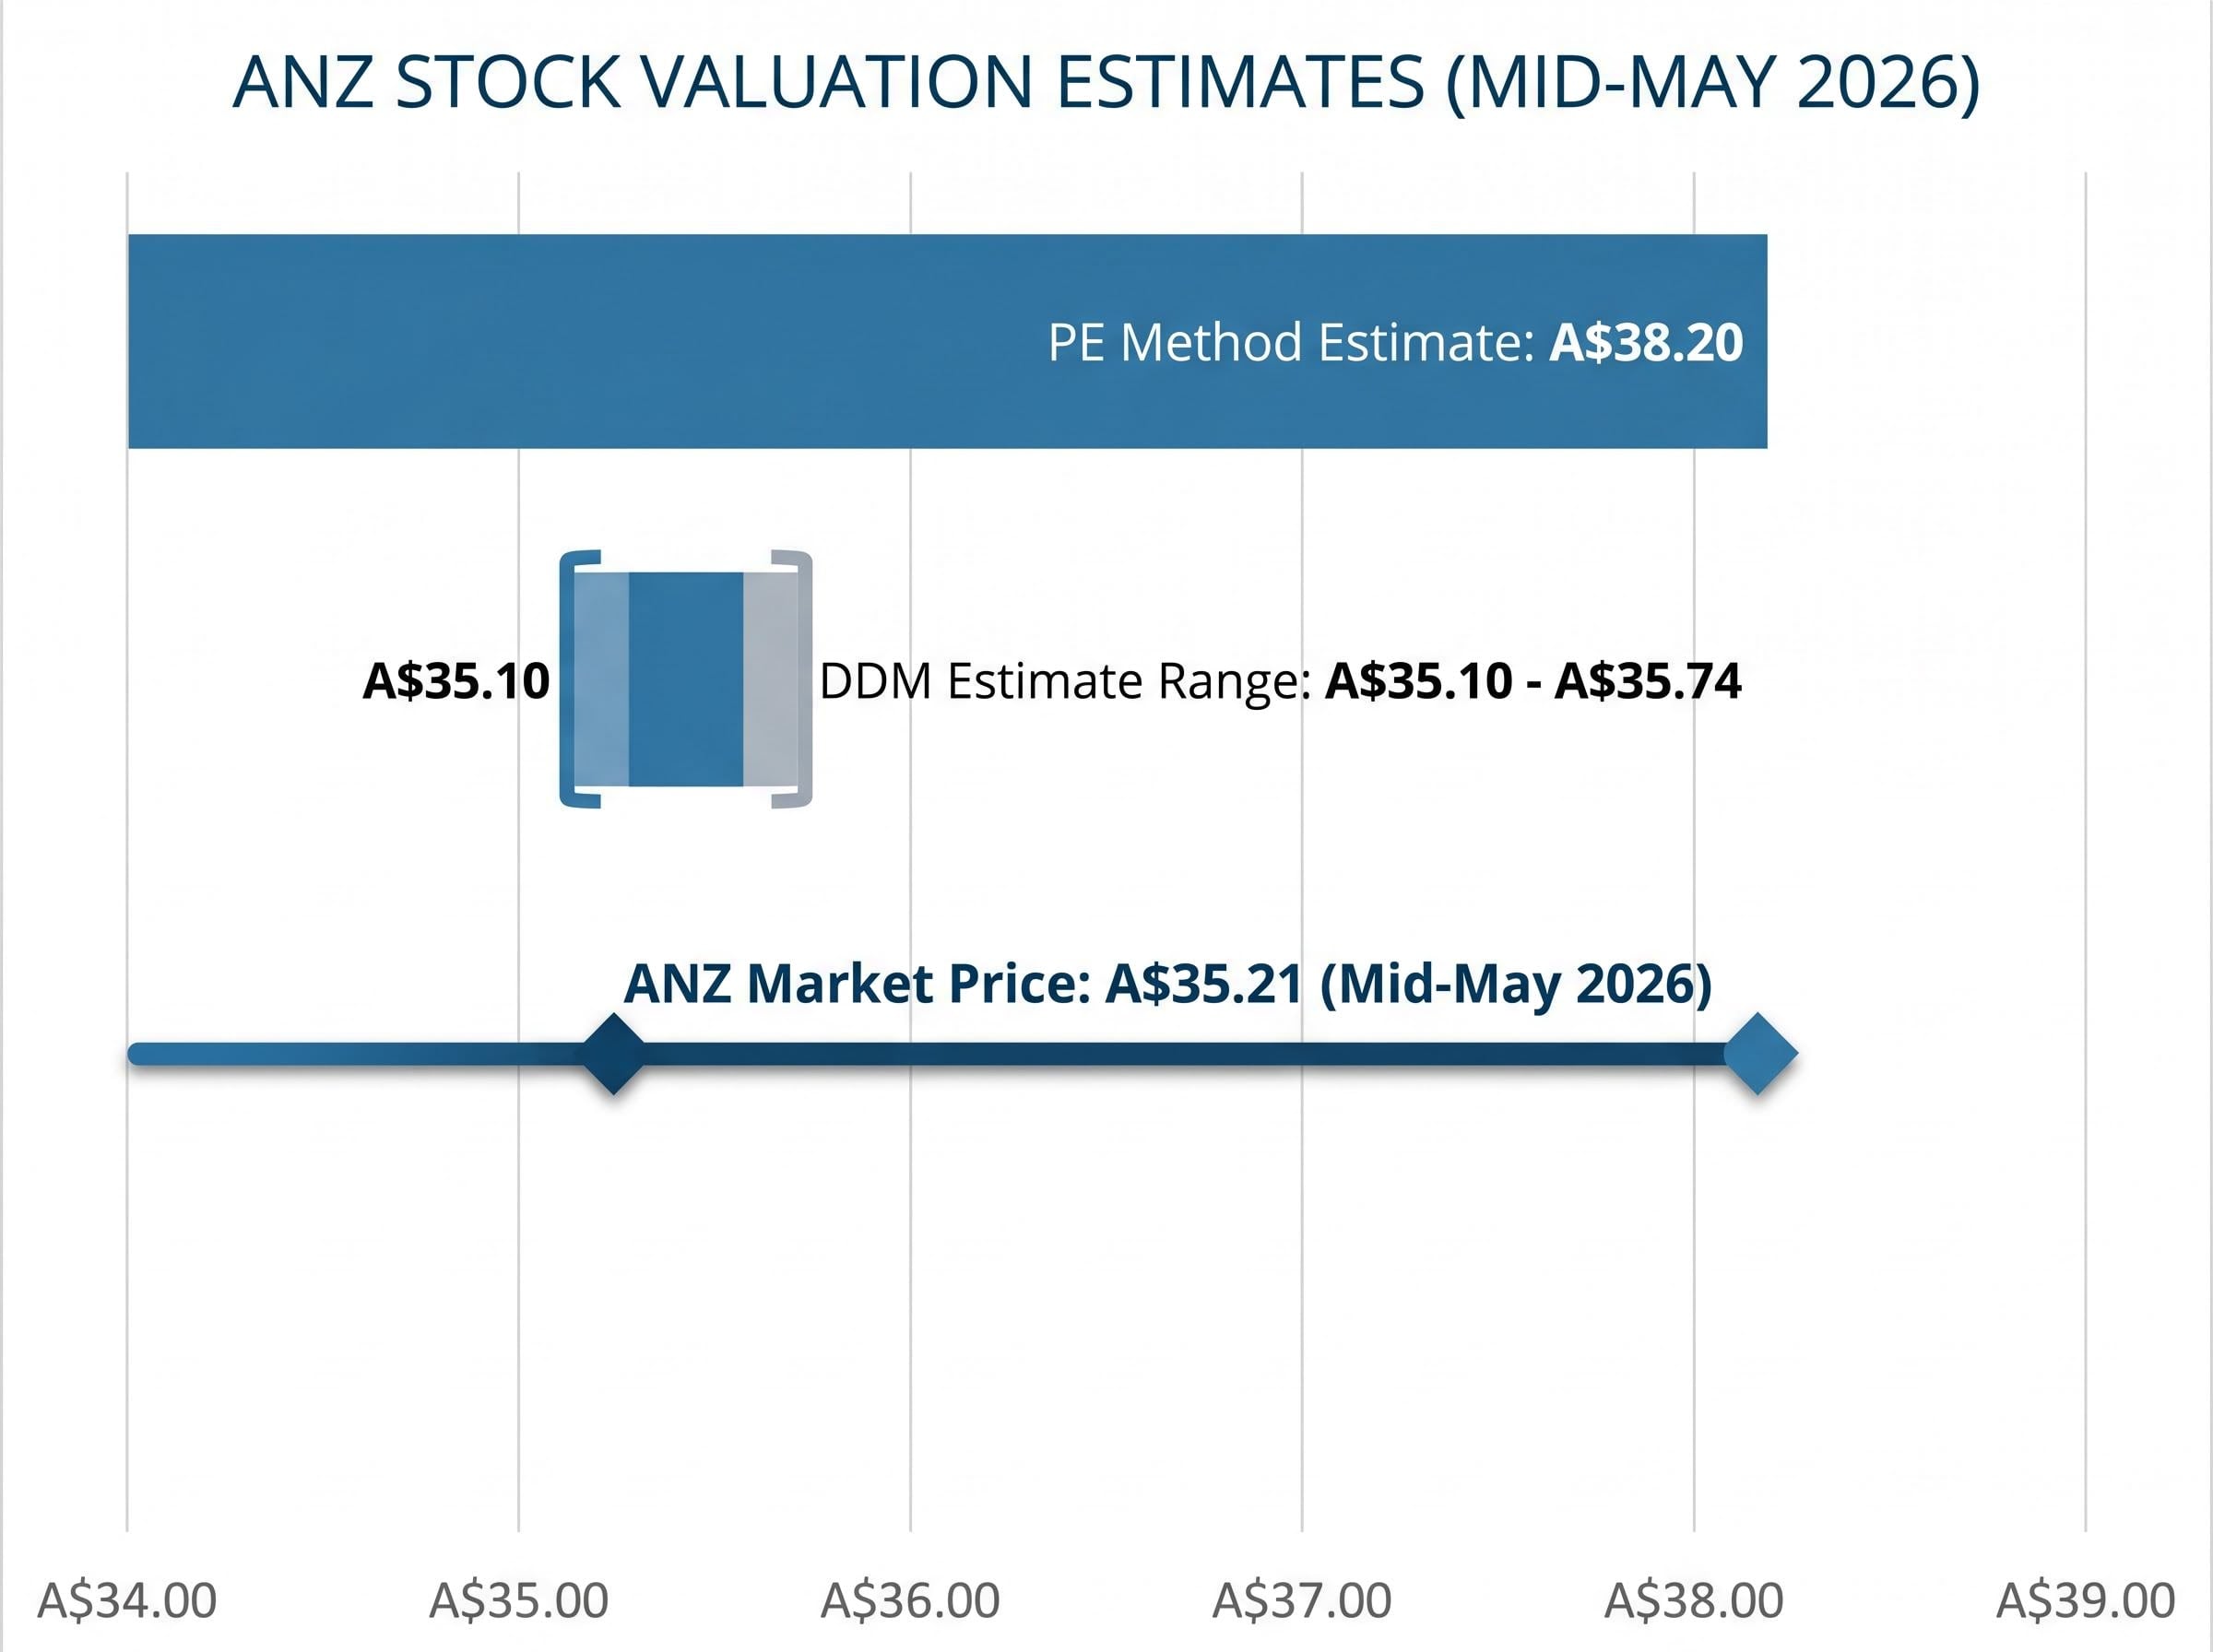
At the extremes, the DDM produces a range from A$18.78 to A$42.25 for the same stock. The blended averaged estimate, which smooths across assumptions, narrows that range to approximately A$35.10 (base dividend) to A$35.74 (adjusted dividend).
One additional factor deserves attention. ANZ’s FY25 dividend was franked at 70% rather than the historical 100%. For DDM calculations, reduced franking lowers the gross after-tax value of the dividend, which mechanically reduces the model’s output for investors who factor in franking benefits.
The PE method estimates ANZ at A$38.20. The DDM estimates a range of A$35.10-35.74. ANZ’s market price sits at approximately A$35.21. The PE method suggests modest undervaluation. The DDM suggests the stock is trading at approximately fair value. Both used real data from the same company.
The divergence is not a contradiction. The two models measure fundamentally different things.
The PE method values ANZ based on its current earnings capacity. It asks: how does the market typically price this level of profit relative to peers? It implicitly assumes that earnings growth will track the sector average. The DDM, by contrast, values ANZ purely on its dividend-paying capacity and the investor’s required return. It is indifferent to earnings that are not paid out.
Each model also embeds different assumptions about the future. The PE approach relies on a sector multiple that may not hold if earnings across the banking sector compress at different rates. The DDM relies on a discount rate and growth rate that cannot be known with certainty, and as the sensitivity table above showed, even modest changes produce large swings.
Morningstar Australia has noted that PE is “too blunt” as a standalone tool in the current rate cycle, given the wide dispersion in growth profiles between mortgage-heavy and institutionally oriented banks. Their preference is a price-to-book plus normalised return on equity (ROE) framework for long-run comparison.
The NYU Stern valuation framework for financial service firms identifies why standard PE and DDM applications require modification when applied to banks: regulatory capital constraints, earnings sensitivity to interest rate cycles, and the treatment of debt as a raw material rather than a financing tool all alter how multiples and discount rates should be set.
Professional analysts covering the Australian major banks do not choose one model. They layer forward PE, price-to-book versus ROE, and DDM values together as a cross-check, building a range rather than seeking a single number.
In ANZ’s case, the Suncorp Bank acquisition (completed 31 July 2024) and the shift to 70% franking in FY25 are concrete examples of factors that affect different models differently. The acquisition is expected to be EPS accretive over the medium term, which lifts the PE-derived estimate. The reduced franking, meanwhile, lowers the after-tax dividend value used in DDM calculations. No single method captures both dynamics simultaneously.
| Method | Key Input | Estimated Value | What It Measures |
|---|---|---|---|
| PE Ratio | FY24 EPS of A$2.15 × sector average PE of 18x | A$38.20 | Relative earnings pricing versus peers |
| Dividend Discount Model | Annual dividend of A$1.66, blended risk/growth assumptions | A$35.10-35.74 | Present value of future income stream |
Both models produce a number. Neither number captures the qualitative factors that may matter most over the next 12 to 24 months.
ANZ’s NIM has been declining since its FY23-24 peak. Deposit competition intensified, funding costs rose, and customers shifted toward higher-yield deposits. Analysts expect NIM to continue edging lower into FY25 before stabilising over the medium term. Trailing EPS figures used in PE calculations may therefore overstate normalised earnings power, which is precisely the scenario where forward PE is preferred over trailing PE.
The Suncorp Bank integration adds another layer of uncertainty. The acquisition completed on 31 July 2024, and integration is ongoing as of mid-2026, with IT systems consolidation and back-office workstreams still in progress. Broker commentary has described the transaction as EPS accretive over the medium term once synergies are realised, but execution risk remains.
Key factors neither model captures:
ANZ’s FY25 dividend was franked at 70% rather than the historical 100%. This change directly affects the after-tax income calculation for investors holding shares in superannuation or other tax-advantaged structures, and should be factored into any forward income modelling.
The ATO franking credit refund rules specify eligibility conditions including the 45-day holding period rule, which determines whether shareholders in superannuation funds and other tax-advantaged structures can actually receive the benefit that DDM calculations assume when grossing up dividend income.
FY24 impairment charges remained low relative to pre-COVID norms, but gradual normalisation is expected as higher interest rates and cost-of-living pressures flow through to credit quality. Neither the PE ratio nor the DDM accounts for the pace of that normalisation.
Qualitative credit cycle signals, including the trajectory of impaired loans and the lag between rate rises and household arrears, can move materially faster than the earnings figures embedded in standard PE and DDM inputs, which is why the Big Four impaired loan book climbing 15.4% to A$9.6 billion in the first half of 2026 was a meaningful development that neither trailing EPS nor a fixed dividend assumption would have flagged.
The PE method suggests modest undervaluation at A$38.20 against a A$35.21 market price. The DDM suggests fair value at current levels, given the A$35.10-35.74 range. Neither is wrong. They reflect different questions about the same company.
The core lesson from running both models is that assumptions drive outputs more than formulas do. Investors who stress-test their discount rate, growth rate, and franking assumptions are doing more analytically useful work than those who treat any single estimate as authoritative. For context, the early 2025 analyst consensus target of approximately A$32-33 has since been overtaken by the share price itself, a reminder that targets are snapshots, not predictions.
These models are the beginning of analysis, not the end. Concrete next steps for deeper work include:
This article is for informational purposes only and should not be considered financial advice. Investors should conduct their own research and consult with financial professionals before making investment decisions. Past performance does not guarantee future results. Financial projections are subject to market conditions and various risk factors.
The Dividend Discount Model (DDM) values a stock as the present value of all future dividends discounted back to today. For ANZ, using a base dividend of A$1.66 per share and blended risk and growth assumptions, the DDM produces an estimated value range of approximately A$35.10 to A$35.74, suggesting the stock is trading near fair value.
The PE ratio valuation multiplies a company's earnings per share by a sector average multiple to estimate fair value. For ANZ, applying the banking sector average PE of 18x to FY24 EPS of A$2.15 produces an estimated share value of A$38.20, approximately 8.5% above the mid-May 2026 market price of A$35.21.
ANZ's FY25 dividend was franked at 70% rather than the historical 100%, which lowers the gross after-tax value of the dividend for investors in superannuation and other tax-advantaged structures. This change directly reduces the output of DDM calculations that factor in franking benefits when grossing up dividend income.
The two models measure fundamentally different things: the PE ratio values ANZ based on its current earnings capacity relative to peers, while the DDM values it purely on its dividend-paying capacity and the investor's required return. Because they use different inputs and ask different questions, producing different estimates is expected rather than a sign that either method is flawed.
Neither the PE ratio nor the DDM captures factors such as ANZ's declining net interest margin since its FY23-24 peak, execution risk from the Suncorp Bank integration completed in July 2024, loan book quality, or offshore wholesale funding exposure, all of which could materially affect future earnings and dividends.