Why DDM Gives ASX Bank Shares a $7 to $32 Valuation Range
1 hr ago

ANZ Group Holdings shares have fallen roughly 14% from their February 2026 high of A$40.14 to A$34.57, and the question confronting every dividend-focused investor is whether that pullback has created genuine value or simply returned the stock to where it belongs. The answer depends on which valuation framework is applied, and how much weight is given to the macro headwinds pressing on bank earnings. With the RBA delivering another rate hike in May 2026 and ANZ’s FY25 statutory profit down approximately 10% year-on-year, the backdrop is genuinely mixed. At the same time, consensus fair-value estimates from analysts cluster around A$36-37, putting the current price at a modest discount. This article applies two widely used equity valuation methods, the Price-to-Earnings ratio and the Dividend Discount Model, to ANZ’s current figures, walks through the numbers step by step, and arrives at a grounded view on whether the stock is fairly valued for income-oriented investors building positions in Australian bank shares.
As of 13 May 2026, ANZ closed at A$34.57, sitting closer to the midpoint of its 52-week range than to either extreme. That range stretches from A$27.85 to A$41.00, with the recent peak of A$40.14 reached in February 2026 following a strong quarterly earnings update.
The 14% pullback from A$40.14 to A$34.57 is the central question this analysis addresses: has the sell-off repriced the stock toward fair value, or pushed it below?
The key valuation inputs at the current price:
Over the past 12 months, ANZ has outperformed its sector by 19.24% and the ASX 200 by 15.84%, despite the recent pullback. That outperformance makes the decline from February more notable; the stock ran hard into early 2026, and the retreat since has been orderly rather than panicked.
The price-to-earnings ratio is a comparative tool. Its value comes not from the raw number itself but from benchmarking that number against sector peers. A P/E of 17.95x means very little in isolation; it starts to speak when placed alongside the multiples the other Big Four banks command.
The PE ratio method for ASX banks requires care in selecting the right peer benchmark, particularly the decision of whether to include CBA in the sector average, given its structural premium of approximately 25x sits well above what ANZ, NAB, or Westpac have historically commanded.
The three-step calculation is straightforward:
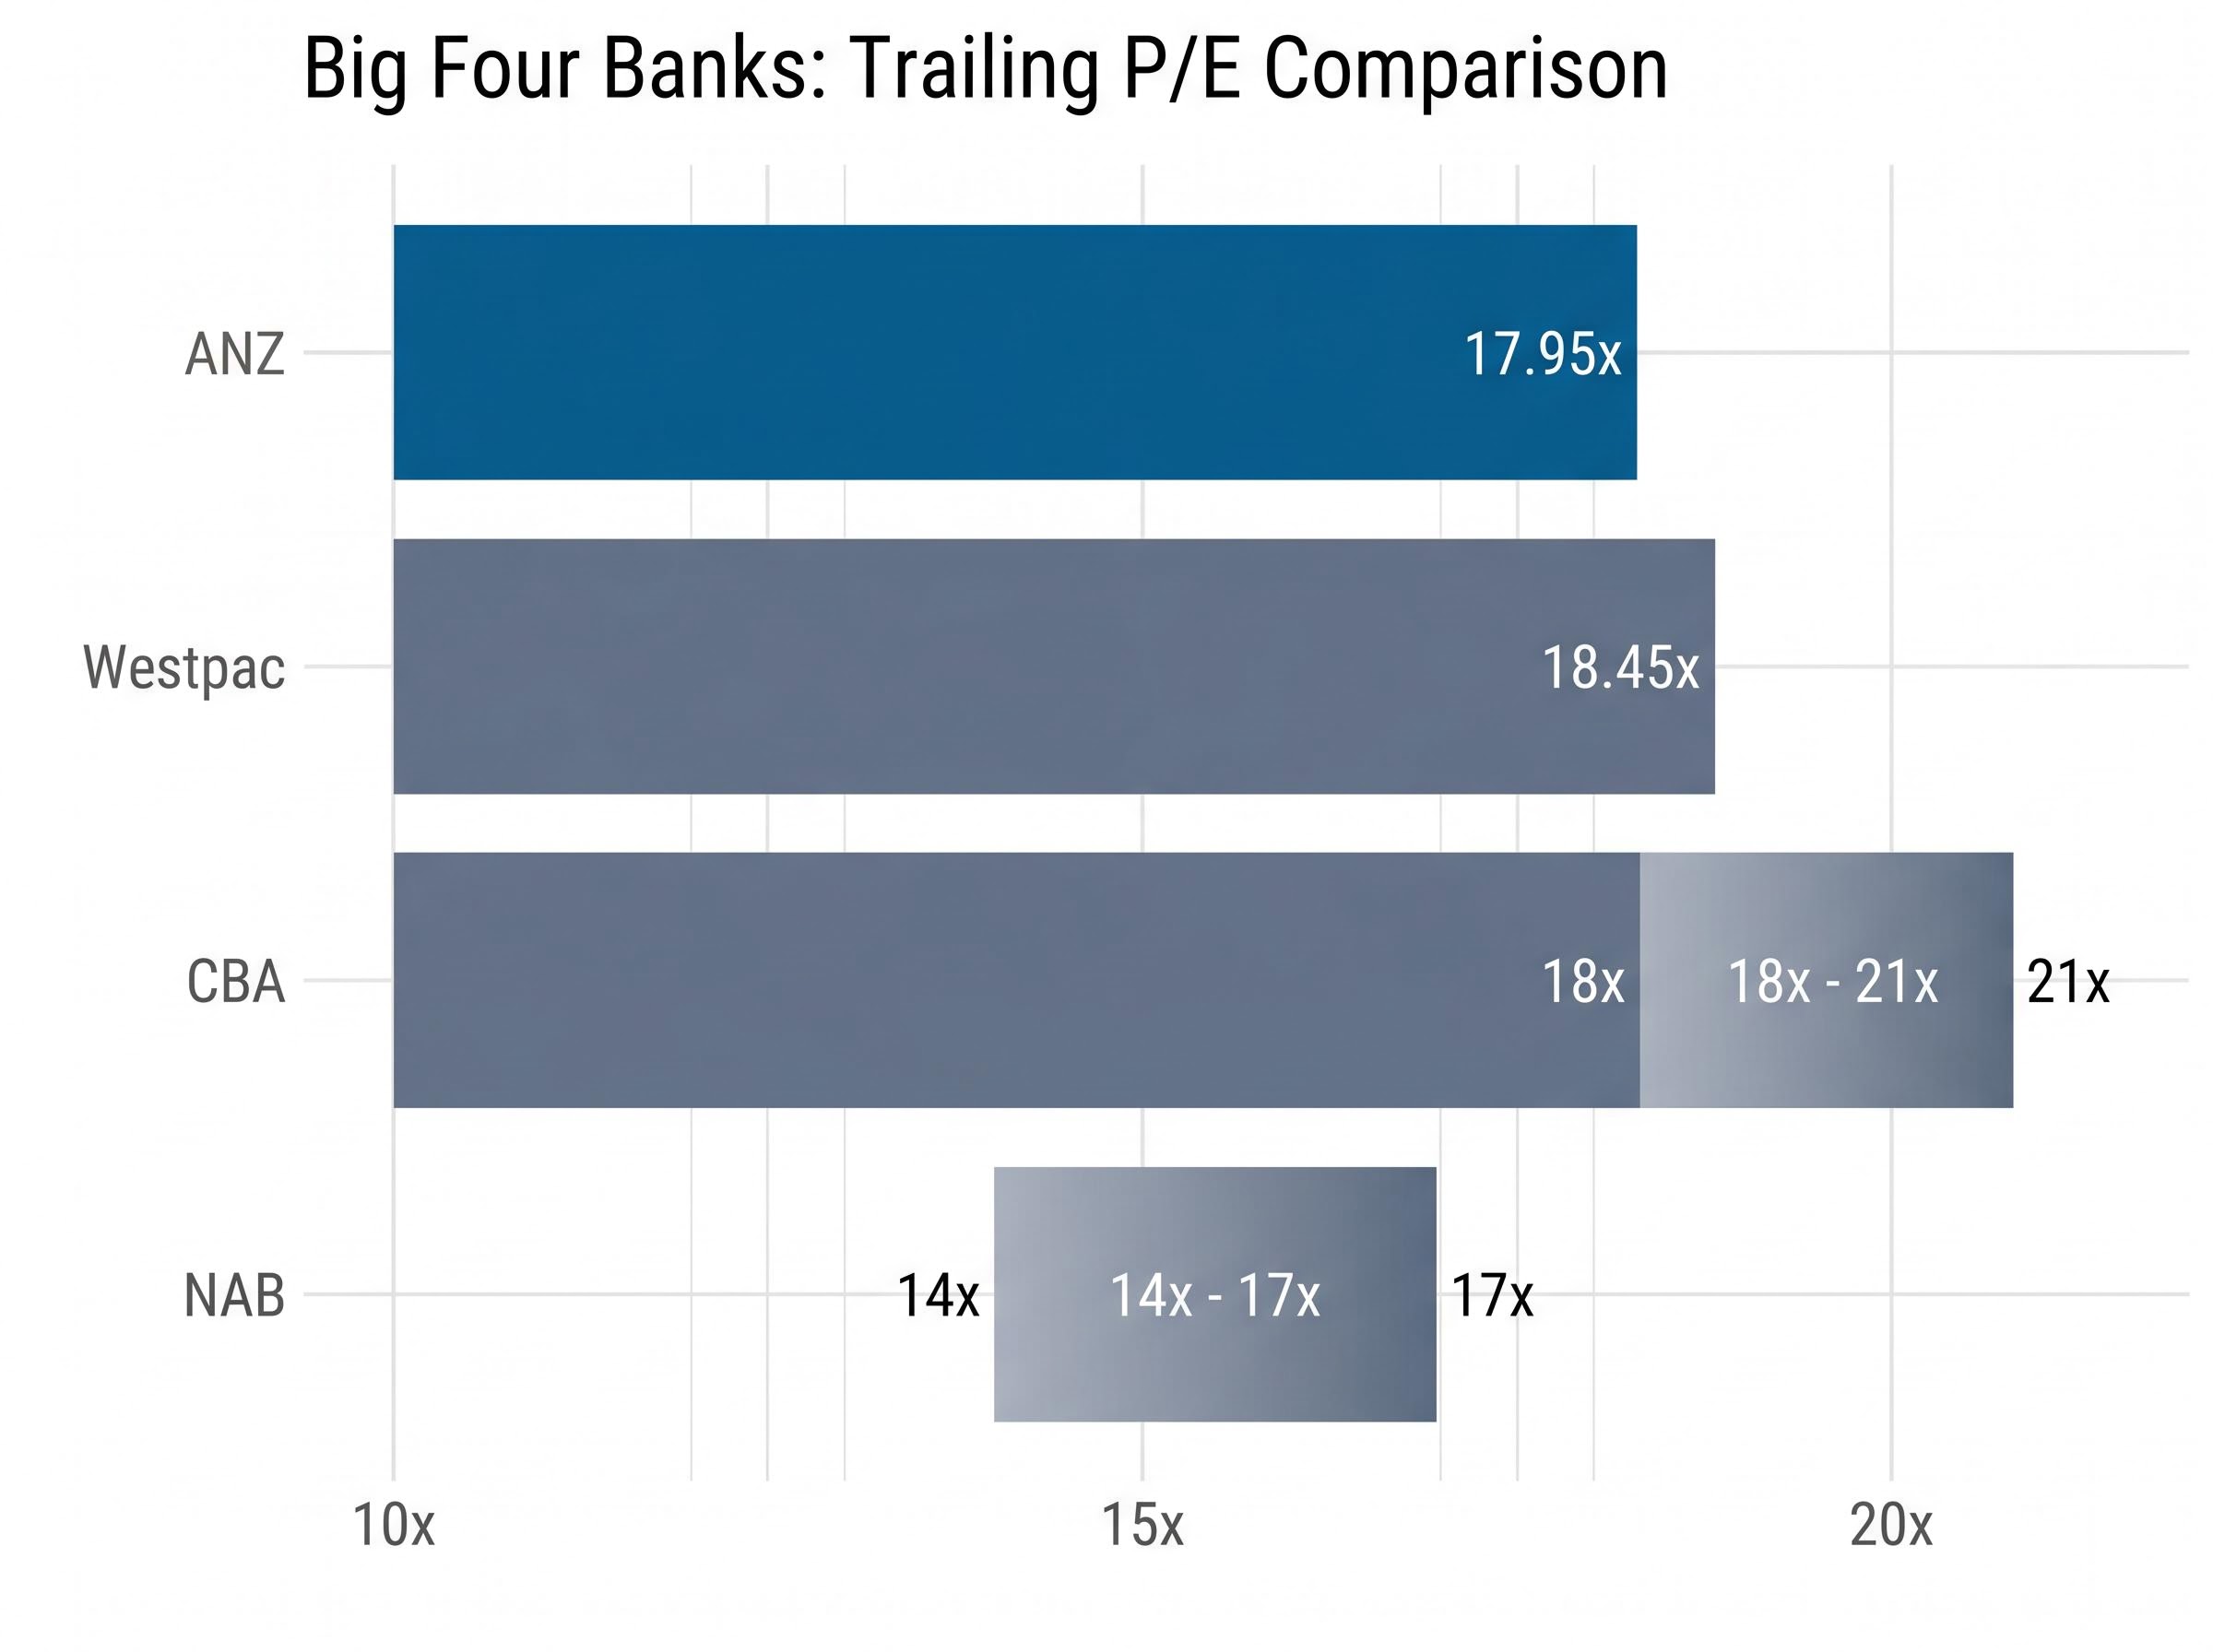
| Bank | Approximate Trailing P/E | P/E-Implied Fair Value at 17x EPS |
|---|---|---|
| ANZ | ~17.95x | ~A$33.54 |
| Westpac | ~18.45x | N/A |
| CBA | ~18-21x | N/A |
| NAB | ~14-17x | N/A |
The PE-implied fair value range of A$33.54-A$35.51 brackets the current share price of A$34.57 almost precisely. On this measure, ANZ is neither cheap nor expensive; it is trading within the bounds of sector-fair value, depending on whether a 17x or 18x multiple is deemed more appropriate.
According to Simply Wall St, the analyst consensus fair value sits at A$36.66, described as 5.7% above the current price. That gap is worth noting: most published estimates imply a modest discount at current levels rather than a premium.
The DDM is the valuation method most native to how income investors think about bank stocks. Where the P/E ratio asks “what is the market paying for each dollar of earnings?”, the DDM asks “what is a perpetual stream of dividends worth today?”
DDM Formula: Share price = D / (r – g), where D is the annual dividend, r is the required rate of return (cost of equity), and g is the expected long-term dividend growth rate.
For ANZ, the starting inputs are straightforward. The trailing twelve-month dividend is A$1.66 per share, composed of the 83c interim dividend declared for 1H26 (ex-dividend 11 May 2026, franked at 75%) and the 83c final dividend from FY25. An adjusted scenario using A$1.69 in DPS is also modelled to capture potential near-term growth.
ANZ’s 1H26 results announcement confirmed a cash profit of A$3.78 billion and an interim dividend of 83 cents per share franked at 75%, providing the primary-source figures that underpin the dividend and earnings inputs used in both valuation models applied here.
The complexity, and the model’s most important practical lesson, lies not in the dividend figure but in the discount rate.
The same model, using the same A$1.66 dividend, produces a fair value of approximately A$42.25 at a 6% cost of equity with 2% growth, and approximately A$24.14 at an 11% cost of equity with 2% growth. That is a 75% spread from a single input change.
| Risk Rate (r) | Growth 2% (g) | Growth 3% (g) | Growth 4% (g) |
|---|---|---|---|
| 6% | ~A$41.50 | ~A$55.33 | ~A$83.00 |
| 8% | ~A$27.67 | ~A$33.20 | ~A$41.50 |
| 9% | ~A$23.71 | ~A$27.67 | ~A$33.20 |
| 11% | ~A$18.44 | ~A$20.75 | ~A$23.71 |
A cost of equity in the 8-9% range is commonly applied to Australian major bank stocks, given their regulated, relatively low-risk earnings profiles. At those rates, the DDM outputs cluster around the A$27-A$33 zone for conservative growth assumptions and extend higher with more optimistic inputs. The blended average across the scenario matrix, as calculated in prior modelling, produces a fair value of approximately A$35.10 using the base A$1.66 DPS, and A$35.74 using an adjusted A$1.69 figure.
RBA research on bank cost of equity establishes that Australian major banks have historically operated with cost-of-equity estimates in the 8-10% range, reflecting their regulated earnings profiles and relatively low probability of distress compared with unregulated financial institutions.
That blended output of A$35.10-A$35.74 sits above the current price of A$34.57 and aligns closely with both the PE-derived range and the analyst consensus. The convergence across independent methods is the signal worth paying attention to.
Valuation models produce precise-looking numbers, but those numbers are only as reliable as the earnings and dividend assumptions feeding into them. The macro environment is actively testing those assumptions.
The most immediate variable is the RBA cash rate, which was hiked 0.25% to 4.35% at the 5 May 2026 board meeting. For bank stocks, the effect is double-edged. Higher rates provide a short-term net interest margin benefit, but they simultaneously amplify household cash-flow pressure, particularly for lower-income owner-occupiers and small-business borrowers. Rising arrears risk is a recurring theme in broker commentary.
The RBA’s May 2026 rate decision was the third consecutive tightening move, lifting the cash rate from 3.85% in January to 4.35% in May, with eight of nine Board members voting for the hike and forward guidance language that preserved full optionality on a fourth move in July, making Q2 CPI and labour market data the next critical inputs for bank stock investors.
ANZ’s earnings trajectory adds nuance rather than clarity. The FY25 statutory profit of A$5.891 billion was down approximately 10% year-on-year, but the decline was partly attributable to non-cash factors. The underlying picture is more encouraging: 1Q26 profit surged 17% to A$1.9 billion, driven by aggressive cost reduction including approximately 3,500 role reductions, and the 1H26 cash profit reached A$3.78 billion.
The ANZ Worldline joint venture acquisition, completed in April 2026, signals a strategic preference for payments technology over balance-sheet expansion, a lower-risk capital allocation than a retail banking acquisition would represent.
Key risk factors to monitor:
Potential upside catalysts:
Three independent reference points now sit on the table. The PE-implied range of A$33.54-A$35.51. The DDM-implied range of A$35.10-A$35.74. The analyst consensus of A$36.66 from Simply Wall St.
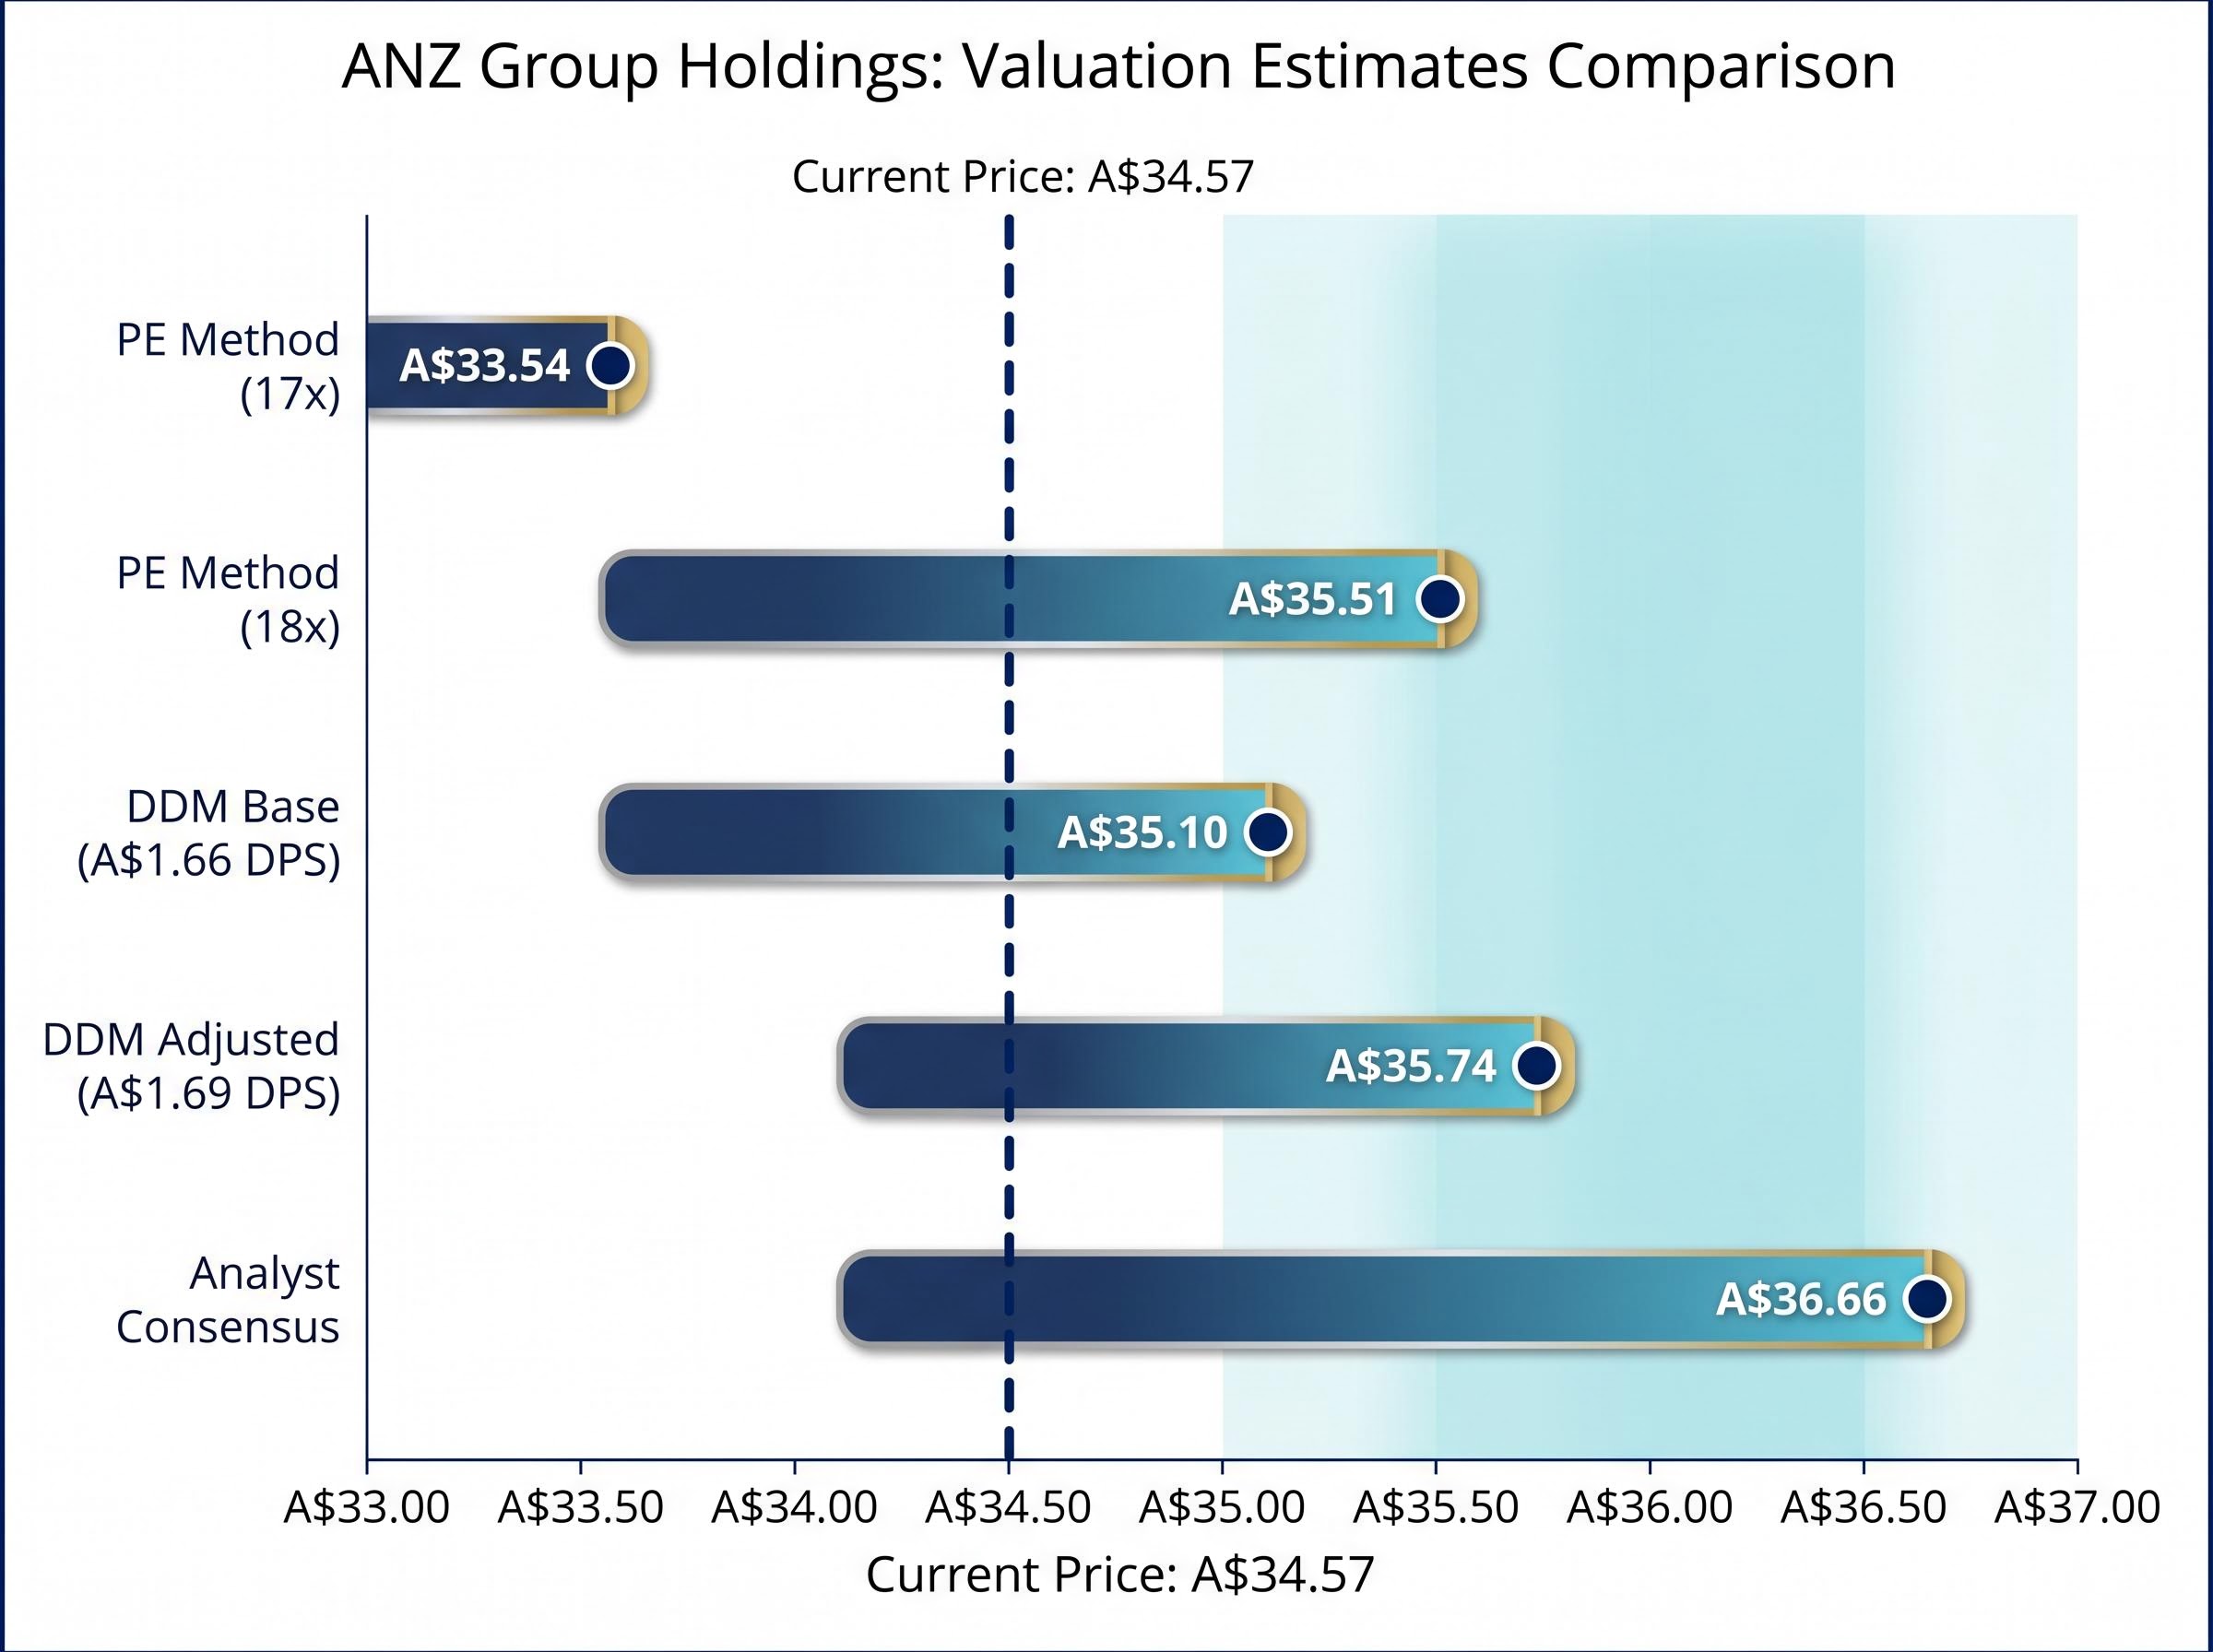
All three approaches point to a fair value band of approximately A$35-37. At A$34.57, ANZ is trading at the lower end of that range, representing a modest discount rather than a bargain or a premium.
| Valuation Method | Fair Value Estimate | Vs Current Price (A$34.57) |
|---|---|---|
| PE Method (17x) | ~A$33.54 | -3.0% |
| PE Method (18x) | ~A$35.51 | +2.7% |
| DDM Base (A$1.66 DPS) | ~A$35.10 | +1.5% |
| DDM Adjusted (A$1.69 DPS) | ~A$35.74 | +3.4% |
| Analyst Consensus | A$36.66 | +6.0% |
The convergence is the analytical signal. When a PE-based estimate, a DDM-based estimate, and a consensus of professional analysts all point to approximately the same zone, the probability that fair value sits somewhere in that band is meaningfully higher than any single model could claim. Broker consensus is Neutral/Hold, with some targets reaching into the high A$30s (e.g., A$38.14).
Big Four valuation consensus has been shaped significantly by Morgans’ late-April 2026 decision to issue sell ratings across all four banks, with ANZ standing apart as the most contested case: roughly six of sixteen covering analysts held buy ratings, and the average analyst target implied only around 4% downside at the time, a far narrower margin than the calls on CBA or NAB.
The limitations deserve acknowledgement. P/E ratios can re-rate rapidly when earnings estimates shift; a weaker FY26 would compress the implied value. The DDM is highly sensitive to the discount rate chosen, as the matrix above illustrates. Neither model accounts for unexpected credit events or regulatory changes.
At A$34.57, ANZ is trading at a modest discount to a defensible fair value range of A$35-37. That makes the stock more attractive than it was near the February 2026 high of A$40-41, when it traded above most published estimates, though not at a level that demands aggressive accumulation.
The 4.80% cash dividend yield is genuinely competitive in the current rate environment. With franking at 75% on the most recent interim dividend, the grossed-up yield is higher still for Australian resident investors.
The improvement from 70% franking on the FY25 final dividend to 75% on the 1H26 interim increases the after-tax yield for Australian resident investors who can utilise franking credit offsets against their tax liability. For superannuation fund investors and self-managed super funds (SMSFs) in particular, where franking credit refunds can be claimed in full, this improvement has a direct and measurable impact on the effective yield received.
For investors wanting to model how ANZ’s partially franked dividends interact with different tax structures across personal, superannuation fund, and SMSF pension-phase accounts, our dedicated guide to ASX dividend investing with franking credits covers payout ratio analysis, grossed-up yield calculations, ex-dividend date mechanics, and how to identify dividend traps before they erode an income portfolio.
Upside catalysts that could shift the assessment:
Downside risks that would challenge the thesis:
The broker consensus of Neutral/Hold, with targets in the high A$30s, aligns with the conclusion the numbers support: ANZ is a hold for existing positions and an accumulate-on-weakness candidate for income investors who are comfortable with the macro risks priced into the current level.
This article is for informational purposes only and should not be considered financial advice. Investors should conduct their own research and consult with financial professionals before making investment decisions. Past performance does not guarantee future results. Financial projections are subject to market conditions and various risk factors.
The Dividend Discount Model values a stock by calculating the present value of its future dividend stream using the formula: share price equals annual dividend divided by the difference between the required return and dividend growth rate. Applied to ANZ with a trailing dividend of A$1.66 per share and an 8-9% cost of equity, the model produces a blended fair value of approximately A$35.10-A$35.74.
ANZ is currently yielding approximately 4.80% in cash terms based on trailing dividends of A$1.66 per share at the current price of A$34.57, with the most recent interim dividend franked at 75%, which increases the effective grossed-up yield for Australian resident investors who can utilise franking credit offsets.
The PE ratio method multiplies a bank's trailing earnings per share by a sector-appropriate multiple to estimate fair value. For ANZ, applying a 17x-18x multiple to trailing EPS of A$1.973 produces an implied fair value range of A$33.54-A$35.51, bracketing the current share price of A$34.57.
The RBA's May 2026 rate hike to 4.35% has a double-edged effect on ANZ: higher rates provide short-term net interest margin support but increase household cash-flow pressure, raising the risk of rising arrears among mortgage and small-business borrowers over the medium term.
The analyst consensus fair value from Simply Wall St sits at A$36.66, approximately 6% above the current price of A$34.57, with broker consensus at Neutral/Hold and some individual targets reaching A$38.14, aligning closely with the A$35-37 band produced by independent PE and DDM valuation methods.