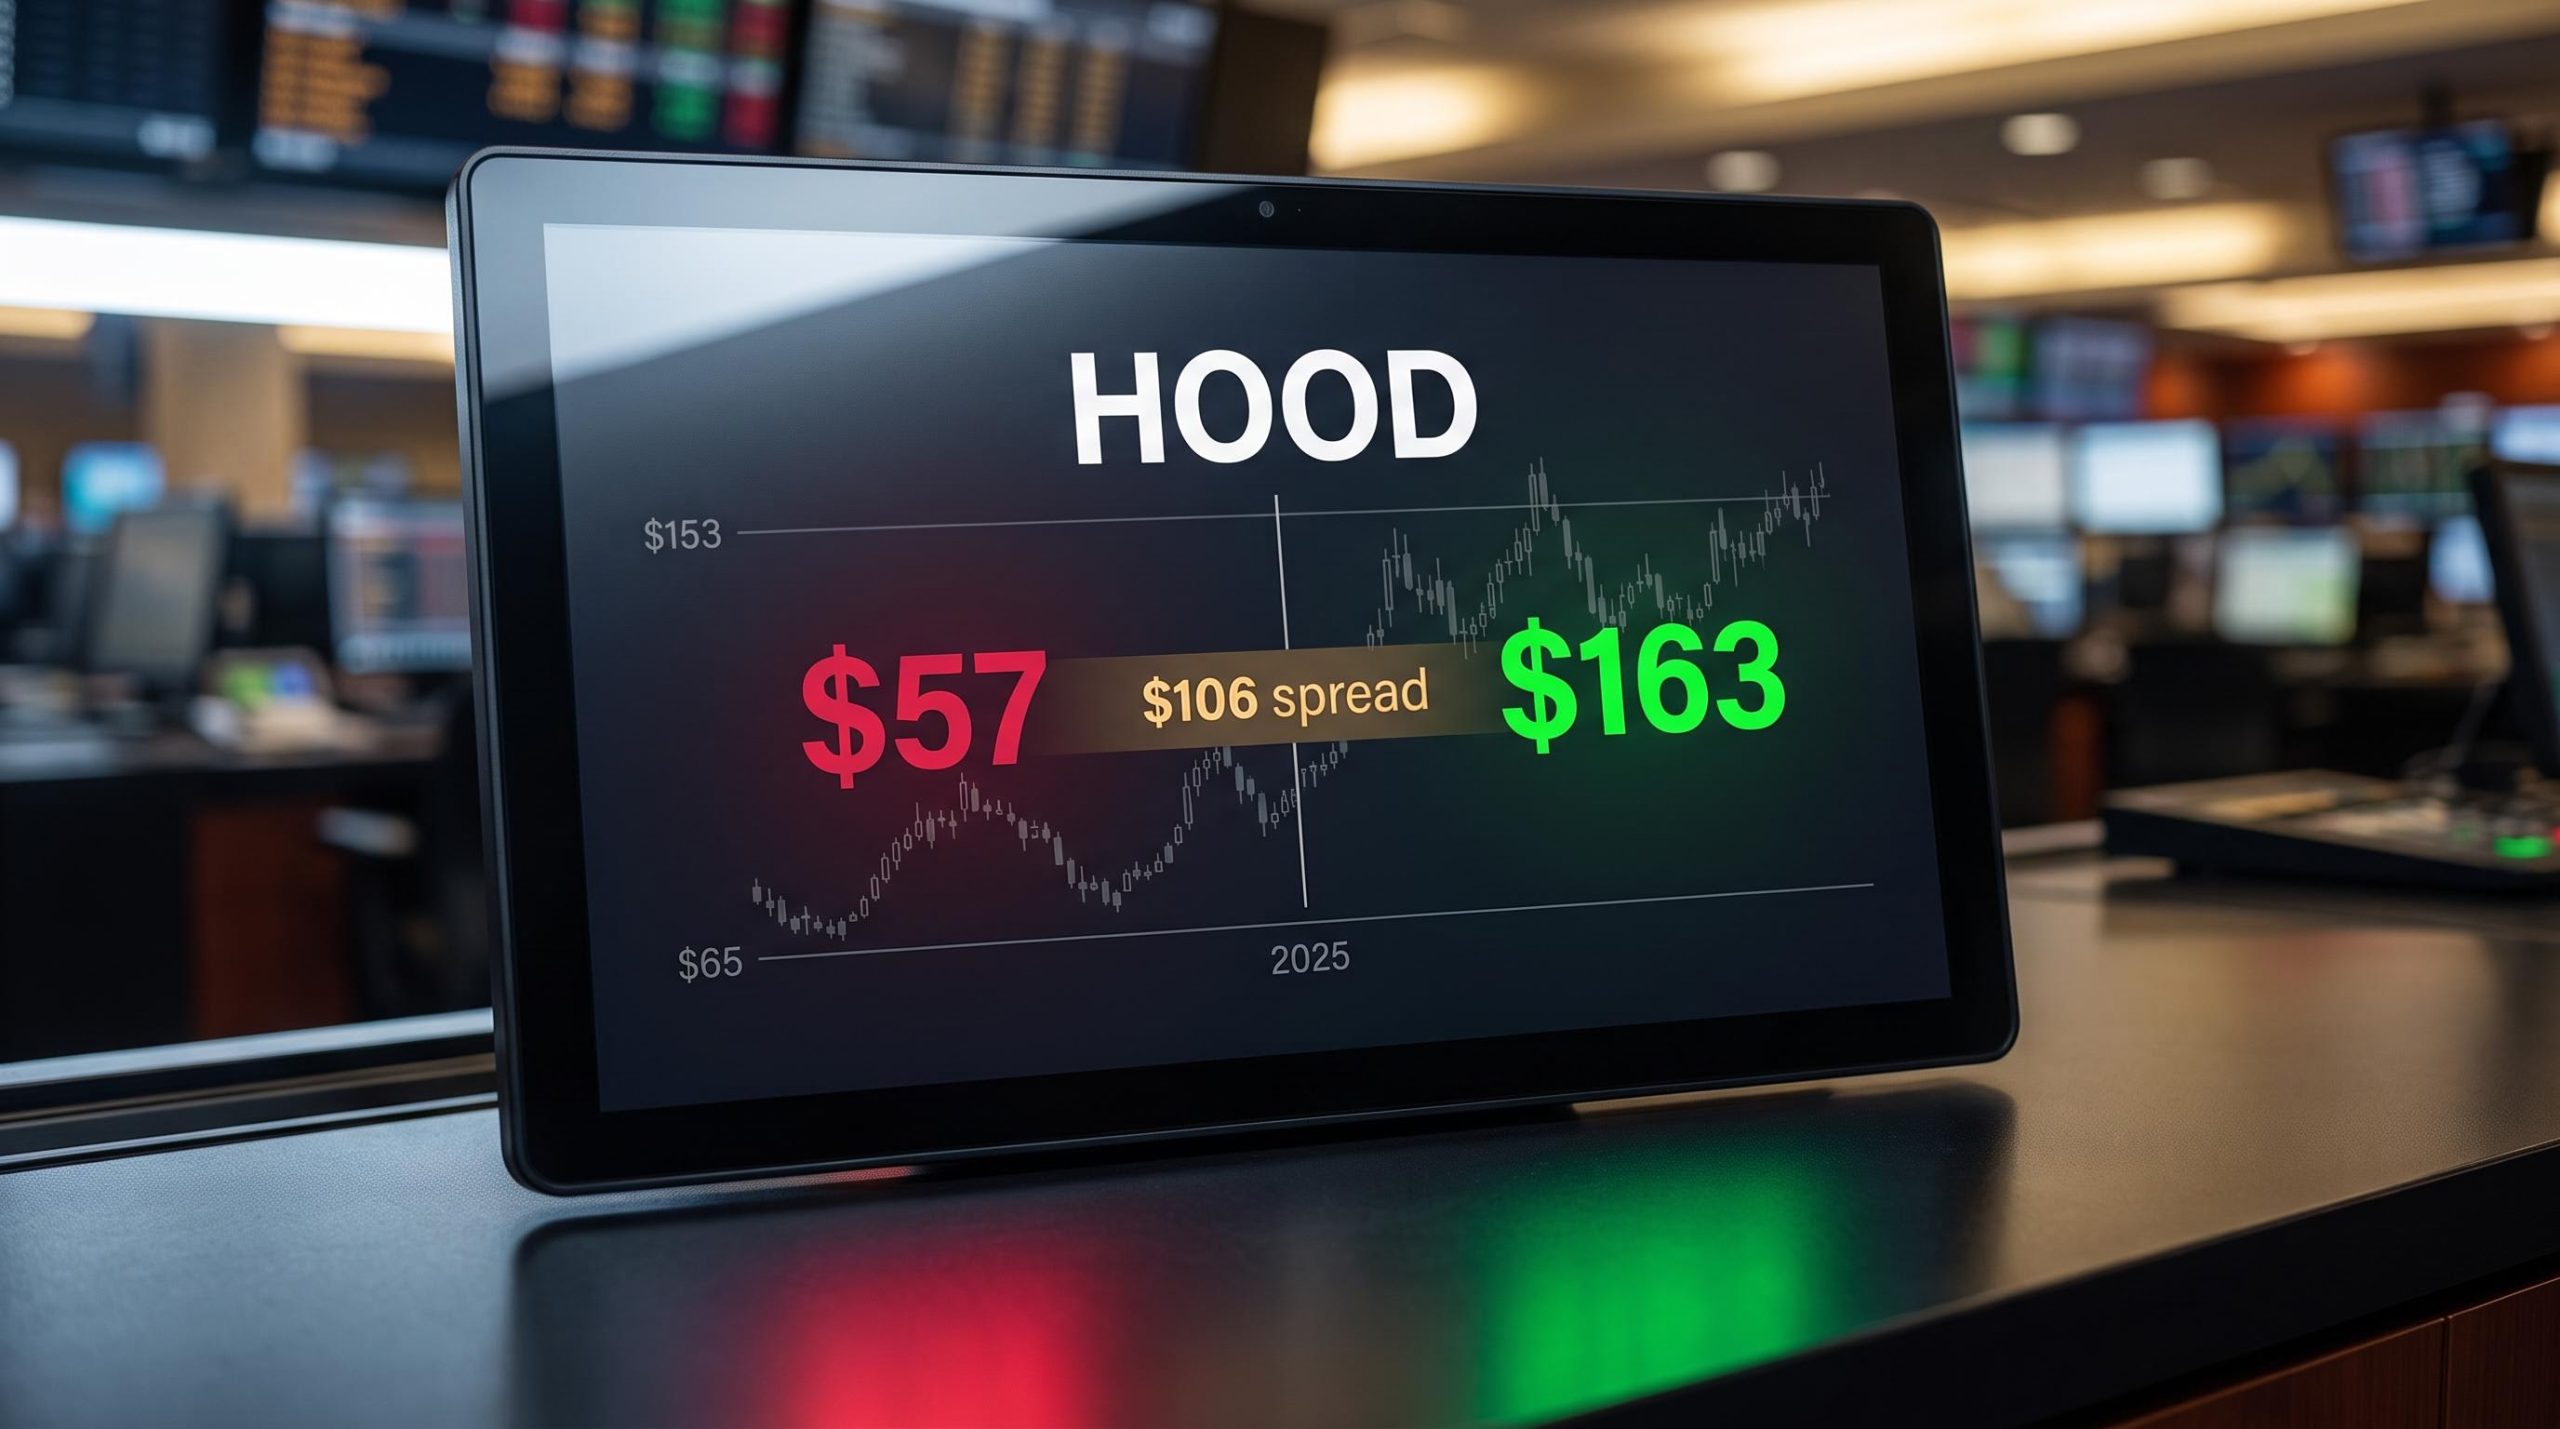
On any given day, one credible Wall Street analyst believes Robinhood is worth $57. Another believes it is worth $163. Both are operating from internally consistent professional models, using the same publicly available financial data, and arriving at conclusions separated by $106 per share. That is not a rounding error. It is one of the widest price target dispersions among actively covered U.S. financial stocks.
The gap matters because it is not theoretical. Robinhood has logged a realised 2025 price range of roughly $65 to $153 within a single year, which means the analyst spread is a near-perfect map of what the stock has actually done. Investors who anchored on the consensus target of approximately $120 missed the story entirely. The more informative signal was always the width of the band, not the midpoint.
This piece gives you a structured framework for reading that analyst disagreement as a scenario map rather than a failed forecasting exercise. After reading, you will know which three assumptions drive the spread, whether HOOD fits your actual risk posture, and how to use the dispersion itself to inform a position decision rather than simply observe the controversy.
A $106-per-share gap: what the analyst spread actually reflects
The numbers are stark. According to data compiled across StockAnalysis.com, PriceTargets.com, and Ticker Nerd, the lowest individual analyst target on Robinhood sits at $57. The highest is $163.60. The consensus average, drawn from a pool of 20-28 analysts depending on the provider, lands at approximately $119.93. The prevailing consensus rating is a buy.
$57 low target. $163.60 high target. $106-per-share spread across 20-28 analysts with a buy consensus.
What is that spread actually telling you? It helps to start with what it is not:
- It is not a forecasting error by a handful of analysts who missed their models
- It is not outlier contamination, where one extreme target distorts the range
- It is not temporary disagreement that will converge as more data arrives
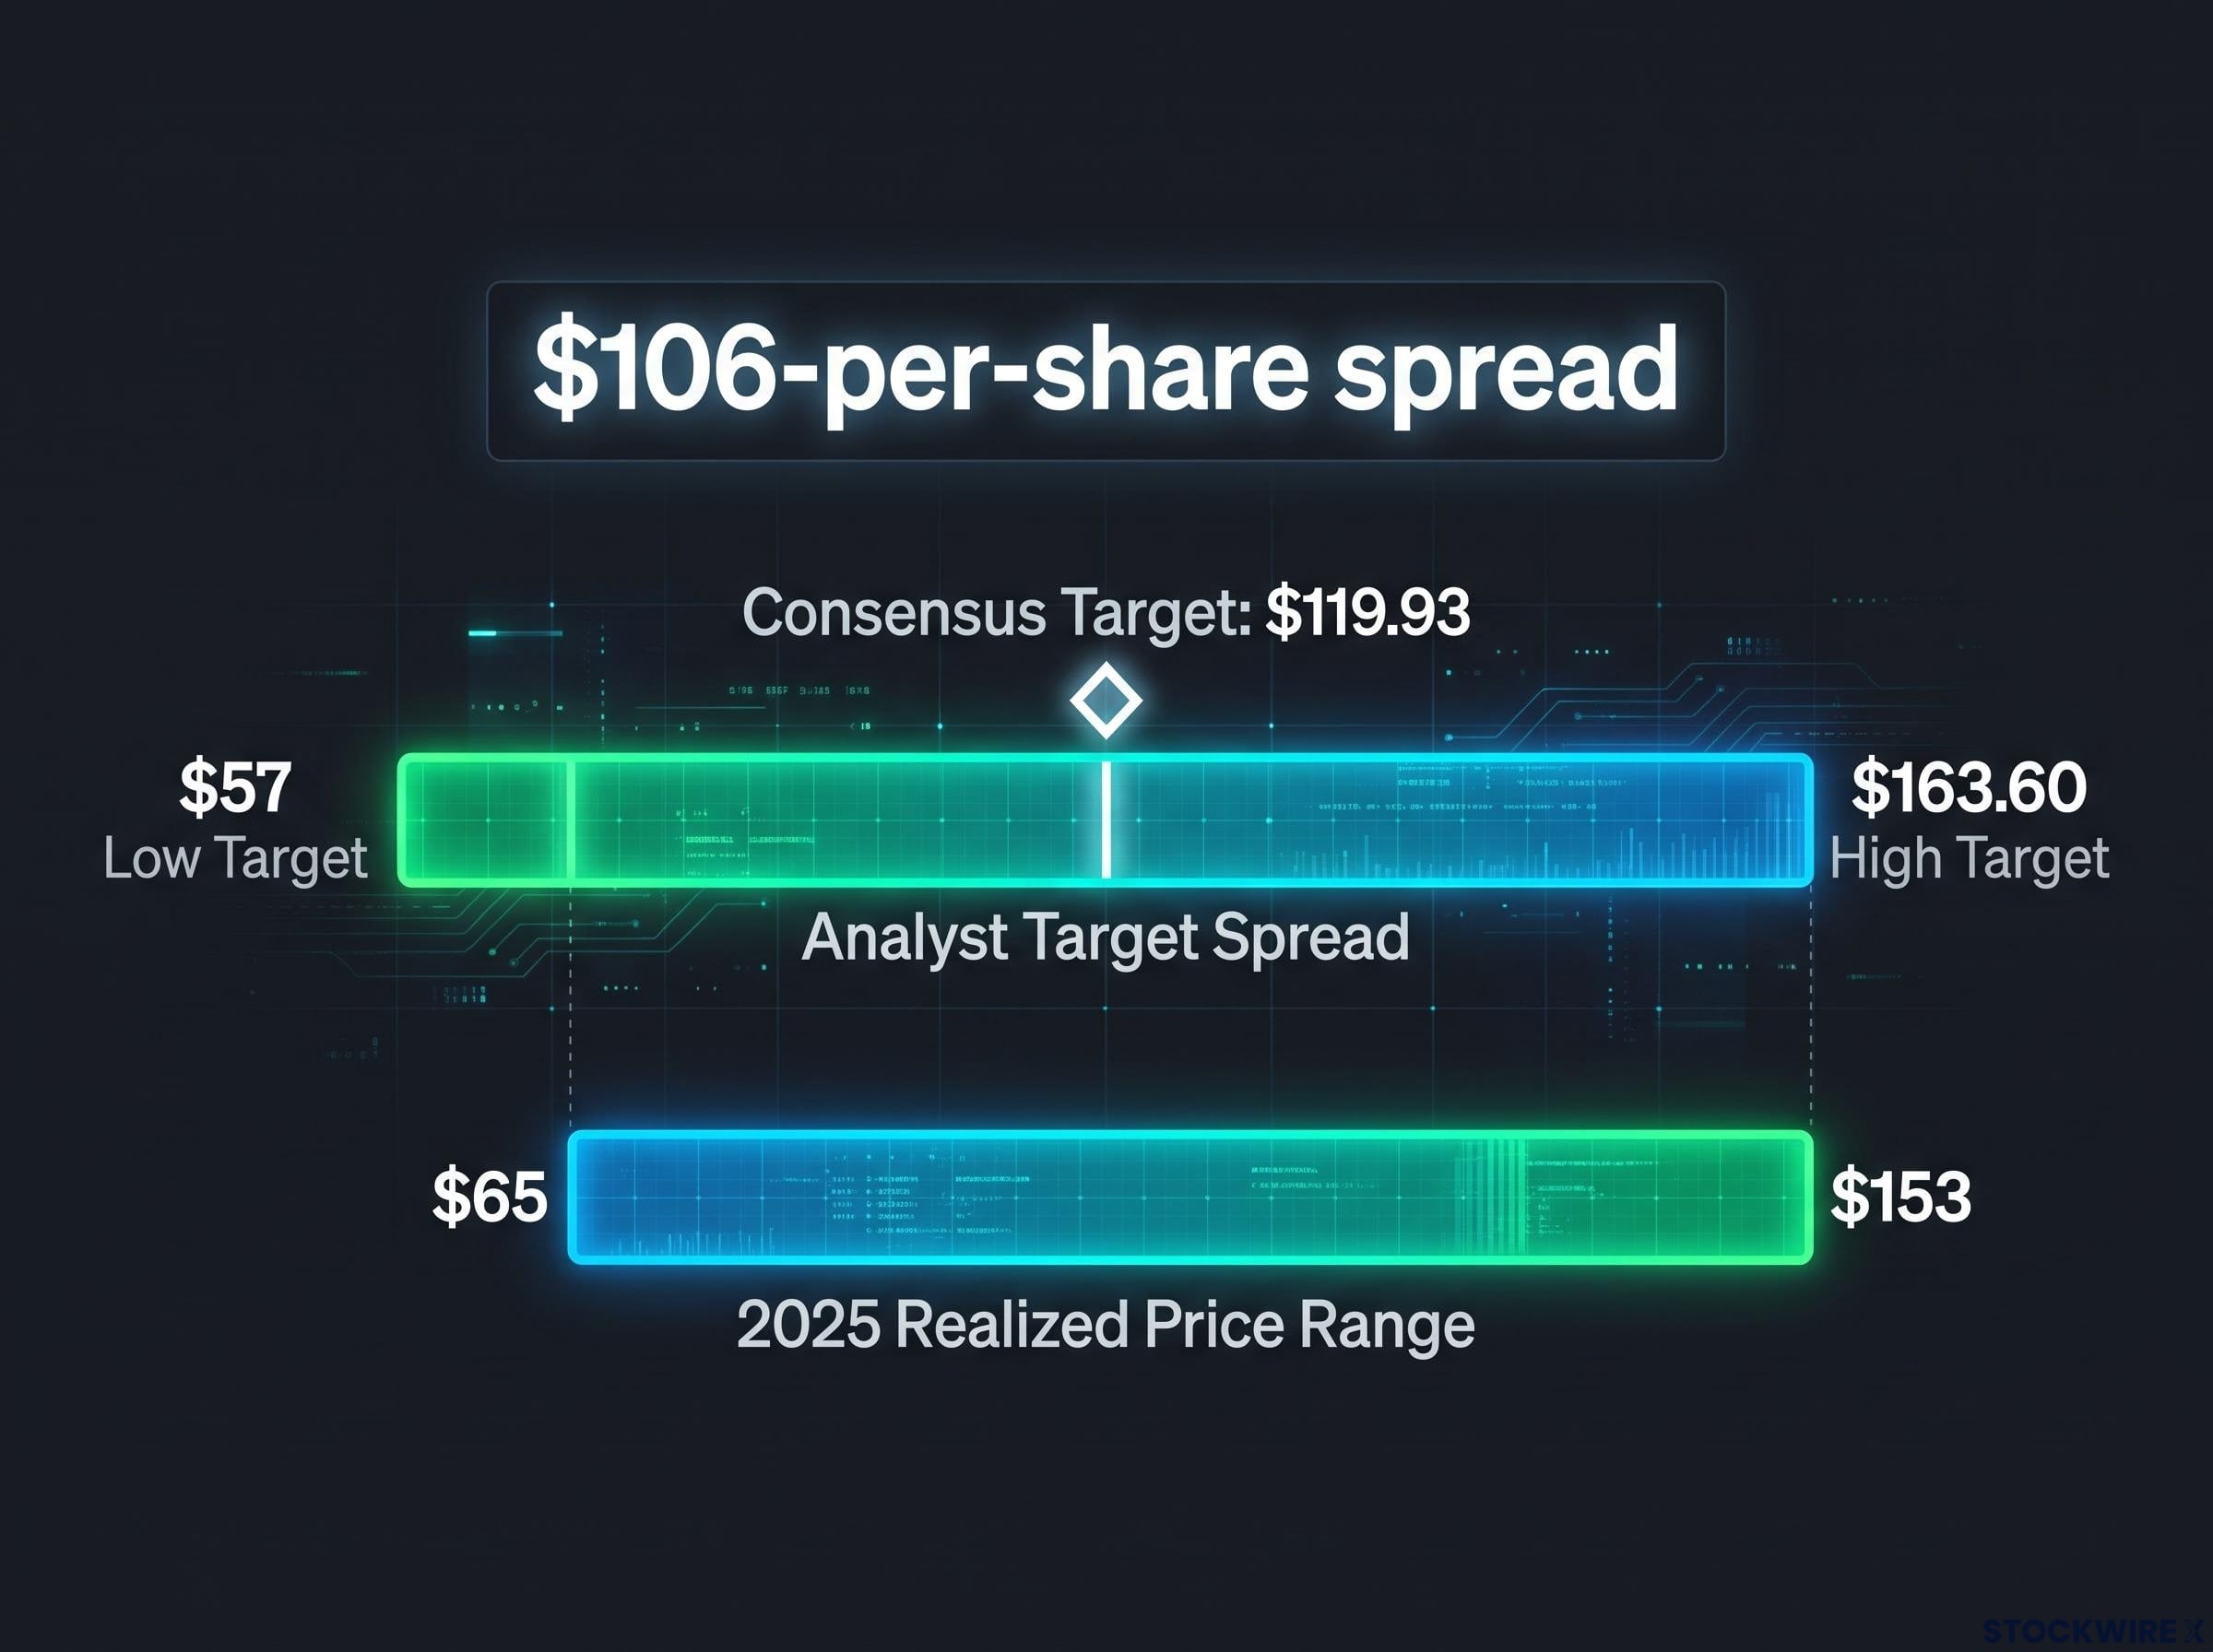
Even Tom Lee, one of the more prominent cautious voices on the stock, issued his call with HOOD closing near $98, after which shares subsequently rose to approximately $107. His position falls within the wide band rather than standing outside it. When a stock’s realised annual price range ($65 to $153) maps almost exactly onto the analyst target spread ($57 to $163), the market is already pricing in the full scenario distribution the Street has modelled. Anchoring on any single target is a category error.
When big ASX news breaks, our subscribers know first
Why Robinhood resists standard valuation: the crypto dependency loop
The spread exists because Robinhood’s earnings are, in large part, a derivative of Bitcoin’s price. That relationship is not a loose correlation. It is a causal chain that feeds on itself.
How crypto moves become earnings estimates
The mechanism unfolds in four steps:
- Crypto prices move meaningfully in either direction
- Retail trading volumes on Robinhood’s platform respond, surging during rallies and compressing during drawdowns
- Transaction-based revenue shifts proportionally, given that crypto trading fees remain a material share of the revenue mix
- Sell-side analysts revise their earnings estimates to reflect the new volume regime, which in turn moves their price targets
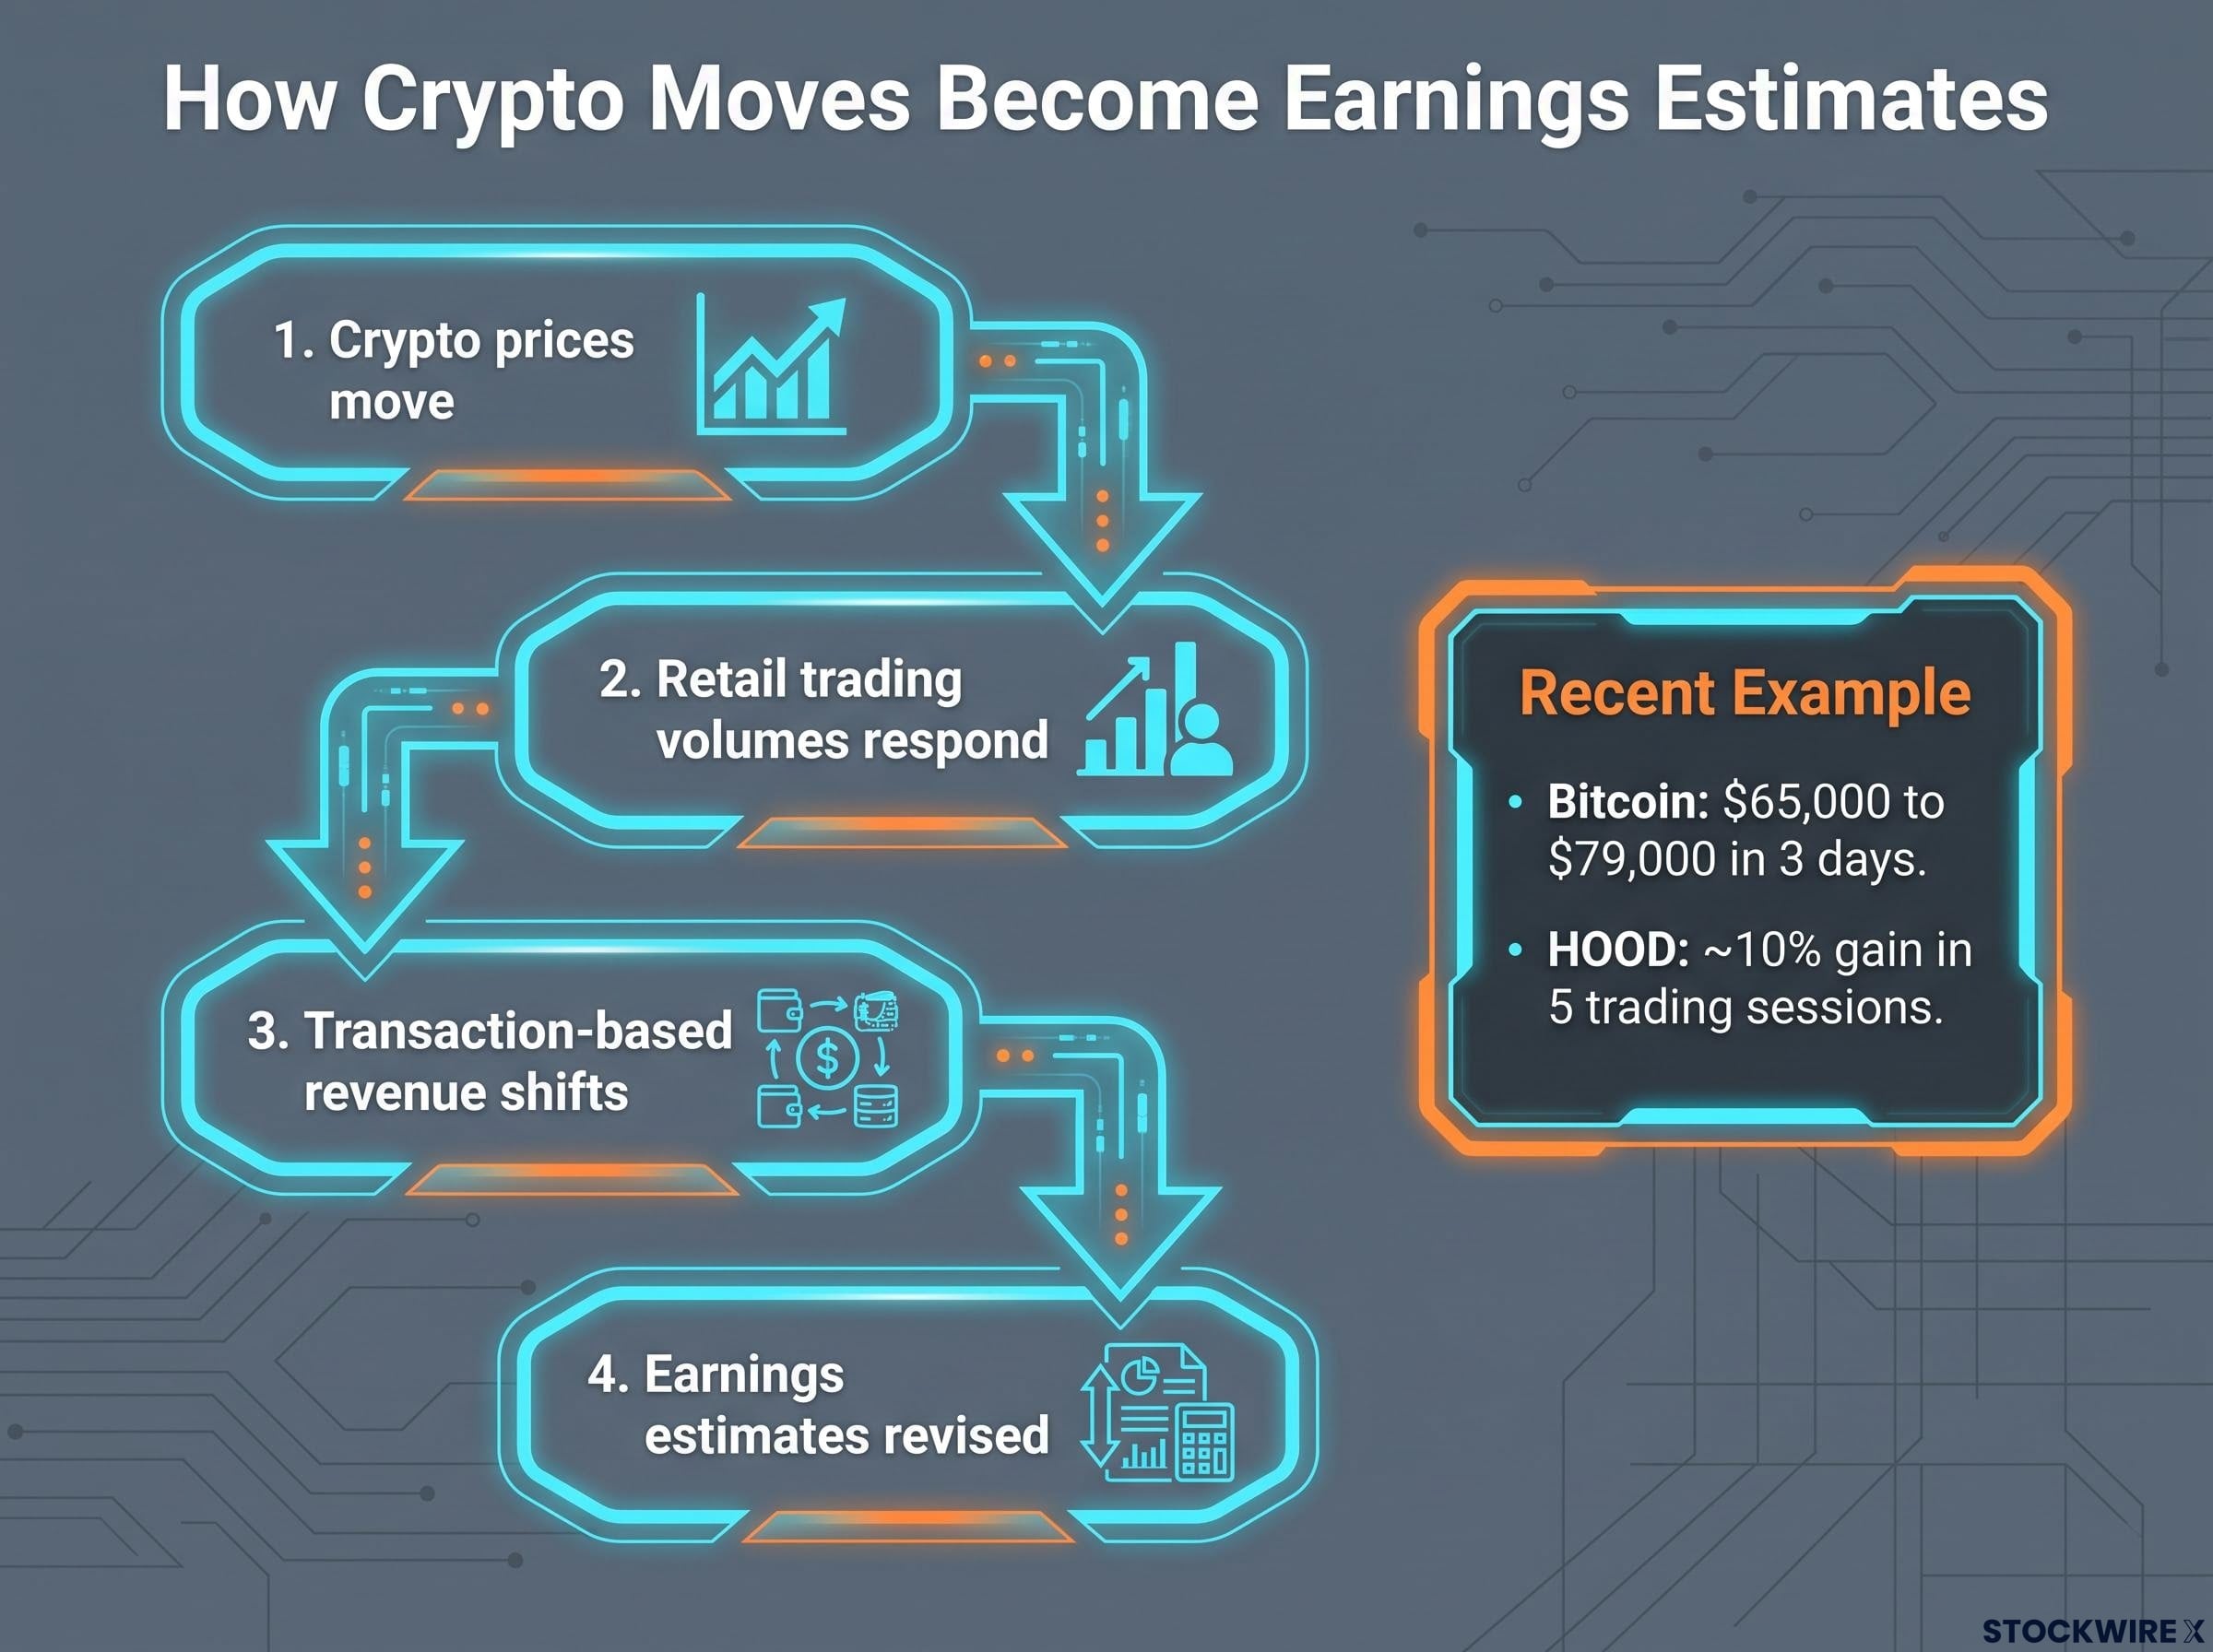
This played out in real time during a recent period when Bitcoin climbed from approximately $65,000 to $79,000 across a 3-day window. Both Robinhood and Coinbase, as crypto-exposed equities, saw a notable uptick in investor attention as traders rotated into names with direct exposure to the move. HOOD posted a gain of roughly 10% in just five trading sessions, had built up approximately 50% in returns over the preceding six months, and yet sat close to unchanged on a year-to-date basis at one point during that same stretch.
Robinhood carries a beta of approximately 2.3, confirming its elevated sensitivity relative to typical financial sector names. For you as an investor, that asymmetry is not a curiosity but the central fact around which any position sizing decision must be built. When markets move, HOOD moves harder in both directions, and standard discounted cash flow assumptions become structurally unstable when the key input variable is itself sentiment-driven and resistant to mean reversion.
Macro scenario sensitivity is not a HOOD-specific problem: high-multiple growth stocks with earnings tied to retail risk appetite sit at the intersection of crypto regime conditions and broader fiscal and monetary outcomes, meaning a shift in the macro environment can simultaneously compress the multiple and reduce the earnings base that multiple is applied to.
Three axes of disagreement that compound into a $106 spread
Three independently reasonable assumptions, held simultaneously, produce either a $57 or a $163 target without either analyst making a logical error. The spread is not a mystery. It is arithmetic.
| Axis | Bullish assumption | Bearish assumption |
|---|---|---|
| Crypto regime | Sustained or recurrent elevated crypto prices drive higher transaction volumes and operating leverage | Structurally lower crypto volumes, regulatory headwinds, or normalised retail speculation compress earnings power |
| Revenue mix | Net interest income growth, payment-for-order-flow economics, and new product lines (including prediction markets) reduce cyclical dependence | Revenue remains sentiment-driven and cyclical for years, warranting a lower and more volatile multiple |
| Competitive position | Durable brand strength with younger investors and ongoing product innovation support premium margins | Incumbents and neobroker entrants compress margins, limiting premium multiple sustainability |
The compounding effect is what makes the spread so wide. Robinhood reported 2025 full-year revenue of $4.47 billion, representing approximately 51.58% year-over-year growth. Trailing twelve-month revenue stands at approximately $4.93 billion. The business is growing, but concentration risk in crypto-sensitive transaction revenue means the growth rate itself is uncertain.
An analyst bearish on all three axes arrives at $57. An analyst bullish on all three arrives at $163. Both are internally consistent.
For you, these three axes are not just analytical categories. They are a checklist. Before taking a position in HOOD, you need an explicit personal view on each one, because the stock’s return is more sensitive to which scenario you are right about than to almost any other variable.
HOOD as a fintech stock and a crypto proxy: why the dual identity matters for valuation
Robinhood does not fit cleanly into either the traditional brokerage peer group or the crypto-native equity peer group. That is not a branding problem. It is a structural valuation problem that makes standard peer comparison and benchmarking approaches unreliable.
When the peer group doesn’t fit
The company generates revenue across four primary streams: transaction-based revenue (including payment for order flow), net interest income, emerging product lines, and ancillary services. That mix looks like a fintech brokerage on paper. But when Bitcoin moves $14,000 in three days and HOOD responds with a 10% advance, the stock is behaving like a crypto proxy. Investors who benchmark it against Charles Schwab or Fidelity will systematically misprice it in both directions.
Indiscriminate market repricing that punishes structurally different businesses equally is a recurring pattern, and the valuation disconnect in financial sector stocks undergoing narrative-driven selloffs frequently creates measurable mispricing that a three-axis screening framework can surface, a dynamic that applies with equal force to names where the revenue mix is misread by benchmarking against the wrong peer group.
The SEC staff bulletin on payment for order flow conflicts identifies PFOF arrangements as a category of structural conflict requiring active management, a designation that bears directly on how Robinhood’s transaction-based revenue model is scrutinised by regulators and, in turn, how bearish analysts model its regulatory risk premium.
The more useful mental model treats HOOD as embedding substantial option value on future crypto and product outcomes. Three characteristics reinforce this framing:
- A beta of approximately 2.3, far above typical financial sector names
- Narrative-driven price swings that track crypto sentiment more than earnings revisions
- A realised 2025 price range of $65 to $153 (with a 52-week range of $63.52 to $153.86), broadly consistent with the $57 to $163 analyst target spread
The correct mental model is not a mature brokerage earning a stable multiple. It is a high-beta option on the retail trading and crypto ecosystem. Getting that categorisation right prevents the most common valuation mistake: applying the wrong peer group, wondering why the stock behaves nothing like the comparison, and drawing the wrong conclusions.
Reading the spread as a scenario map: how to use analyst disagreement as an investor
The $57 to $163 range is most useful when you stop treating it as a controversy and start treating it as a structured scenario map with two clearly defined endpoints.
| Bear case ($57) | Bull case ($163) |
|---|---|
| Prolonged crypto weakness compresses transaction volumes | Sustained crypto strength drives elevated retail activity |
| Revenue diversification progresses slower than modelled | New product lines meaningfully reduce cyclical dependence |
| Competitive margin pressure from incumbents and neobrokers | Durable positioning with younger investors supports premium margins |
The consensus target of approximately $119-$120 is useful only as a rough midpoint calibration. A gain of around 50% over a six-month window sitting alongside near-flat year-to-date returns during parts of the same period shows how abruptly the prevailing narrative, and the share price with it, can reverse. The realised 2025 range of $65 to $153 is the concrete illustration of what drawdown and rally magnitudes you must be prepared to absorb.
Probability-weighted scenario analysis valuation converts the bull, base, and bear endpoints into a single blended expected return that can be tested against a required internal rate of return at any given entry price, a method that is particularly well-suited to stocks where the narrative is in flux and standard peer multiples provide almost no useful signal.
Before sizing a HOOD position, answer three questions:
- What is your explicit view on the crypto regime over your holding period?
- What timeline do you assign to meaningful revenue diversification?
- What drawdown magnitude can you absorb without altering your thesis?
The practical implication is not a buy or sell recommendation but a sizing and framing decision. If you hold HOOD without a defined view on all three axes and a predetermined drawdown tolerance, you are not taking a calculated risk. You are taking an undefined one. A stock with this level of fundamental and sentiment uncertainty fits more naturally as a satellite position sized to drawdown tolerance, not a core holding.
Short-term traders are effectively expressing a view on near-term crypto dynamics. Long-term investors are underwriting a fintech franchise thesis. Both investment cases are compatible, but they require different monitoring frameworks, different entry and exit criteria, and very different tolerance for interim volatility.
What extreme analyst dispersion signals about HOOD’s investment case
Robinhood is not hard to value because analysts are underperforming. It is hard to value because its future cash flows are structurally tied to macro variables, principally crypto market conditions and retail risk appetite, that no one can reliably forecast. At $163.60, the highest published target stands at a ratio to the lowest target of $57 that represents an unusual degree of dispersion for any widely followed name in the U.S. financial sector.
The realised 2025 range and 52-week range of $63.52 to $153.86 confirm that the analyst spread was not theoretical but has already materialised in price behaviour. Revenue growth of approximately 51.58% year-over-year in 2025 shows the bull case is not without foundation, but the volatility of the underlying drivers means that growth rate is itself uncertain.
The wide target range is a feature of Robinhood’s investment case, not a flaw in how it is being analysed.
For investors, the persistence of extreme analyst dispersion is a forward-looking signal. Until Robinhood demonstrably shifts its revenue mix away from crypto-driven transaction revenue, this range will not compress. Anyone holding the stock is holding that uncertainty whether they acknowledge it or not. The appropriate response is not to pick the “right” target. It is to decide which scenario you believe in, size the position accordingly, and recognise that when a stock’s analyst spread approaches three times at the extremes, it is pricing genuine multi-scenario uncertainty. That signal itself is useful information for portfolio construction, regardless of which direction you lean.
Crypto allocation sizing for risk-tolerant investors broadly converges on a 1-5% range when four pre-conditions are met: a funded emergency reserve, cleared high-interest debt, a written position plan with a minimum four-plus year holding period, and tested readiness for drawdowns exceeding 50%, conditions that translate directly into how much indirect crypto exposure through a name like HOOD is appropriate in a broader portfolio.
This article is for informational purposes only and should not be considered financial advice. Investors should conduct their own research and consult with financial professionals before making investment decisions. Past performance does not guarantee future results. Financial projections are subject to market conditions and various risk factors.