
Coverage of Microsoft spans 55 analysts. Not one carries a Sell rating. And the most optimistic among them thinks the stock is worth more than twice what the most cautious one does.
That $470 gap between a $400 floor and an $870 ceiling is not a measurement error. It is the market’s clearest signal that the central question in the largest valuation exercise in technology right now has no agreed answer: does Microsoft’s projected $209 billion in capital expenditure eventually translate into shareholder returns, or does it quietly compress them for years while earnings headlines look strong?
Here is the framework for understanding both sides of that debate, the specific financial mechanics each camp is reading differently, and a practical checklist for deciding which interpretation fits what you are actually seeing in the numbers. The analysis draws on Microsoft’s fiscal 2026 results and the full distribution of analyst targets as of late August 2026.
What a $470 target spread actually tells you about MSFT
Start with what is easy to misread. Zero Sell ratings across 55 analysts does not mean Wall Street is uniformly bullish on where the stock goes next. It means three things:
- The underlying business is regarded as fundamentally high-quality at or near current prices, even under conservative assumptions
- No institutional analyst is willing to argue the stock is overvalued enough to warrant telling clients to exit entirely
- The disagreement is about how much upside exists, not whether the business is structurally sound
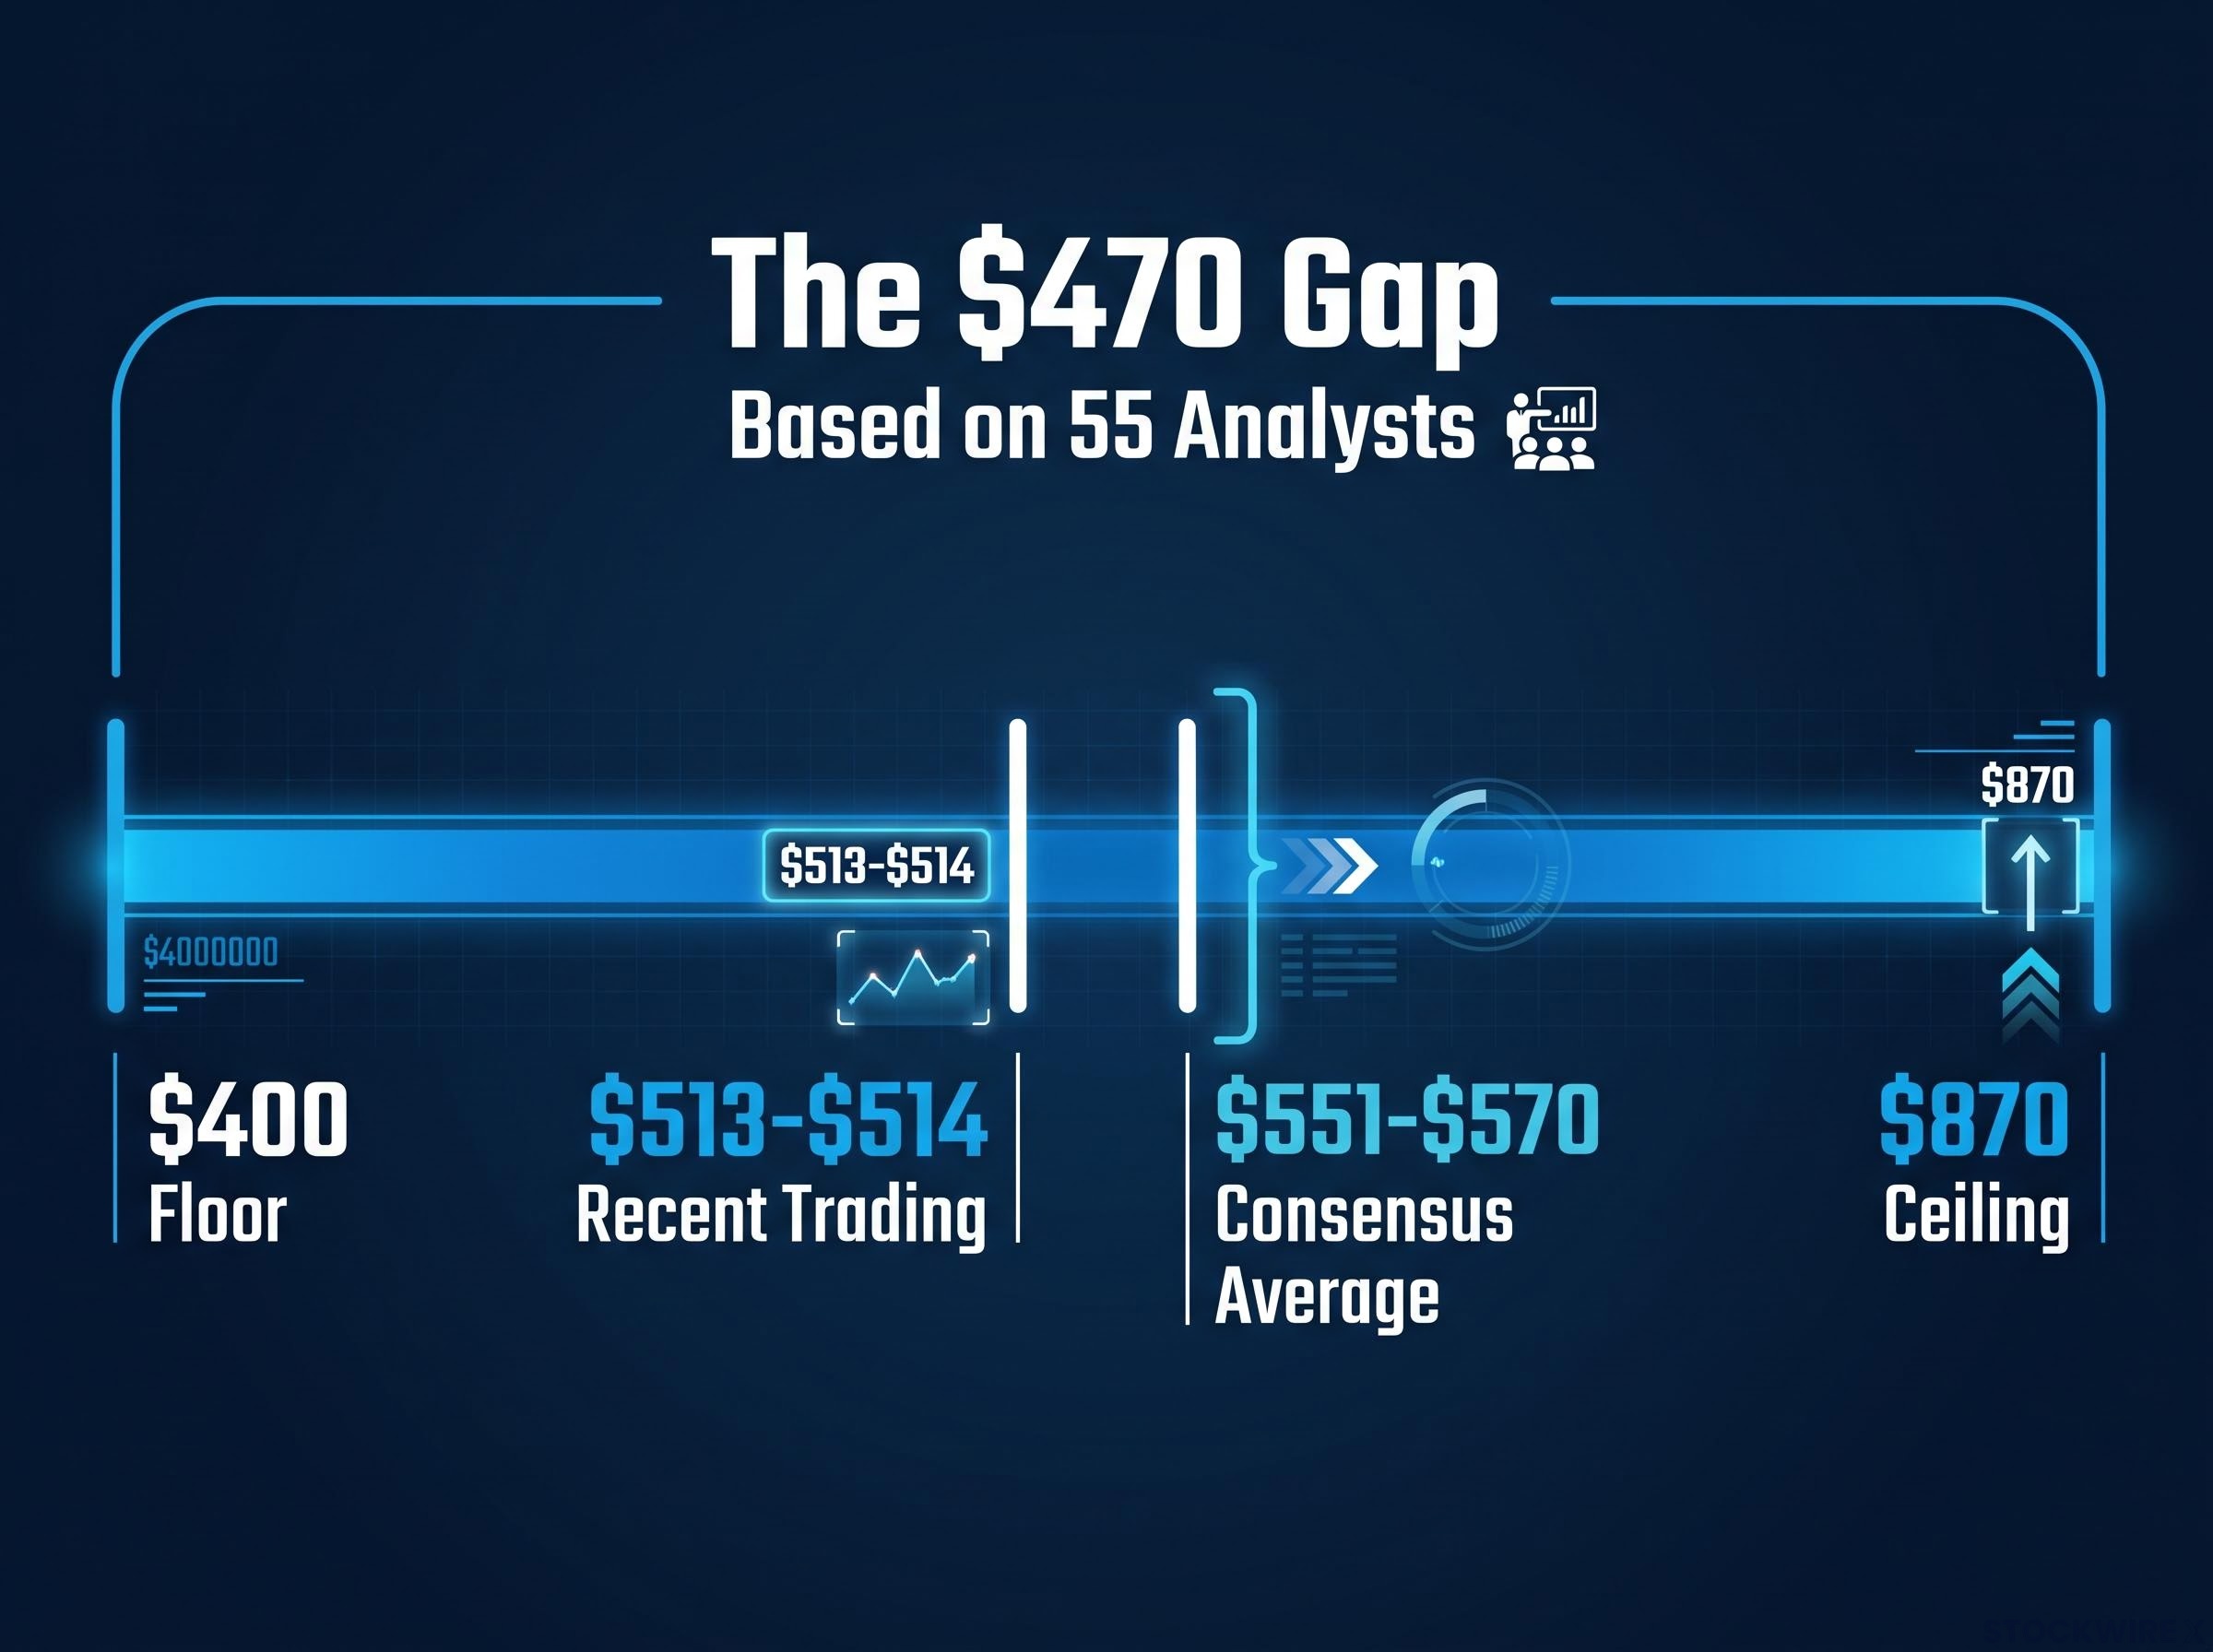
That distinction matters. When 93% of ratings are Buy or Strong Buy, the instinct is to treat the consensus target as a reliable forward indicator. The consensus average sits at roughly $551-$570, implying about 7-11% upside from recent trading levels near $513-$514. Straightforward enough on the surface.
Why consensus alone is a misleading anchor
The problem is that the $551-$570 average is the arithmetic mean of inputs ranging from $400 to $870. A wide range of valuation models, built on incompatible assumptions, yields an average figure that reflects no single analyst’s genuine estimate. It lands in the middle of two fundamentally different readings of what Microsoft’s capex programme will deliver.
The ratio between the high and low targets is approximately 2.2x, an unusually wide spread for any single company at this market capitalisation, and almost entirely attributable to divergent assumptions about AI infrastructure returns.
When the spread is this wide, the useful analytical exercise is not to anchor on the midpoint. It is to examine both extremes, understand the assumptions embedded in each, and evaluate which model’s inputs match the data Microsoft is actually reporting quarter by quarter. The capex question ultimately has one answer, and your assessment of which framework is tracking toward that answer carries more weight than any blended consensus figure.
Goldman Sachs published research on 3 August 2026 arguing that the primary risk in tech has migrated away from stretched P/E multiples toward earnings growth expectations now embedded in prices, with dividend discount model analysis showing the tech sector’s implied 10-year earnings CAGR has already surpassed the 2000 dot-com peak, a finding that frames Microsoft’s $551-$570 consensus average as a bet on a specific earnings trajectory rather than a valuation cushion.
When big ASX news breaks, our subscribers know first
The numbers that both sides are reading differently
Microsoft’s fiscal 2026 results, reported in July 2026, look strong by almost any conventional measure.
Revenue reached $331.8 billion, up 18% year over year. Net income hit $133.7 billion, a 31% increase. Operating cash flow climbed to $182.9 billion, up 34%. On an income statement, this is a company executing at an elite level.
Then you look at where the cash went.
| Fiscal Year | Capex (Property & Equipment) | Operating Cash Flow | Free Cash Flow | Capex as % of Operating CF |
|---|---|---|---|---|
| FY2023 | $28.1B | — | — | — |
| FY2024 | $44.5B | — | $74.1B | — |
| FY2025 | $64.6B | — | $71.6B | — |
| FY2026 | $115.9B | $182.9B | $67.0B | ~63% |
Capital expenditure on property and equipment quadrupled in three years. Management has guided calendar 2026 capex (including certain finance leases) at approximately $175 billion, and the market’s estimate for 2027 has been revised upward from $167 billion to $209 billion. A note on definitions: published capex figures vary depending on whether they include finance leases alongside property and equipment additions, which is why some sources cite higher figures for earlier years.
Free cash flow fell from $74.1 billion in fiscal 2024 to $67.0 billion in fiscal 2026, even as net income rose 31%. That divergence is the single most important number in this analysis, because it shows that earnings headlines are not capturing the full cost of the AI build-out that shareholders are bearing.
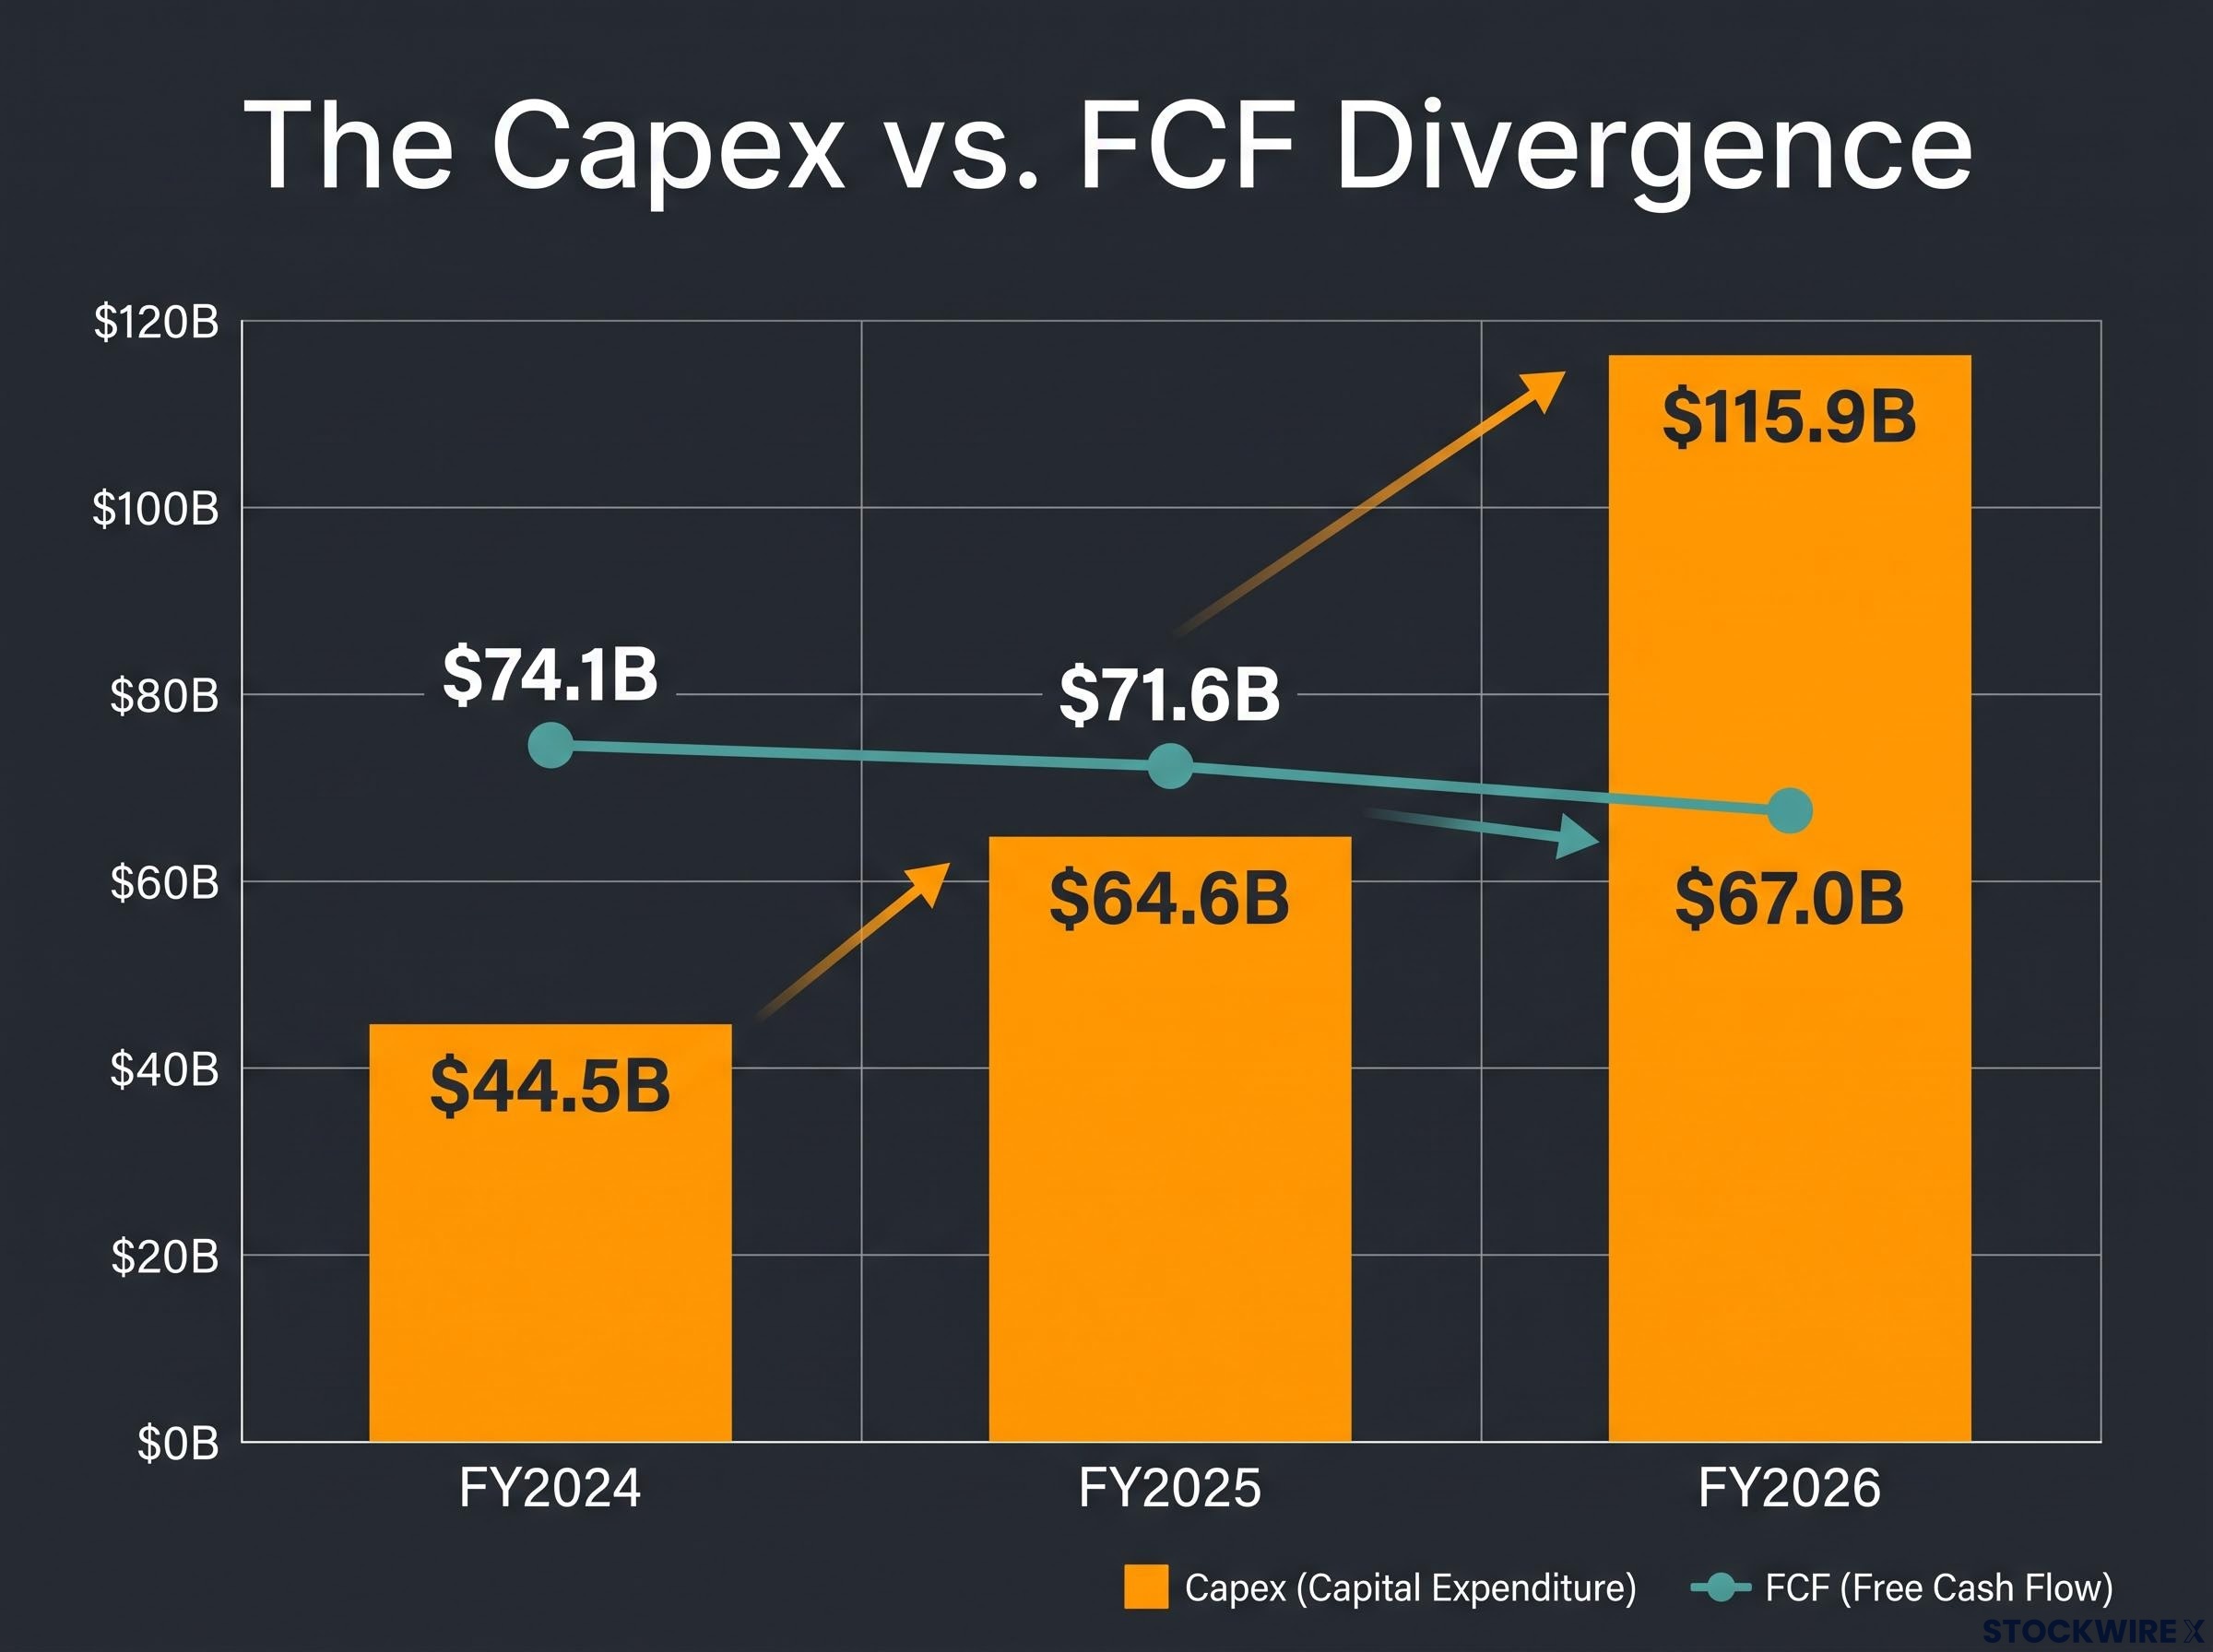
Operating cash flow grew 34%. Capex grew faster. The result is a company reporting record profitability while the cash actually available to shareholders, the free cash flow after infrastructure spending, quietly declined. Understanding why reported earnings per share can look healthy while true distributable cash flow is falling is the mechanism by which the $209 billion capex estimate becomes a valuation problem rather than just a headline number.
The divergence between Microsoft’s record net income and declining free cash flow is a specific instance of a broader earnings-quality problem: free cash flow vs EPS tells systematically different stories when capital expenditure is accelerating, and Morgan Stanley’s analysis of S&P 500 companies found that stocks with EPS beats but falling FCF estimates underperformed peers by 0.2% while cash-backed beats outperformed by 1.6%.
Two frameworks, two very different stock prices
The $470 target spread maps almost perfectly onto two internally coherent frameworks. Neither is analytically lazy. They simply disagree about what happens next.
Framework 1 treats Microsoft as a mature compounder facing a structural capex headwind. The core assumption is that AI features like Copilot are largely defensive, preserving Microsoft’s existing position in enterprise software rather than opening genuinely new profit pools. Capex stays elevated at a high-teens to 20%-plus share of revenue for years. Free cash flow therefore runs far below reported earnings, and the stock’s apparent price-to-earnings cheapness is misleading because it trades at a much richer multiple of true free cash flow. Analysts in this camp also note that Copilot’s rollout is tied partly to its bundling within the Windows ecosystem rather than being driven by independent purchasing choices, which carries different implications for sustainable pricing power.
This framework produces targets near $400, anchored on discounted cash flow models that hold capex at structurally elevated levels.
Framework 2 positions Microsoft as the foundational layer of enterprise AI, playing a role comparable to what Windows once did for the personal computer era. The core assumption is that Microsoft’s cloud and AI infrastructure becomes the default layer for enterprise workloads, much as Windows became the default for the personal computer. AI-enhanced products, including Azure AI, Copilot across Microsoft 365, and developer tools, scale into high-margin, recurring revenue streams atop that infrastructure. Current capex is front-loaded rather than structural; once the infrastructure is built, revenue and margins grow faster than incremental capital needs, and free cash flow catches up.
This framework produces targets of $700-$870, assuming sustained double-digit growth, durable competitive advantage, and eventual normalisation of capex as a share of revenue.
Framework 2’s assumption that Azure becomes the default enterprise AI layer carries a structural vulnerability that the capex model alone does not capture: Azure concentration risk from OpenAI’s confirmed compute partnerships with both AWS and Google Cloud means that approximately 45% of Azure’s reported backlog attributed to a single counterparty could shift, eroding the exclusivity that underpins the platform’s competitive advantage thesis.
| Dimension | Framework 1: Mature Compounder | Framework 2: Enterprise AI Platform |
|---|---|---|
| Capex assumption | Stays elevated for years (high-teens to 20%+ of revenue) | Front-loaded; normalises as infrastructure build completes |
| FCF trajectory | Suppressed or declining for an extended period | Recovers as revenue scales faster than incremental capex |
| AI product characterisation | Defensive; protects existing franchise | Value-creating; opens new high-margin revenue streams |
| Valuation anchor | Free cash flow (reveals true shareholder returns) | Earnings and forward revenue (captures growth trajectory) |
| Implied target range | ~$400 | $700-$870 |
Both frameworks accept Microsoft’s 14.7% nine-year revenue compound annual growth rate (CAGR) as the quality foundation. Neither camp disputes the underlying quality of the business. The real question is whether the capital intensity required to sustain that quality will ultimately benefit shareholders or steadily erode their returns.
What the most recent earnings report added to the debate
The stock’s response to Microsoft’s most recent quarterly results was striking: shares moved from below $400 to around $516-$517 over the course of a few weeks. This came at a time when numerous other technology companies posted beats yet still saw their share prices fall.
Bulls read this as confirmation that AI capex is beginning to generate tangible, repeatable cash flows, and that investors are endorsing Framework 2. That interpretation is not without foundation. But a positive market reaction reflects a shift in sentiment, not a definitive resolution of the capex question. The $209 billion 2027 estimate still sits in front of the company, and free cash flow still declined year over year.
A practical checklist for evaluating AI-heavy technology stocks
The mechanics that drive Microsoft’s valuation debate are not unique to one company. They apply to any capital-intensive AI name where the income statement and the cash flow statement are telling different stories. Here is a six-item checklist built from the specific tensions this analysis has surfaced:
- Separate earnings from free cash flow. Subtract all capital spending, including finance leases, from operating cash flow and compare that figure to reported earnings per share. If reported EPS looks strong but free cash flow per share is flat or declining, the earnings headline is masking the true cost of the investment cycle.
- Track capex as a percentage of operating cash flow over time. A single quarter above 50% can be a timing issue. Multiple consecutive years above that level, as with Microsoft’s approximately 63% in fiscal 2026, tells you valuation should be anchored on free cash flow, not earnings.
- Monitor capex guidance revisions, not just point estimates. Microsoft’s 2027 capex estimate rose from $167 billion to $209 billion. The direction of revisions tells you whether the build-out is expanding or stabilising. Track the change, not the number alone.
- Measure revenue per dollar of capex as a trend. Compare growth in AI and cloud revenue to growth in capex across quarters. If revenue is scaling faster than capex, returns on invested capital are likely improving. If not, the spending may be more defensive than value-creating.
- Use the analyst target spread as a risk signal. A wide range between low and high targets means model assumptions are genuinely unresolved. The $470 spread on Microsoft is almost entirely about AI capex outcomes, not business quality. Look hard at the assumptions behind the extremes rather than letting them cancel each other out in an average.
- Distinguish between organic AI demand and bundled adoption. Not all AI product growth reflects the same quality of demand. Growth driven by integration into existing platforms, as with Copilot’s embedding in Windows, has different implications for pricing power than growth driven by standalone purchase decisions.
“When capex consumes more than half of operating cash flow for multiple consecutive years, valuation should be anchored on free cash flow, not EPS.”
For context, aggregate capex across the major hyperscalers has risen to approximately $1.368 trillion for the current year, up from around $687 billion the prior year, according to Perplexity research, though that figure has not been independently verified. The point is that the capex intensity question extends well beyond a single company.
The scale of Microsoft’s commitment becomes clearer against the Russell 1000 backdrop: corporate capital allocation across the index surged 27.1% year-over-year to $1.3 trillion, concentrated in AI infrastructure and entirely funded from internally generated cash, yet Morgan Stanley’s data shows free cash flow yield has fallen to a 20-year low of 2.6%, narrowing the margin of safety precisely as capex intensity peaks.
This article is for informational purposes only and should not be considered financial advice. Investors should conduct their own research and consult with financial professionals before making investment decisions.
What the capex build-out needs to deliver to close the target gap
The question for a reader considering a position in MSFT today is not which framework sounds more convincing in the abstract. It is which set of assumptions the next two to three reporting periods will validate.
Signals that would strengthen Framework 2 (enterprise AI platform):
- Azure AI and Copilot revenue growing faster than incremental capex additions
- Free cash flow stabilising or recovering while operating cash flow continues to expand
- Management guidance showing a plateau or decline in capex as a percentage of revenue
Signals that would strengthen Framework 1 (mature compounder with capex headwind):
- Capex guidance continuing to be revised upward, as it was from $167 billion to $209 billion
- Free cash flow continuing to decline despite earnings growth
- Copilot adoption metrics suggesting growth is tied to platform bundling rather than autonomous demand
“The current moment is one where the evidence is genuinely mixed, and treating either framework as settled is a mistake.”
Right now, in late August 2026, both sides have something to point to. The most recent earnings result supports bulls. The capex trajectory and free cash flow decline support bears. The stock’s 14.7% nine-year revenue CAGR confirms the business quality that makes this a valuation disagreement rather than a fundamental one. Forward revenue consensus of approximately $391 billion for fiscal 2027 gives the top-line anchor against which capex intensity will be measured.
The $209 billion 2027 capex estimate is the central number analysts will be testing against actual quarterly disclosures. Free cash flow of $67.0 billion in fiscal 2026 is the baseline to watch for stabilisation or further decline. Those two figures, tracked against each other over the next several quarters, will tell you more about which framework is right than any consensus target update.
The honest assessment is that buying MSFT today means making a bet on a specific capex outcome, not a consensus view. Knowing which signals to watch is more useful than knowing the current consensus number.
Past performance does not guarantee future results. Financial projections are subject to market conditions and various risk factors.