September is statistically the worst month for Australian equities, and you are entering it today. Across every dataset and lookback window available, the ASX 200 finishes last among all twelve months by average return. The pattern is not a single-year anomaly or market folklore. It is persistent enough, and consistent enough, that professional investors treat it as a real seasonal factor.
That consistency raises three questions worth answering before the month plays out. What does the data actually look like beneath the headline? Is there a rational explanation for why the pattern keeps recurring? And what does history say about what comes after?
Here is what the evidence tells you about all three, so you can interpret whatever September 2026 delivers with the pattern clearly in view rather than reacting to it blindly.
The numbers behind September’s worst-month reputation
The most defensible starting point is the longest verified dataset. Going back to 1980, the ASX 200 has posted an average September return of -0.42%, a figure that places it bottom of the calendar on its own.
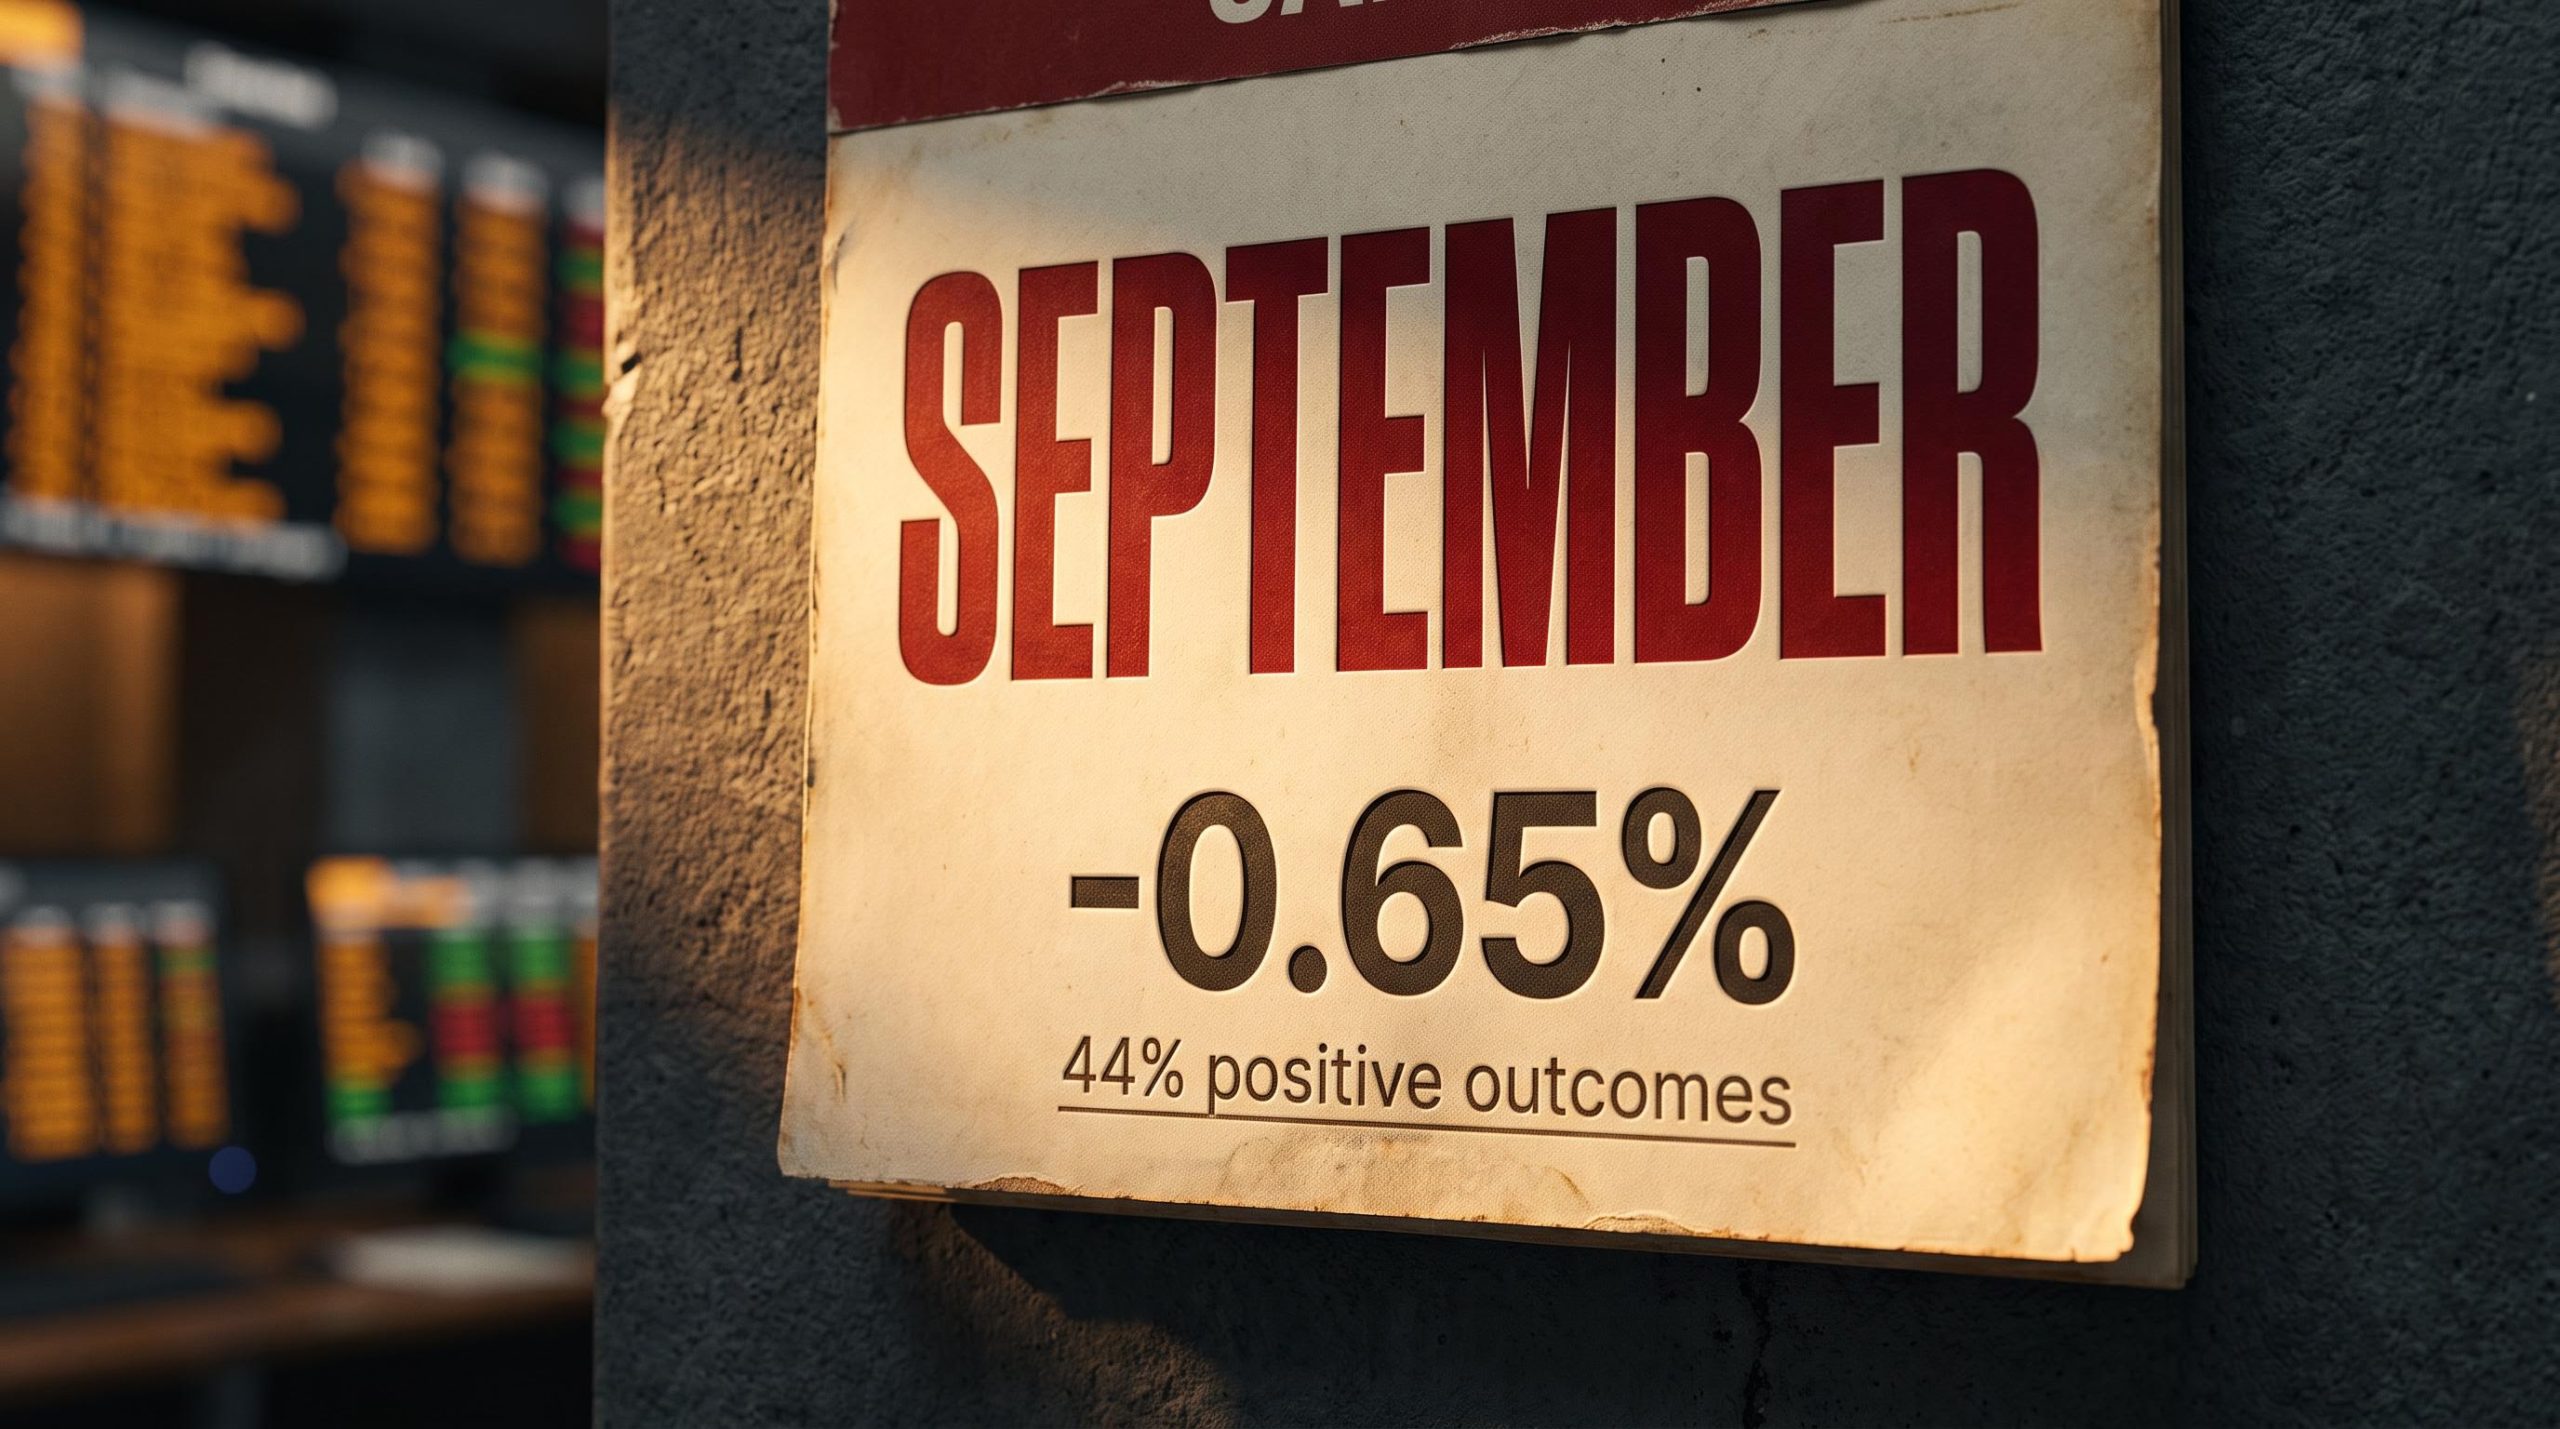
When the window shifts to the S&P/ASX 200 Total Returns Index starting from 2001, the result deteriorates further. September’s average monthly decline extends to 0.65%, and positive finishes have occurred in just 44% of those months. No other month on the calendar records a lower rate of positive outcomes.
| Dataset Period | Average Monthly Return | Positive Outcome Rate |
|---|---|---|
| Since 1980 (price returns) | -0.42% | 54% |
| Since 2001 (total returns) | -0.65% | 44% |
The win rate below 50% matters as much as the average return figure. It tells you that September is statistically more likely to be a losing month than a winning one. That is a different kind of information from knowing the average loss size: it means the base case, not the exception, is a negative outcome.
Published estimates of September’s average loss range from roughly -0.4% to -1.35%, depending on methodology, start dates, and whether the calculation uses price returns or total returns. The figures vary, but the direction never does. Every dataset places September at or near the bottom.
September sits within a broader May to October seasonal window for the ASX 200 that averages only 0.37% against 5.78% for the November to April period, a spread wide enough that the six-month framing carries more statistical weight than the individual month figure alone.
Recent Septembers reinforce the pattern
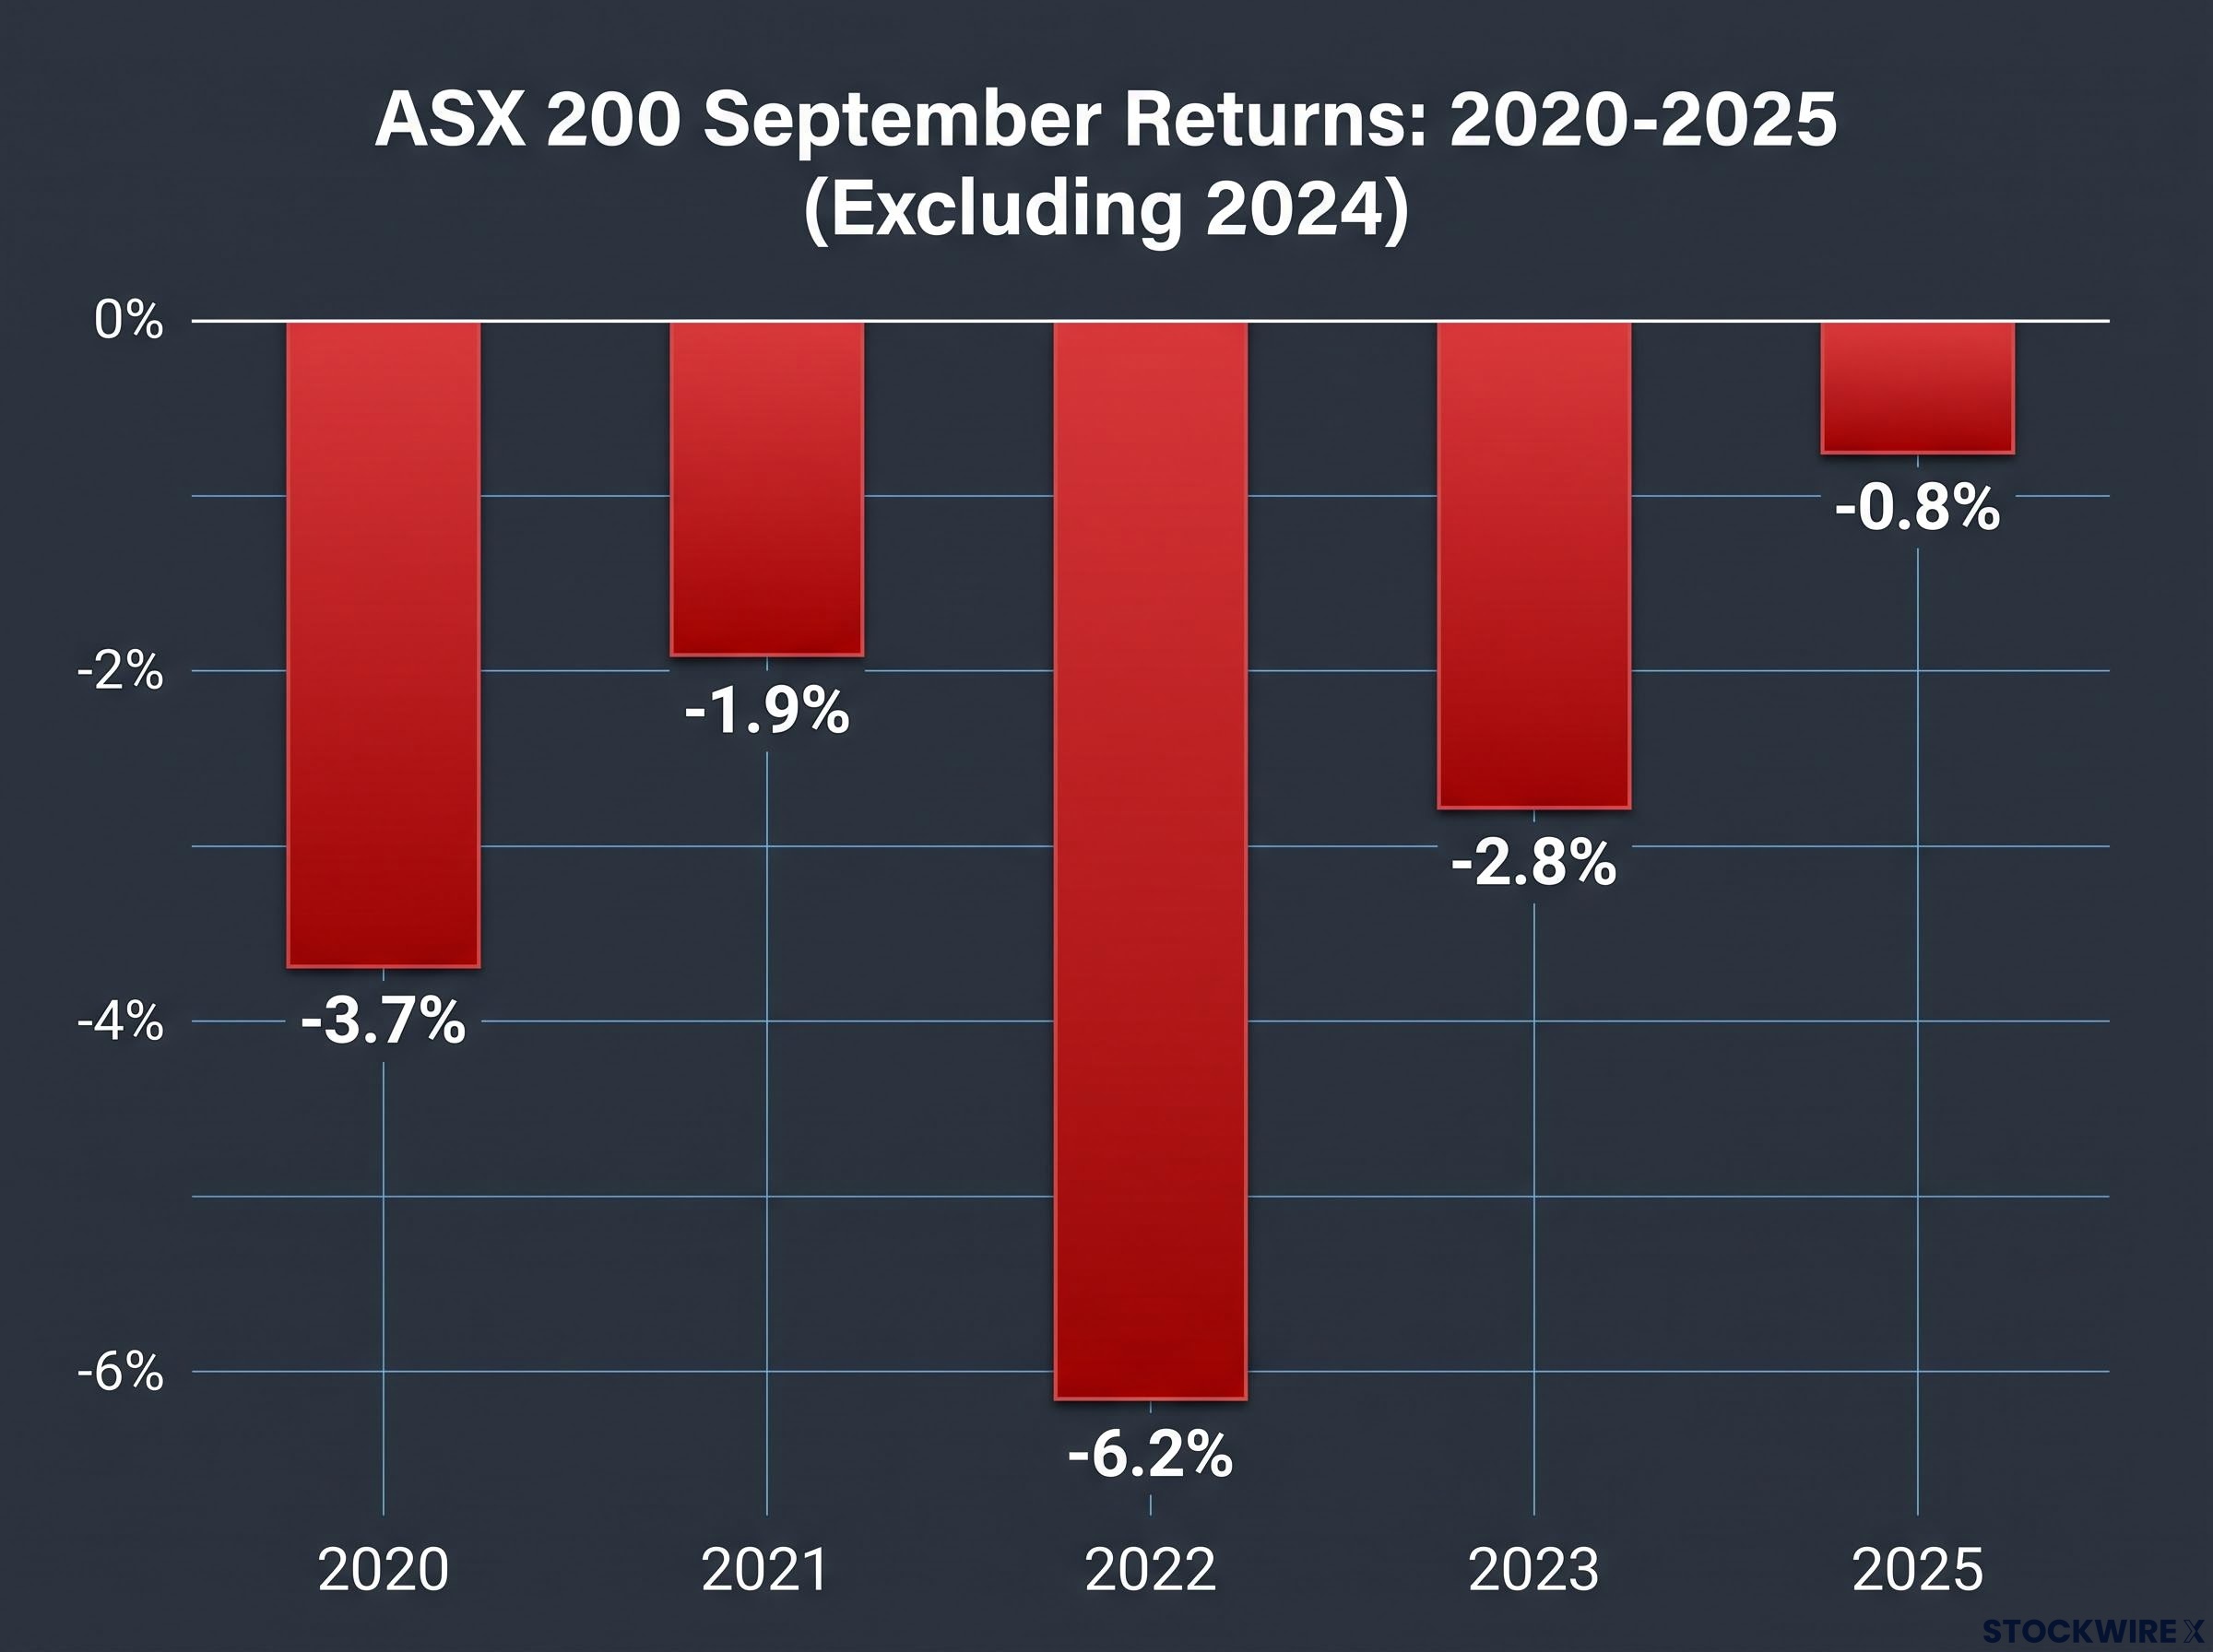
The last five completed September results for the ASX 200 tell a consistent story:
- 2020: -3.7%
- 2021: -1.9%
- 2022: -6.2%
- 2023: -2.8%
- 2025: -0.8%
Five negative outcomes in a row. The magnitude varied, but September delivered a loss every time. A drawdown this month is more likely to be the seasonal pattern expressing itself than a signal of something structurally wrong with your portfolio.
When big ASX news breaks, our subscribers know first
Why September keeps delivering this pattern
No single cause fully explains why September underperforms so consistently. What practitioners point to instead is a convergence of pressures that apply simultaneously, each one modest on its own but collectively enough to tilt the month negative more often than not.
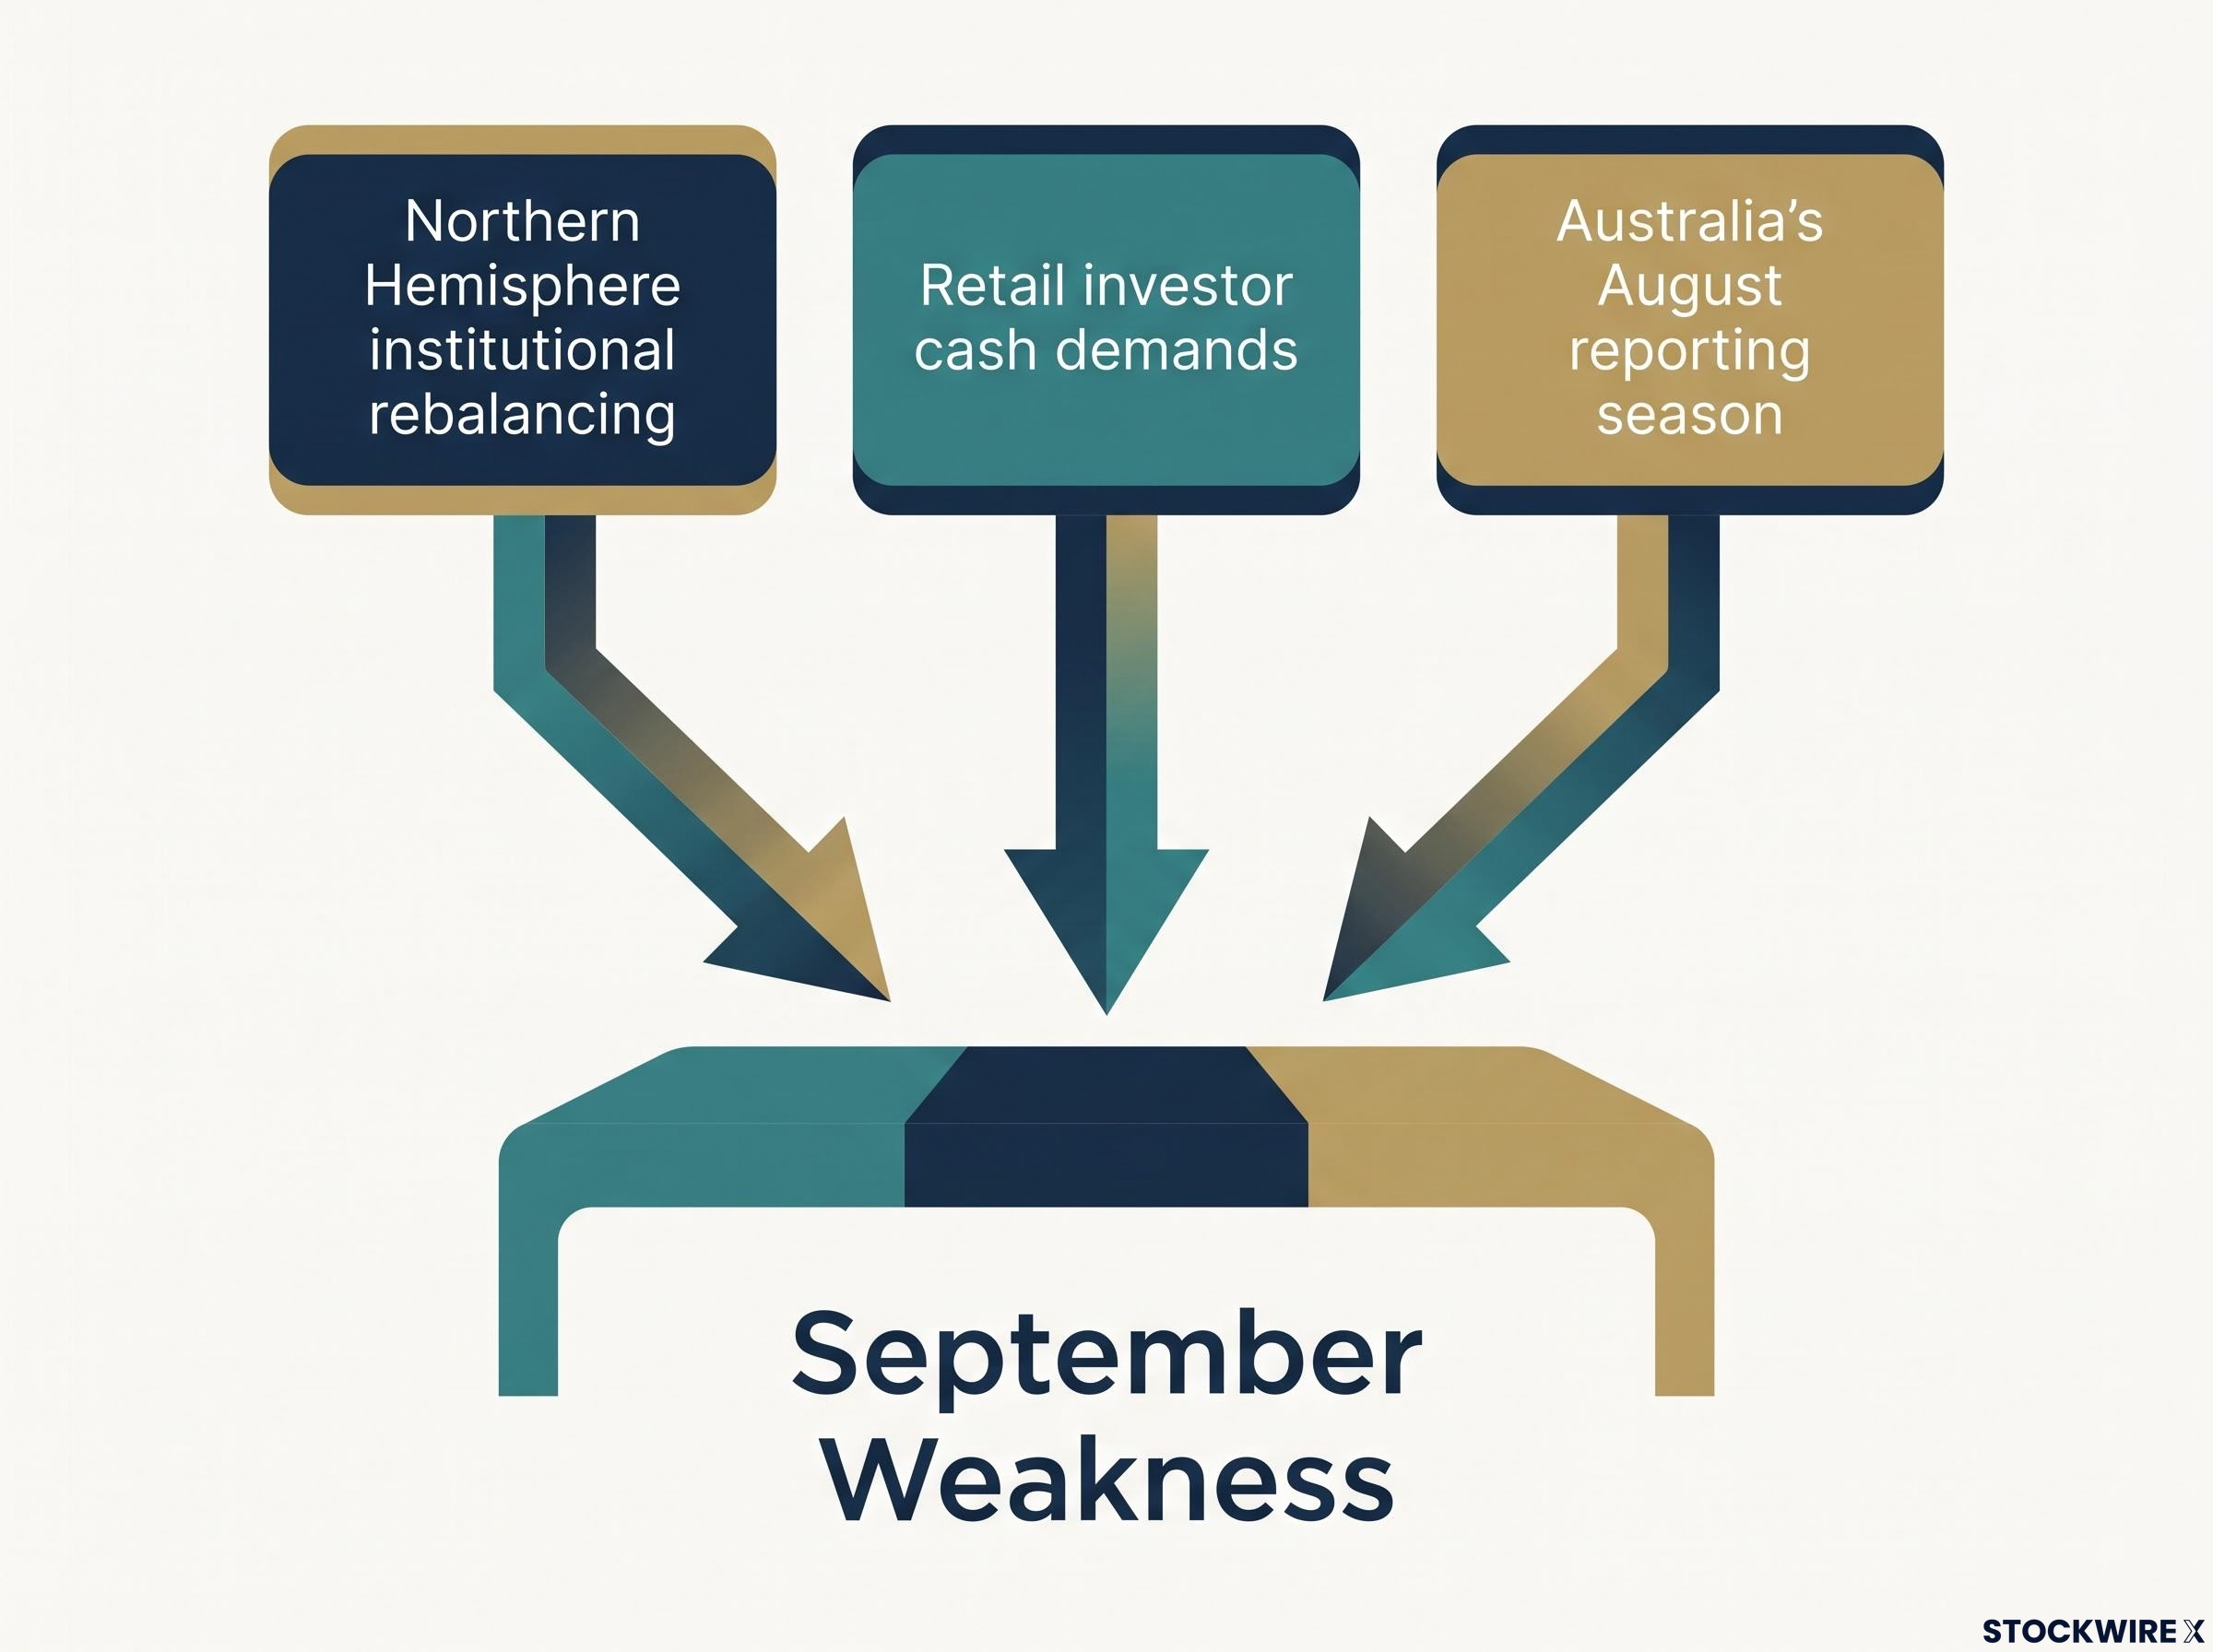
The three most commonly cited mechanisms are:
- Northern Hemisphere institutional rebalancing. US and European fund managers return from summer, rebalance portfolios, trim risk exposure, and realise losses ahead of year-end reporting. Those flows spill into globally linked markets, including Australia.
- Retail investor cash demands. Back-to-school spending and other household costs in the US and Europe reduce discretionary investment flows, dampening global risk appetite at the margins.
- Australia’s August reporting season. Earnings season in August can produce disappointment-driven selling that bleeds into September. If a company’s results missed expectations, the follow-through selling often does not finish within August itself. September absorbs the tail end of that repositioning.
The August reporting season feeds directly into September’s weakness: if earnings from index-heavyweight banks and miners miss expectations, the follow-through selling frequently does not resolve within August itself, and September absorbs the repositioning tail.
The same September weakness exists in the S&P 500, which supports the idea that Northern Hemisphere drivers carry real weight. This is not a pattern confined to the Australian market alone.
The absence of a single clean cause is actually useful information. It means the September pattern is unlikely to disappear because of any one regulatory change or market structure shift. That is why it has persisted across four decades of very different market environments, from the pre-internet era through to algorithmic trading. Empirical work characterises September as a “weak season” for equities rather than a structurally different market regime, and that framing helps you distinguish between seasonal weakness and genuine fundamental deterioration.
September’s worst moments: the events that shaped the month’s reputation
September’s statistical weakness is one thing. The month’s record of hosting acute market crises is another, and the two reinforce each other in a way that explains why experienced investors take the seasonal factor seriously.
Five episodes stand out across the last four decades:
| Year | Event | Key Market Impact |
|---|---|---|
| 1990 | Gulf War-era stress | Crude prices rose by more than **150%**; equities continued falling toward their October low |
| 2001 | September 11 attacks | Trading on the NYSE was halted for four sessions; the Dow shed **7.1%** when markets reopened |
| 2008 | Global Financial Crisis epicentre | The Dow lost **777 points** on **29 September**; ASIC introduced a short-selling ban on **21 September** |
| 2021 | Evergrande financial difficulties | Significant uncertainty across global equity markets |
| 2022 | US CPI-driven selloff | A US CPI release on **13 September** triggered a single-session loss of **4.3%** for the S&P 500 |
September 2008 remains the defining example. A major investment bank failure, sweeping regulatory intervention, and a 777-point single-day drop in the Dow all occurred within a single month. The compounding effect was severe: each shock arrived before markets had absorbed the previous one.
On 21 September 2008, ASIC introduced a short-selling ban described at the time as the most aggressive such restriction implemented anywhere globally.
That detail grounds a global crisis in local terms. Australian regulators treated the September 2008 environment as severe enough to warrant an intervention no other market had matched.
The clustering of these episodes is not merely historical colour. It reinforces that September is not just statistically weak on average but has also repeatedly been the setting for acute systemic shocks. That is a qualitatively different kind of risk to be aware of as you enter the month, because it means the tail outcomes, not just the average, skew negative.
What October has historically looked like after September weakness
The question most readers will have at this point is straightforward: does it get better?
The honest answer holds two truths simultaneously. Studies of ASX 200 seasonality find that the weakest stretch spans May/June and September/October, with the months that follow, November onward, tending to have better average outcomes. September often hosts or accelerates the drawdown. October frequently contains the bottoming process. But “bottoming process” is not the same thing as “immediate recovery.”
Three historical cycles illustrate the pattern:
- Early 1990s: recession-related selling extended into and climaxed in October before stabilisation took hold.
- 2001: post-September 11 weakness continued into October before at least a temporary recovery began.
- 2008: October followed September’s crisis epicentre with extreme volatility and ultimately preceded the eventual bottoming process, though the path was anything but smooth.
The important nuance is that October is not mechanically safe. Some of the worst single-day crashes in market history have occurred in October, and volatility can persist well before any durable recovery begins. The pattern is not “September bad, October good.” It is closer to “September accelerates the selling; October is where the selling exhausts itself, sometimes violently.”
Missing subsequent recoveries by exiting during seasonal weakness can be more damaging than enduring short-term seasonal declines.
For you, sitting in September 2026, the historical October pattern means that enduring the current month’s weakness without reactive selling has, on balance, been the approach that preserved access to subsequent recovery periods. But it requires tolerating continued volatility rather than expecting an immediate rebound.
Bear market recovery timelines vary far more than popular rules of thumb suggest: while financial-system shocks like 2008 have recovered within roughly five years, valuation-driven downturns like the dot-com bust took closer to seven, and the cause of the initial decline is a more reliable planning input than any single historical average.
Entering September 2026 with the pattern in view
Three findings hold up across the data. September is statistically the worst month for the ASX 200 by both average return and win rate. The pattern has a plausible explanatory basis rooted in institutional flows, retail cash pressures, and local reporting calendar dynamics, none of which are likely to disappear. And October has historically been where the exhaustion process plays out, though not without its own turbulence.
What the pattern does not justify is a mechanical exit. The 44% positive outcome rate since 2001 means more than half of Septembers are losing months, but a meaningful minority deliver gains. That split does not support a timing strategy. It supports an awareness strategy.
The practical value is behavioural. If the ASX 200 pulls back this month, you now know that a September drawdown is more likely to be the seasonal pattern expressing itself than evidence of a new structural bear market. That reframe has real value for decision-making, because the most common mistake during September is an overreaction to weakness that is seasonal rather than structural.
For investors wanting to move from awareness to preparation, our dedicated guide to portfolio resilience during seasonal weakness covers a four-question diagnostic framework and eight concrete actions, including liquidity buffer sizing and drawdown stress testing, for building structural resilience without relying on market timing.
This article is for informational purposes only and should not be considered financial advice. Investors should conduct their own research and consult with financial professionals before making investment decisions. Past performance does not guarantee future results. Seasonal patterns are statistical tendencies and do not guarantee outcomes in any individual year.
—