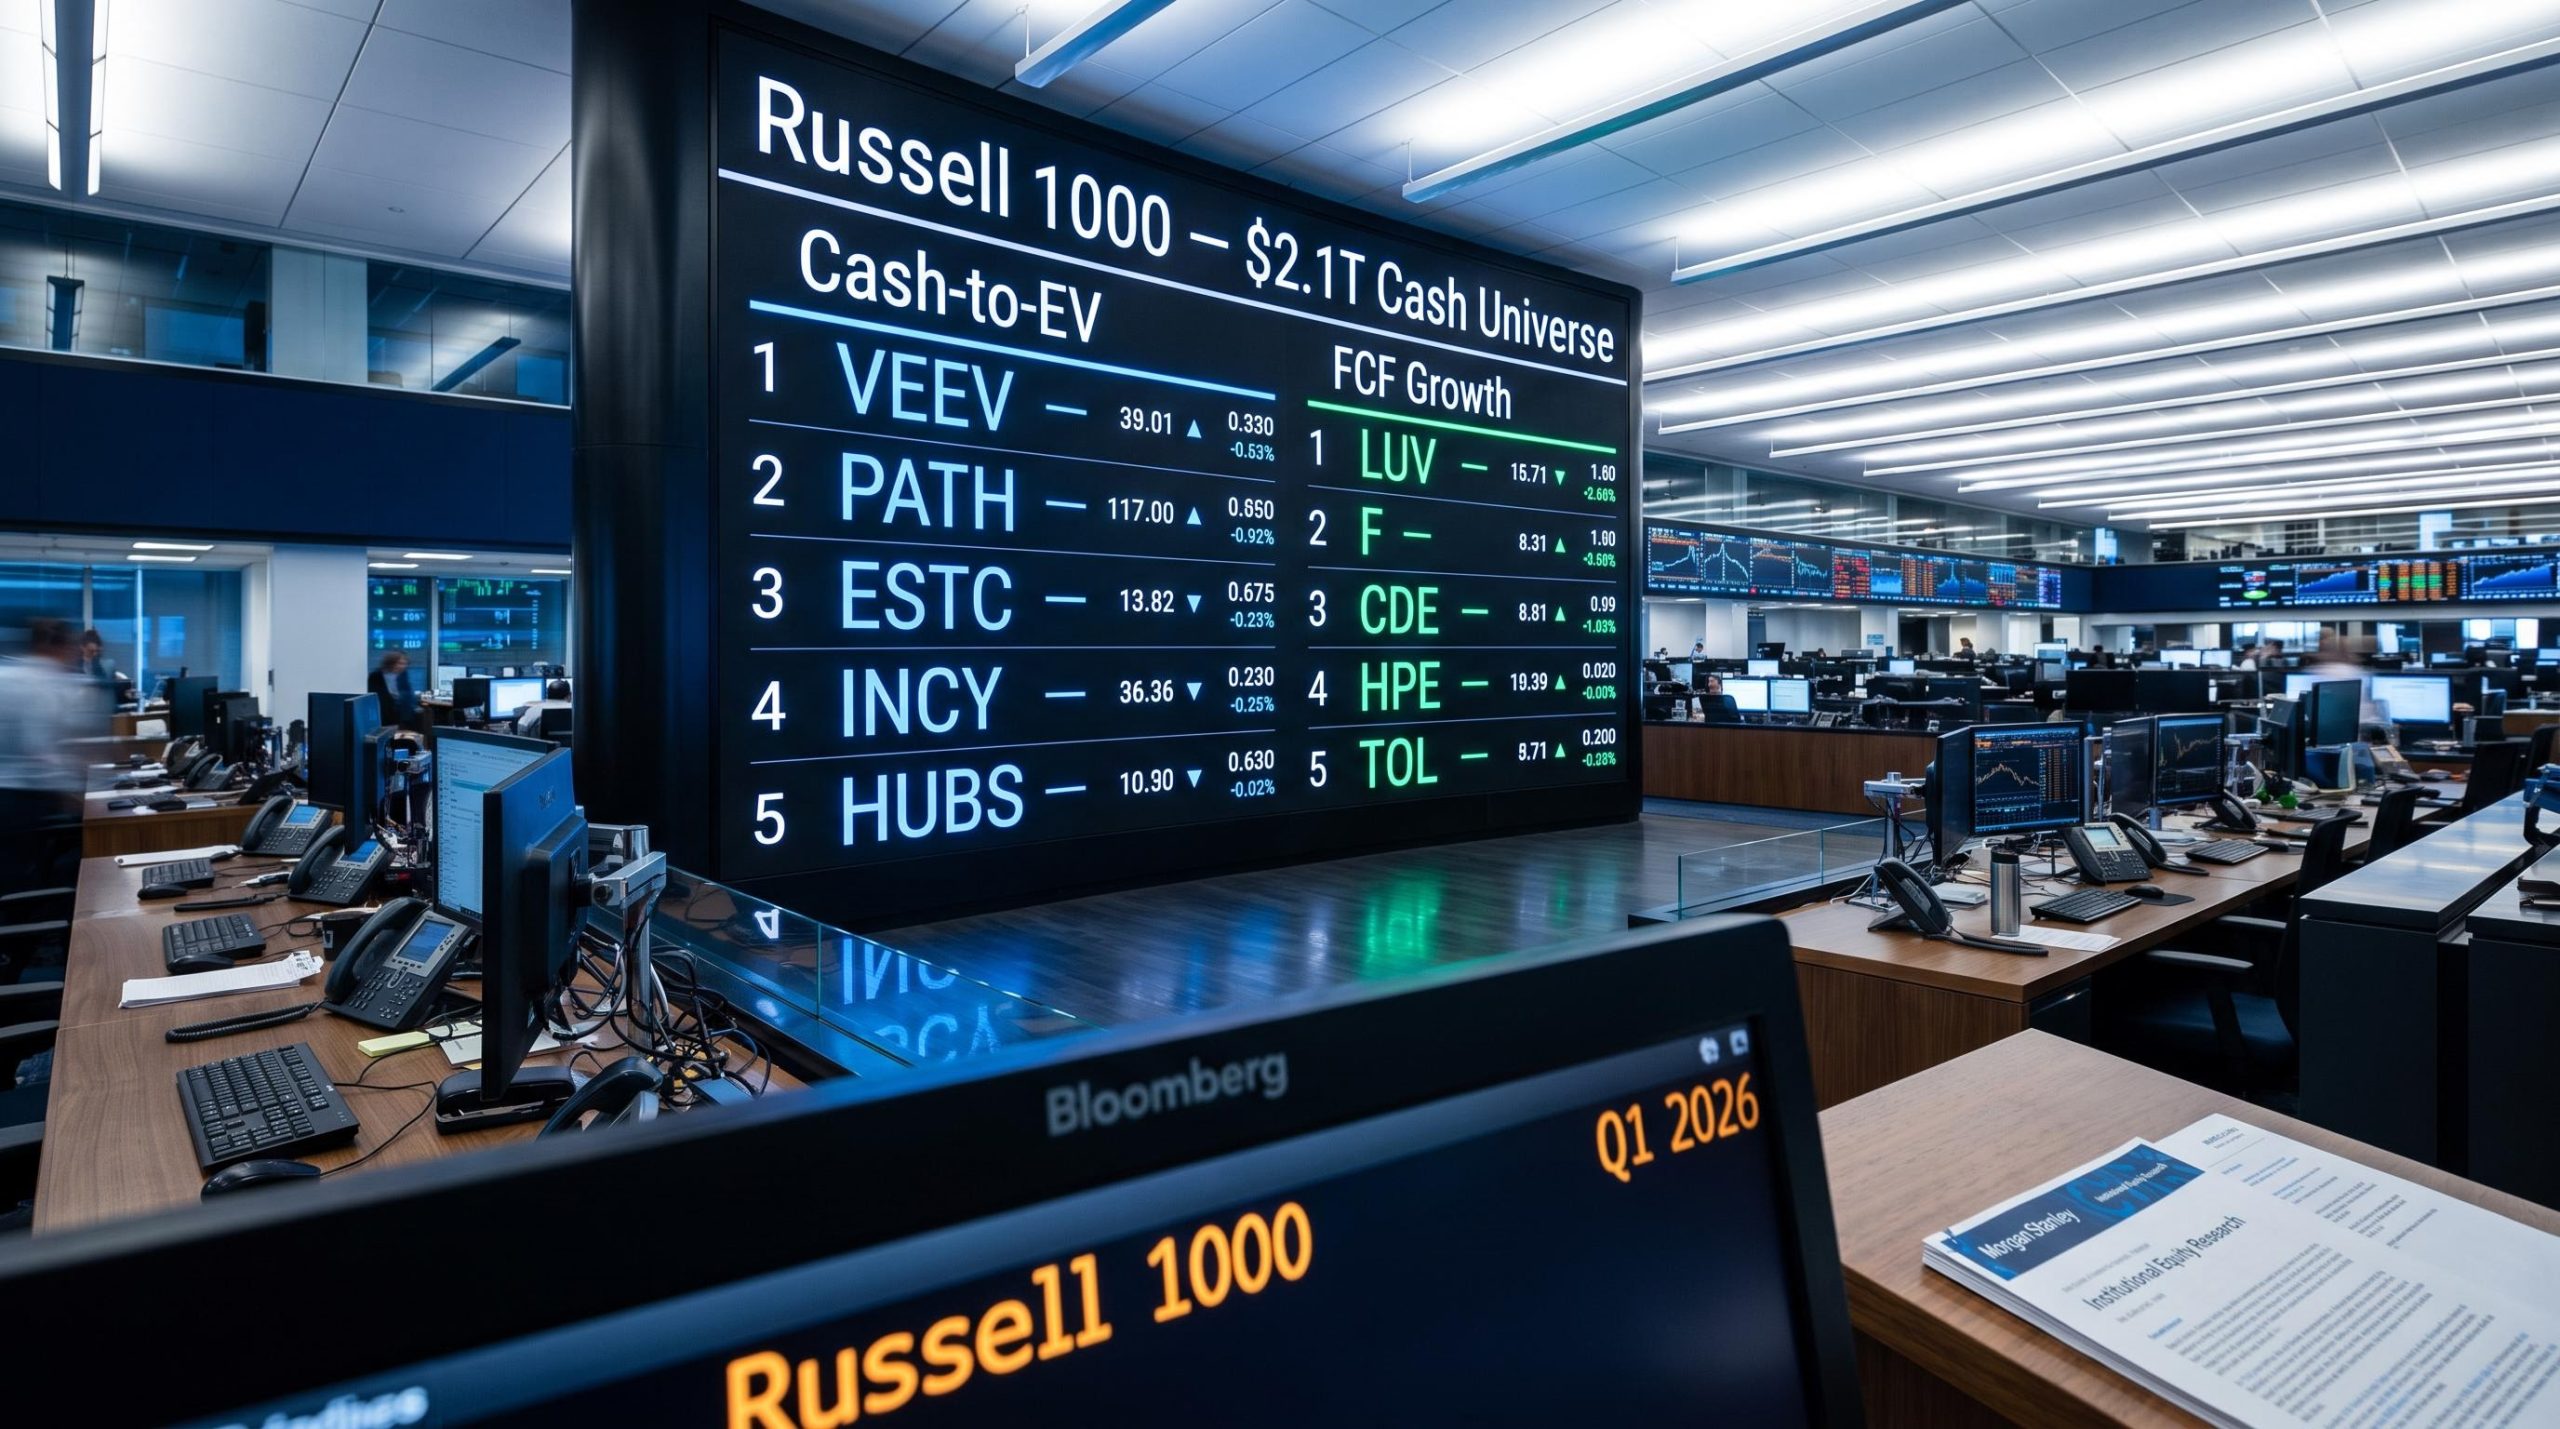
Morgan Stanley screened every Russell 1000 company through two cash-based lenses and published the results this week. The thesis is direct: when standard valuation metrics sit near multi-decade extremes, cash reserves and free cash flow become the more reliable signals for identifying which stocks can absorb a downturn and which are positioned to outperform on the other side.
The timing matters. Traditional price-to-earnings and price-to-book ratios are stretched across the index, making cheap and expensive harder to distinguish. The Russell 1000 collectively holds approximately $2.1 trillion in cash. Todd Castagno’s team at Morgan Stanley built two complementary screens from Q1 2026 balance sheet and free cash flow (FCF) projection data to cut through that noise: one targeting downside protection, the other targeting return potential.
Here are the specific names that cleared each screen, what the methodology tells you about how to read each list, and how investors can use both lists together within a single portfolio framework. Think of it as direct access to a Wall Street firm’s internal filter, applied to your own decision-making.
Why Morgan Stanley reached past P/E ratios to cash and free cash flow
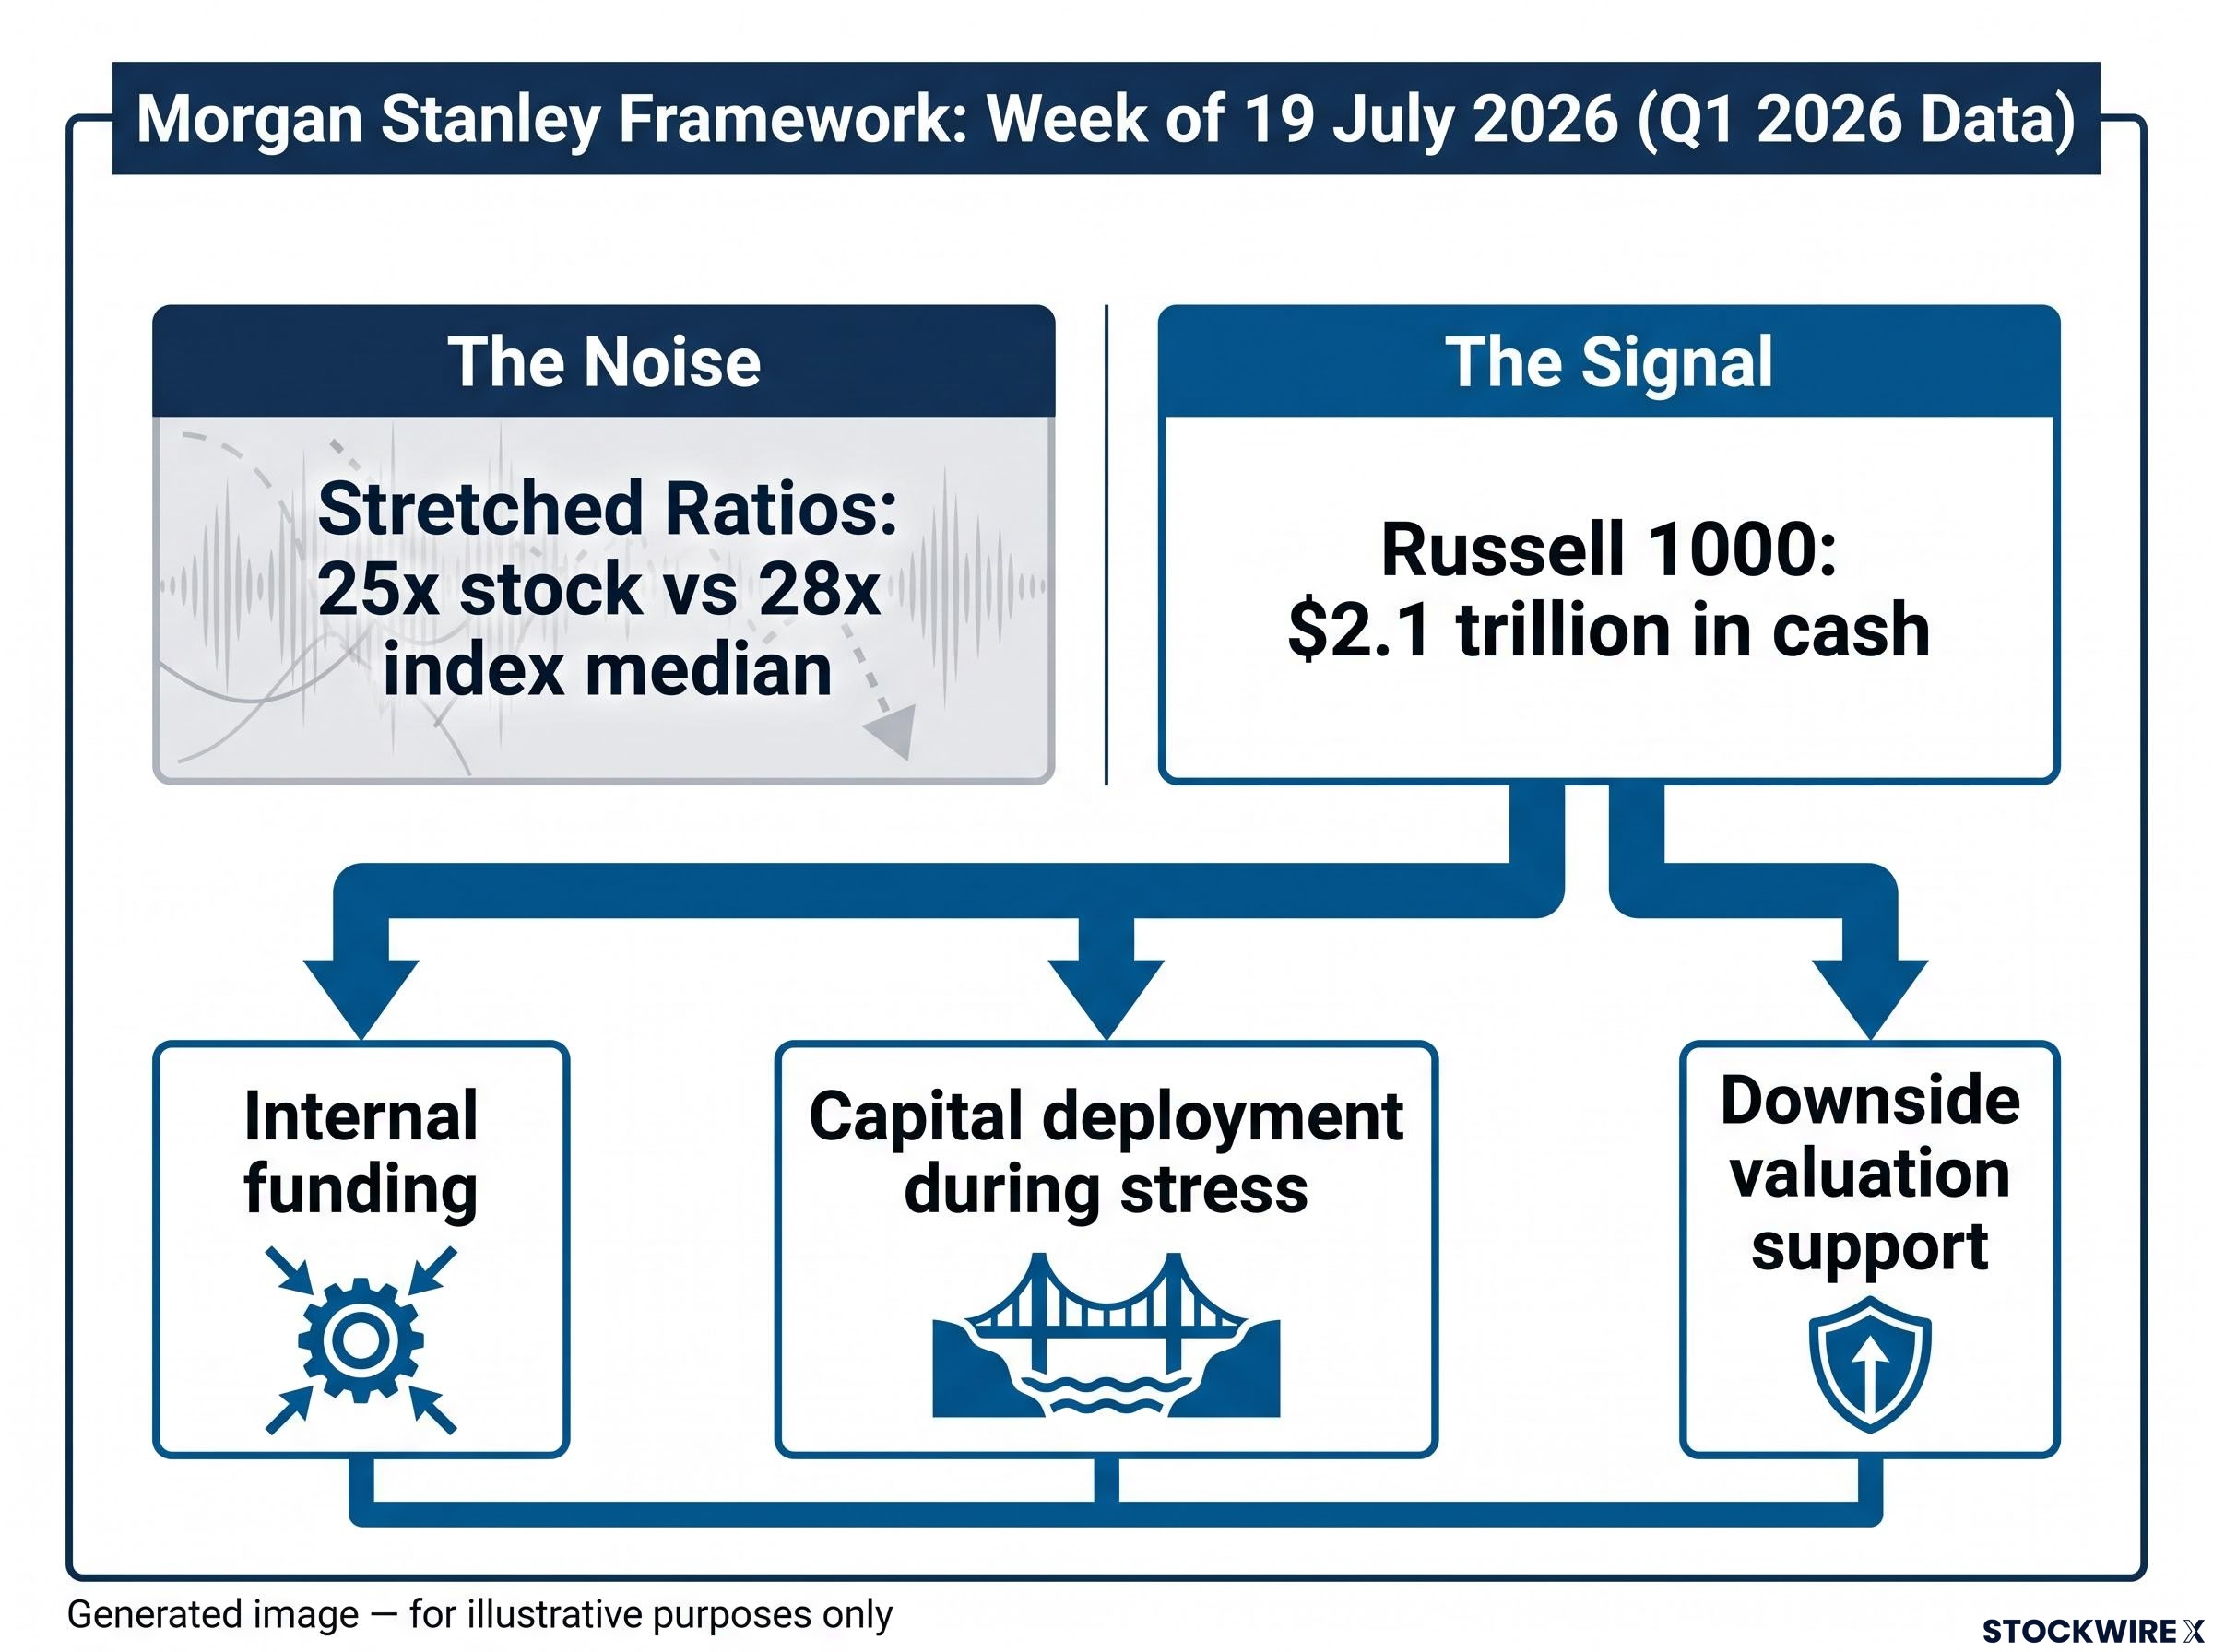
When price-to-earnings and price-to-book ratios are near multi-decade extremes across the Russell 1000, they lose their ability to separate genuine value from noise. A stock trading at 25x earnings looks expensive until you realise the index median is 28x. The signal degrades. That is the environment Morgan Stanley’s team identified when it published this framework during the week of 19 July 2026, drawing on Q1 2026 data.
The alternative: look at what companies actually hold and generate. Cash on the balance sheet and growing free cash flow, which is the cash a company produces after covering its operating and capital expenses, provide three specific forms of resilience that leveraged or cash-poor peers lack:
Free cash flow screening systematically favours asset-light businesses because operating cash generation is highest where capital reinvestment demands are lowest, which explains the concentration of software and payments names that tend to dominate any FCF-ranked universe.
- Internal funding: Companies with strong cash can fund operations, R&D, and growth without relying on banks or capital markets, which become expensive or inaccessible during downturns.
- Capital deployment during stress: Cash-rich firms can repurchase shares, pursue acquisitions, or invest aggressively when asset prices are depressed and competitors are retrenching.
- Downside valuation support: A high cash-to-enterprise-value ratio means part of the company’s total value is already backed by cash on hand, creating a partial floor under the stock price.
The fact that a firm of Morgan Stanley’s scale is building its stock screens around cash metrics rather than conventional valuation ratios tells you something about how professionals are reading this specific market. That methodological shift is itself a signal worth paying attention to.
When big ASX news breaks, our subscribers know first
Screen 1: balance sheet leaders ranked by cash coverage of enterprise value
Working from Q1 2026 data, this screen isolates Russell 1000 companies that carry healthy balance sheets, maintain adequate liquidity, and produce returns exceeding their cost of capital, ordering the results by each company’s cash-to-enterprise-value ratio. Here are the five highest-ranked names:
- Veeva Systems (VEEV): Cloud software for the life sciences industry. Ranked first with an exceptionally high cash-to-enterprise-value ratio and no debt noted in separate coverage. This is the framework’s flagship balance sheet name.
- UiPath (PATH): Robotic process automation software. Building sizable cash reserves as the business scales, with what Morgan Stanley characterised as a “fortress” balance sheet.
- Elastic (ESTC): Search and observability software. Growth-oriented but maintains a meaningful cash cushion that ranks highly against the broader Russell 1000 universe.
- Incyte (INCY): Biopharma. Strong cash levels consistent with companies that need to fund deep clinical pipelines without external financing pressure.
- HubSpot (HUBS): Marketing and CRM platform. Has scaled toward profitability while preserving cash-rich flexibility for future capital allocation decisions.
Large-cap callouts: For investors who prefer to stay above $50 billion in market capitalisation, Airbnb (ABNB) and Nike (NKE) were separately flagged for cash positions elevated relative to peers at their scale.
The concentration of software and biopharma names in this list is not a coincidence. Asset-light business models and IP-driven revenue generate cash without the heavy reinvestment demands of industrials or manufacturing. If your portfolio is already overweight in those sectors, this screen reinforces existing exposure. If it is underweight, it gives you a pre-filtered starting point for balance sheet quality names you may not have considered.
The FCF payout ratio is the primary dividend sustainability signal in systematic stock screening because it reflects actual cash available to return to shareholders after capital expenditure, a measure that cash-rich names like Veeva and HubSpot satisfy comfortably even when earnings-based ratios appear stretched.
Screen 2: five Russell 1000 stocks positioned for material free cash flow expansion
The second screen shifts the lens from what companies hold today to what they are expected to generate. Morgan Stanley selected Russell 1000 companies with the strongest projected FCF growth across deliberately diverse industries. Where the first list is a snapshot of current strength, this list is a forward-looking thesis on cash generation the market may not have fully priced in.
- Southwest Airlines (LUV): Ranked first. An operational and financial turnaround story where FCF improvement is characterised as potentially underappreciated by the market. This is the flagship name for the forward FCF screen.
- Ford Motor Company (F): Restructuring and cost discipline drive the FCF trajectory, with management balancing the electric vehicle transition against its profitable core truck and commercial vehicle business.
- Coeur Mining (CDE): Silver and gold miner. FCF growth is tied to operational improvements and a favourable precious metals pricing backdrop.
- Hewlett Packard Enterprise (HPE): Enterprise infrastructure and hybrid cloud focus. Cost discipline and strategic positioning in hybrid cloud deployments are expected to drive FCF expansion.
- Toll Brothers (TOL): Luxury homebuilder. Structural housing undersupply and luxury market positioning support projected cash generation despite elevated mortgage rates.
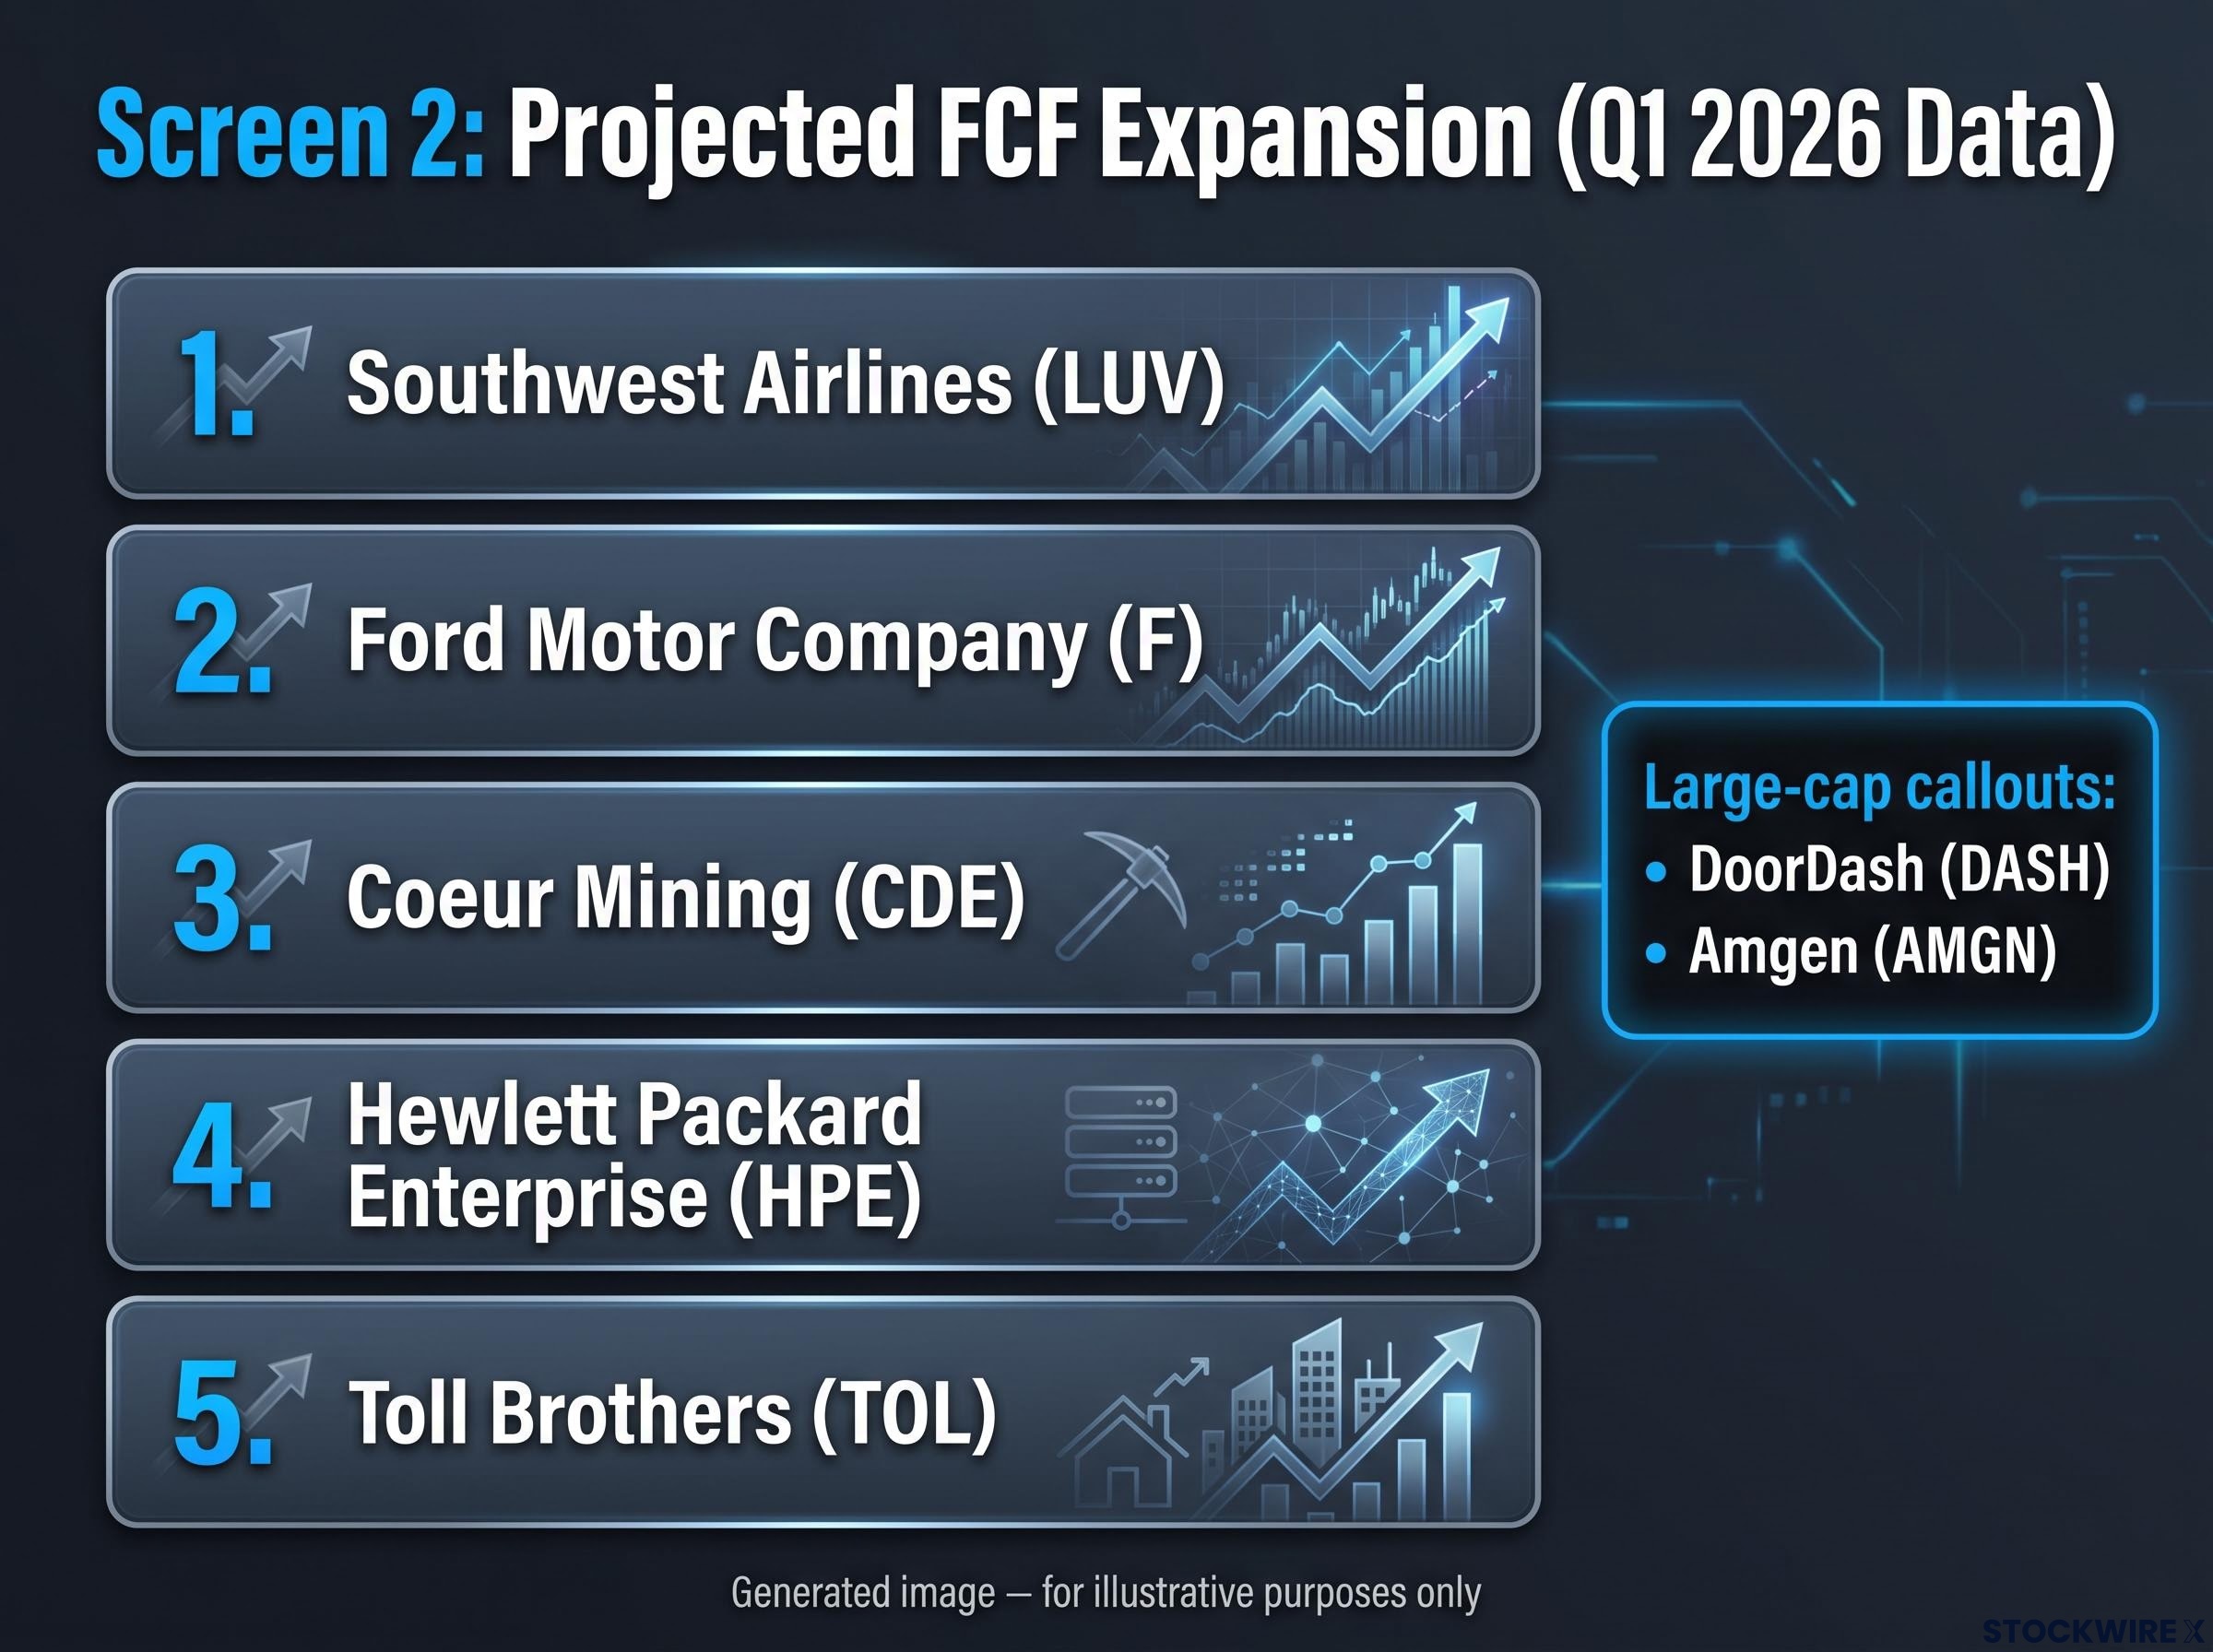
Large-cap callouts: DoorDash (DASH) on improving unit economics and geographic expansion, and Amgen (AMGN) on a commercially productive mature biopharma portfolio generating strong forward FCF.
The breadth of sectors here, airlines, automotive, mining, enterprise tech, and homebuilding, signals that Morgan Stanley’s projected FCF inflection is not a single-sector thesis. It is a cross-market view. That means you can layer this screen over your existing sector allocations rather than making a concentrated bet.
| Screen | Rank 1 | Rank 2 | Rank 3 | Rank 4 | Rank 5 |
|---|---|---|---|---|---|
| Cash-to-EV (balance sheet strength) | VEEV | PATH | ESTC | INCY | HUBS |
| FCF growth (return potential) | LUV | F | CDE | HPE | TOL |
How to use both lists inside one portfolio
The two screens serve different portfolio functions, and understanding that distinction is what makes them useful together rather than redundant.
| Characteristic | Screen 1: Cash-to-EV | Screen 2: FCF growth |
|---|---|---|
| Portfolio role | Defensive ballast | Offensive return driver |
| Primary mechanism | Balance-sheet floor supports valuation | FCF inflection precedes multiple re-rating |
| Best scenario | Sharp drawdown or extended volatility | Continued grind higher or recovery |
| Top names | VEEV, PATH, ESTC, INCY, HUBS | LUV, F, CDE, HPE, TOL |
| Large-cap anchors | ABNB, NKE | DASH, AMGN |
Holding a cash-rich name alongside a high-FCF-growth name is not doubling exposure to the same thesis. You are hedging against two different market scenarios: a sharp drawdown where balance sheet strength protects capital, and a continued advance where FCF inflection drives re-rating and capital returns. Both screens rely on fundamental cash-based metrics rather than momentum or simple cheap-versus-expensive labels, which makes the combined signal more durable in a noisy market.
Portfolio risk management frameworks like beta-weighted position sizing reveal why combining Screen 1 and Screen 2 names serves a genuine hedging function: cash-rich software names typically carry lower beta than cyclical FCF-growth names, so the two lists produce risk-return profiles that partially offset rather than compound each other.
Neither list is a buy list on its own. Both require individual company due diligence before any investment decision. The framework’s value is in narrowing the universe, not replacing analysis.
What these screens do not tell you (and why that matters)
Cash strength and FCF growth improve the probability of navigating adversity. They do not eliminate it. Before treating either list as a starting point, consider these limitations:
- Sector-specific risk persists. The screens span cloud software, biopharma, airlines, automotive, mining, and homebuilding. Each carries fundamentally different cyclical, regulatory, and competitive risk that no cash metric can neutralise.
- Projections carry uncertainty. Both screens draw on Q1 2026 balance sheet and FCF projection data. Projections can shift materially with a single quarterly filing, management change, or macro shock.
- Time horizons differ by screen. FCF growth themes typically take years to play out fully. Balance sheet strength is most directly valuable during short, sharp drawdowns. Your planned holding period should shape which screen is more relevant to your portfolio.
- Valuation context may normalise. This framework was built for an environment where traditional valuation metrics are stretched. If that environment changes and P/E ratios compress back toward historical averages, the relative advantage of cash-based screening could diminish.
- These are starting points, not buy signals. Individual evaluation of valuation, competitive dynamics, and management quality is required before any investment decision.
Understanding what a screen cannot do is as important as understanding what it can. A reader who knows the limitations is more likely to use the framework productively than one who treats the list as pre-approved.
This article is for informational purposes only and should not be considered financial advice. Investors should conduct their own research and consult with financial professionals before making investment decisions.
Where these names stand heading into the second half of 2026
Morgan Stanley published these screens during the week of 19 July 2026, drawing on Q1 2026 data and Todd Castagno’s team analytical framework. The market environment that prompted the work, elevated valuations where cash-generating fundamentals matter more than multiple-based bets, has not changed.
The enduring value here is not the specific names today but the methodology: a repeatable, fundamental lens you can reapply as new quarterly filings arrive. Monitor Q2 2026 results for whether cash and FCF trajectories hold at the companies listed. If a balance sheet deteriorates or an FCF inflection stalls, the screen has already told you to reassess.
For investors who want immediate exposure to both themes without moving down market-cap tiers, the large-cap callouts from each screen (Airbnb and Nike for balance sheet strength; DoorDash and Amgen for FCF growth) offer accessible entry points.
For investors weighing whether now is the right moment to deploy capital into either screen, our dedicated guide to investing during a market pullback walks through the personal audit of income stability, portfolio concentration, and time horizon that should precede any entry decision regardless of how compelling the fundamental case appears.
The decision that matters now: which of these two screens is more relevant depends on your specific risk tolerance and time horizon. Naming that choice, defensive ballast or offensive return driver, is the first step toward using the framework rather than just reading about it.
Past performance does not guarantee future results. Financial projections are subject to market conditions and various risk factors.
—