Most people watch their 401(k) with one eye on a round number. But the most meaningful mechanical shift in how your account grows has already happened for millions of savers, usually somewhere around a $350,000 balance, with no fanfare and no notification.
The 401(k) crossover point is the specific year when the investment returns your account generates internally exceed the contributions you and your employer make externally. It is not a milestone in the psychological sense. It is a turning point in the literal, mechanical sense: the engine of growth changes.
What follows here is a precise framework for finding your own crossover threshold, understanding why it depends on a ratio rather than a dollar figure, and knowing what this shift actually signals about your retirement path. Consider it a tool you can apply to your own numbers today, not a summary you skim once and forget.
What the 401(k) crossover point actually is (and what triggers it)
Imagine you open your year-end statement and notice something new. The growth line, the part driven by market returns, has quietly outrun the contribution line, the part driven by your paycheck deductions and your employer’s match. For the first time, your money earned more than you and your employer put in.
That is the crossover point. It is the specific year when internally generated investment returns exceed your total annual external contributions, employee and employer combined.
To understand why it happens, you need to see the two forces driving every 401(k) balance:
- External contributions. Your paycheck deferrals plus employer matching. In the early years, these dominate almost entirely because your balance is too small to produce meaningful returns in absolute dollars.
- Internal returns. The compounding your invested balance generates on its own. As the balance scales, these grow in absolute terms until they overtake everything you contribute in a year.
Here is the part worth holding onto: the crossover is an event, not a permanent state. It marks the single year your balance-to-contribution ratio crosses a threshold. It does not lock in a condition that stays true forever, and a large enough contribution jump or withdrawal could pull you back below it.
The threshold itself comes from a short piece of arithmetic.
The crossover formula Crossover balance threshold = Annual Contribution divided by Assumed Return Rate
Run the numbers. If you contribute the 2026 IRS employee elective deferral limit of $24,500 (set in IRS Notice 2025-67) and assume a 7% real return, your crossover threshold is $24,500 / 0.07 = $350,000. Once your balance passes that mark, a 7% return produces more than $24,500 in a year, which is more than you contributed.
That is the reframe worth sitting with. Your personal crossover threshold is something you can calculate in about thirty seconds using two numbers you already know: your annual contribution and your expected return. It stops being an abstract concept and becomes a concrete tracking point.
Portfolio crossover mechanics play out differently depending on the contribution amount and investment vehicle, and modelling $500 monthly contributions into an S&P 500 index fund shows the structural tipping point arriving at year 17, when annual market gains permanently exceed the annual contribution figure.
The threshold moves with your inputs. Here is how it shifts across three common contribution levels and two return assumptions.
| Contribution Level | Annual Amount | Crossover at 7% | Crossover at 5% |
|---|---|---|---|
| Average saver | $12,100 | $172,857 | $242,000 |
| Employee maximum (2026) | $24,500 | $350,000 | $490,000 |
| Combined legal ceiling | $72,000 | $1,028,571 | $1,440,000 |
Notice the bottom row. The combined employee-plus-employer legal ceiling of $72,000 produces a crossover threshold above $1,028,571. That is the only scenario where crossing over requires more than a million dollars, which means for almost everyone else, the mechanical shift arrives long before the psychological one.
When big ASX news breaks, our subscribers know first
Why contribution size does not move the crossover date (but does move the stakes)
Here is a finding that runs against instinct. Saving more does not get you to the crossover any faster.
Work through the logic and it explains itself:
- Contributions rise. You increase how much you defer each year, so your balance climbs more quickly.
- The crossover threshold rises too. Because the threshold is Annual Contribution divided by return, a larger contribution raises the target proportionally.
- The timeline stays fixed. Both sides scale together, so the number of years to reach the crossover from a zero starting balance does not change.
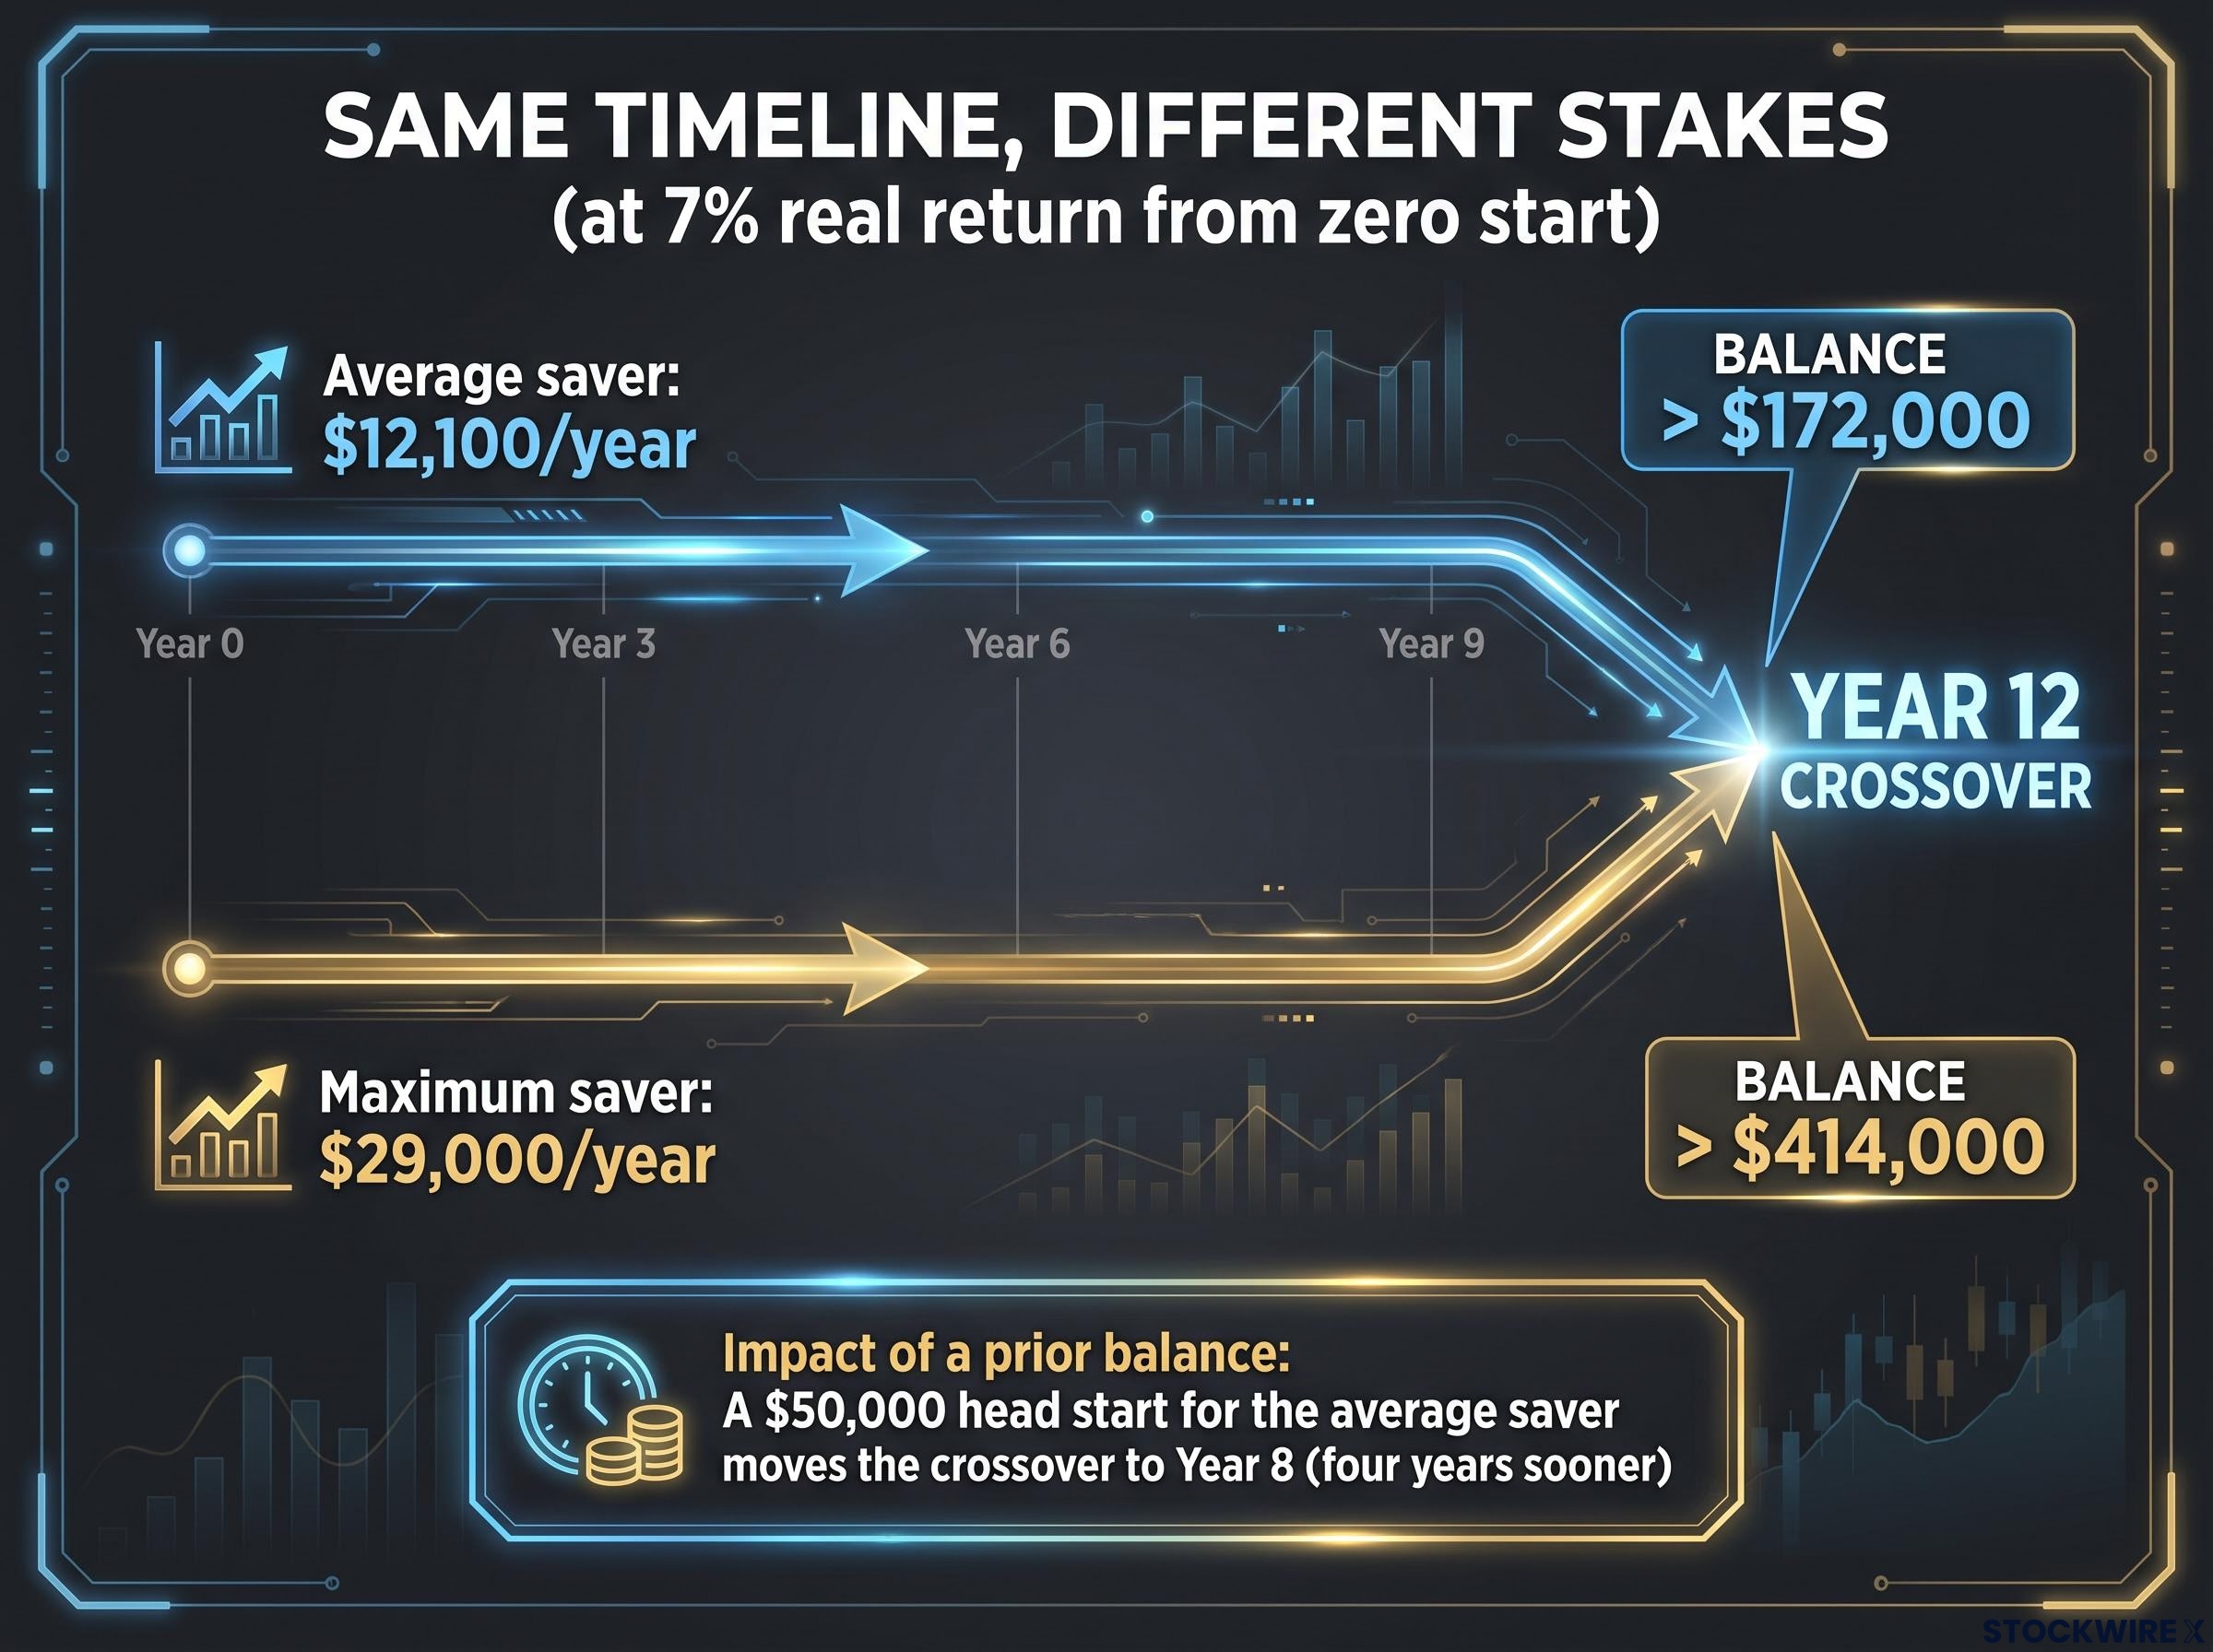
The math bears this out. An average saver contributing $12,100 a year reaches the crossover in Year 12 at a 7% real return. A maximum-level saver contributing $29,000 a year also reaches it in Year 12. Same timeline, different scale.
Consistency matters more than contribution size for protecting the compounding timeline: a five-year delay on even modest monthly contributions costs roughly $20,400 in final portfolio value, a gap that cannot be closed by contributing more later because the early years are gone.
And the scale is where saving more actually matters. At that Year 12 crossover, the average saver holds a balance above $172,000, while the maximum saver holds a balance above $414,000. Contribution size does not buy you speed. It buys you a bigger balance at the moment compounding takes the wheel, and therefore a larger base for every market gain that follows.
For context on where most people sit, Vanguard’s How America Saves 2025 report found an average total contribution rate (employee plus employer) of 12.0% of pay, with a median of 11.5%, and an average employee deferral rate of 7.7%. Only 14% of participants contribute at the employee elective maximum, and those who do skew older and higher-income.
How a prior balance shifts the timeline
If contribution size is the lever that does not move the date, a prior balance is the lever that does.
An average saver starting from zero reaches the crossover in Year 12. Give that same saver a $50,000 head start and the crossover arrives in Year 8, four years sooner.
The mechanism is straightforward. A prior balance does not change the threshold; it shrinks the distance between where you are now and where the threshold sits. You start closer to the finish line without moving the finish line.
That reframes a decision many savers underrate. Cashing out a 401(k) at a job change, or taking an early withdrawal, does not just cost you the withdrawn amount. It pulls your balance back down the curve and pushes your crossover further out. The most powerful thing you control here is not fine-tuning your contribution rate. It is staying invested and leaving the balance intact.
Early withdrawal costs extend well beyond the withdrawn amount: removing the compounding base permanently lowers every subsequent gain with no recovery path, and an investor who exits at year 12 forfeits the bulk of the account’s lifetime returns before they have accrued.
Return assumptions, fees, and the limits of the 7% model
Every crossover threshold you calculate rests on one assumption: your return rate. Change that input even slightly and the threshold moves meaningfully, which is why the assumption deserves more scrutiny than most savers give it.
Three inputs move the threshold, and it helps to know which direction each one pushes:
- Return rate. A higher assumed return lowers the threshold and brings the crossover earlier. A lower return raises it and pushes the crossover later.
- Contribution amount. A higher contribution raises the threshold proportionally, as covered above.
- Starting balance. A prior balance does not change the threshold but shortens the time to reach it.
The first input is where people quietly overstate their prospects. Many DIY savers calculate real returns, the returns after inflation, by simple subtraction. That shortcut inflates the number.
Real returns: the shortcut versus the correct method Common shortcut: 7% nominal minus 2% inflation = 5% real (overstated) Fisher formula: (1 + 0.07) divided by (1 + 0.02), minus 1 = approximately 4.9% real
The gap looks small, but over decades of compounding it is not trivial, and it always runs in the optimistic direction.
Fees compound the problem. They act as a direct drag on your effective return, which means they lower the return input to the crossover formula and push your crossover later than a fee-free model suggests. Any zero-fee assumption is a fiction.
There is a historical anchor worth knowing. According to Aswath Damodaran’s dataset at NYU Stern (updated August 2026), the S&P 500 delivered an annualised real total return of roughly 6.9% between 1928 and 2025. But returns are not linear: the index has posted an annual loss in roughly one of every four calendar years.
The practical upshot is direct. If you use a flat 7% assumption in a fee-bearing account holding a balanced portfolio rather than all equities, your real crossover will likely arrive somewhat later than your model implies. Commentary from the Pension Policy Center to the SEC has flagged exactly this: 7% or higher assumptions for balanced portfolios tend to ignore fees, risk, and real-world investor behaviour.
Why Monte Carlo modelling matters for crossover projections
A flat-rate model assumes the same return every year. Markets never cooperate that neatly.
Monte Carlo simulation is the alternative. Instead of one fixed rate, it runs hundreds or thousands of possible return sequences drawn from plausible market outcomes, then reports how often your plan succeeds.
That exposes a risk fixed-rate models hide entirely: sequence-of-returns risk, the danger that comes from the order in which returns arrive. A bad market stretch early in your saving years can delay or undermine your crossover trajectory even if your long-run average looks fine. You do not need to run a simulation yourself to benefit from the idea. You just need to know that a single optimistic number cannot capture it.
Sequence-of-returns risk is the mechanism behind this failure mode: two portfolios with identical long-run average returns can produce outcomes separated by nearly $10 million over 30 years depending solely on the order in which annual gains and losses arrive, a variance no flat-rate model captures.
What the crossover does not tell you (and the frameworks that fill the gap)
Here is the trap. The crossover confirms that your returns beat your contributions in a given year. It says nothing about whether your account is on track to actually fund your retirement.
Those are two different questions, and conflating them is the most consequential mistake you can make with this concept. The framework that answers the second question is Coast FIRE.
Coast FIRE is the balance at which your current portfolio, assuming zero future contributions, is projected to compound into a fully sufficient retirement nest egg by your target age. It has its own formula.
Coast FIRE threshold FI Target divided by (1 + expected real return) raised to the power of years until retirement
The distinction between the two frameworks is worth seeing side by side.
| Framework | What It Measures | What It Does Not Tell You |
|---|---|---|
| 401(k) Crossover Point | The year internal returns exceed annual contributions | Whether the balance is on track to fund retirement |
| Coast FIRE | Whether the current balance can compound to a full nest egg with no further saving | Whether you can sustain spending through market downturns in retirement |
| Fidelity Income Multiples | Whether your balance is age-appropriate relative to income | Whether your specific retirement target is fully funded |
The behavioural risk is real. If you read a growth crossover as permission to cut contributions or loosen spending discipline, you expose yourself to sequence-of-returns risk and may fall short of your Coast FIRE number even after your account has crossed over. A crossover can happen at a balance far below what you need to eventually reach 25 times your projected expenses. For context, typical Coast FIRE thresholds for workers under 40 sit between $150,000 and $350,000. Coast FIRE literature recommends continuing to contribute until your portfolio sits 10-20% above the calculated number, as a buffer against a bad early market.
The reader takeaway is clean. The crossover tells you the engine has shifted. It does not tell you whether the destination is reachable on your current fuel load. Only a separate Coast FIRE calculation answers that.
Alternative frameworks for tracking compounding progress
If a single dollar target feels arbitrary, a few complementary frameworks give you handles that work better:
- Fidelity age-based income multiples. Aim for 1x your income by 30, 3x by 40, 6x by 50, 8x by 60, and 10x by 67. Because it scales to income, it works across earning levels and avoids fixation on absolute balances.
- Savings-rate to years-of-FI. Saving 50% of income reduces the financial independence horizon to roughly 17 years. This shifts your focus to a lever you actually control: the ratio of saving to spending.
- The Rule of 72. Divide 72 by your expected return to approximate doubling time (a 6% return doubles in about 12 years). Useful as motivation, but it ignores volatility, fees, and sequence-of-returns risk.
There is behavioural evidence that staying the course pays. In Q1 2026, nearly 18% of participants increased their savings rate during market volatility while only about 5.7% changed their asset allocation. Fidelity’s Q3 2025 data found women continuously in a plan for 15 years held an average balance above $501,100, attributed largely to staying invested rather than reacting to short-term moves.
Knowing where you stand on the crossover curve
You now have the pieces to locate yourself on the curve. It comes down to three inputs and a short sequence.
- Calculate your threshold. Add your total annual contributions (employee plus employer), pick an honest return assumption adjusted for fees using the Fisher formula, and divide contribution by return. That is your crossover balance.
- Compare it to your current balance. If your balance sits above the threshold, you have crossed over. If it sits below, use the Year 12 baseline for a zero-start saver at 7% as a rough positioning guide.
- Run the Coast FIRE check. Once you know where you sit on the crossover, calculate whether your current balance can compound to your target with no further saving.
Anchor your inputs to real figures. The 2026 employee elective deferral limit is $24,500, and the combined legal ceiling is $72,000. Those are the outer edges of the contribution figure you will plug in.
The IRS 401(k) contribution limits are adjusted periodically for cost-of-living changes, which means your crossover threshold shifts each time the IRS revises the elective deferral ceiling, making it worth recalculating your personal threshold whenever a new limit takes effect.
One practical warning falls straight out of the prior-balance finding. Avoid cashouts, disruptive rollovers, or early withdrawals that pull your balance back below the threshold, because doing so resets your position on the curve and delays the moment compounding takes over. The Q1 2026 data, where 18% of participants raised savings rates during volatility and only 5.7% touched allocation, suggests staying the course is the norm among those who reach strong long-term balances.
The core reframe The crossover is a mechanical turning point. $1 million is a psychological one. They are not the same thing and do not arrive at the same time.
For most readers, the honest outcome of this exercise is a realisation: you are probably already approaching, at, or past your crossover. The next calculation that matters is not your balance against a million dollars. It is your balance against your personal Coast FIRE number.
The crossover as a checkpoint, not a finish line
The $1 million figure carries no mechanical content. It is a cultural anchor, a round number that feels significant and changes nothing. The crossover is where the engine actually shifts, and for most earners contributing at average or maximum employee rates, that shift lands somewhere around a $175,000 to $350,000 balance, well below the million-dollar mark.
The crossover is necessary but not sufficient. It confirms that compounding has become the dominant force in your account. It does not confirm your destination is funded. That is what the Coast FIRE number tells you, and it is the next calculation to run.
You now hold three layered tools: the crossover threshold, the Coast FIRE formula, and the age-based income multiple. Each answers a different question. Knowing which one to ask, and when, is the real competency here.
This article is for informational purposes only and should not be considered financial advice. Investors should conduct their own research and consult with financial professionals before making investment decisions. Past performance does not guarantee future results. Financial projections are subject to market conditions and various risk factors.