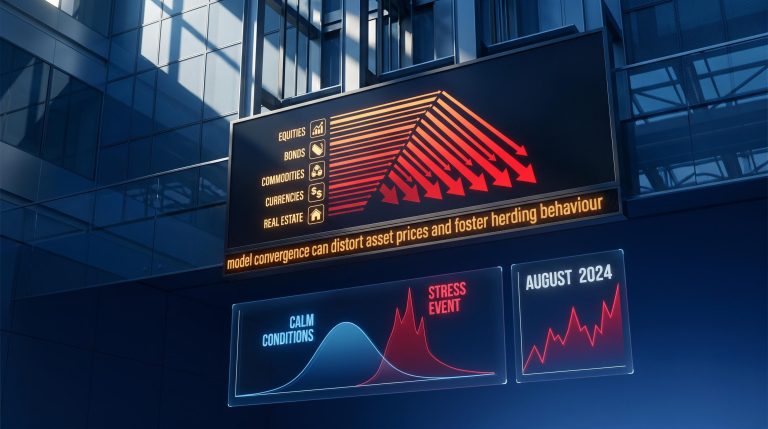
Why AI Makes Markets Safer Daily but Riskier in a Crisis
1 hr ago
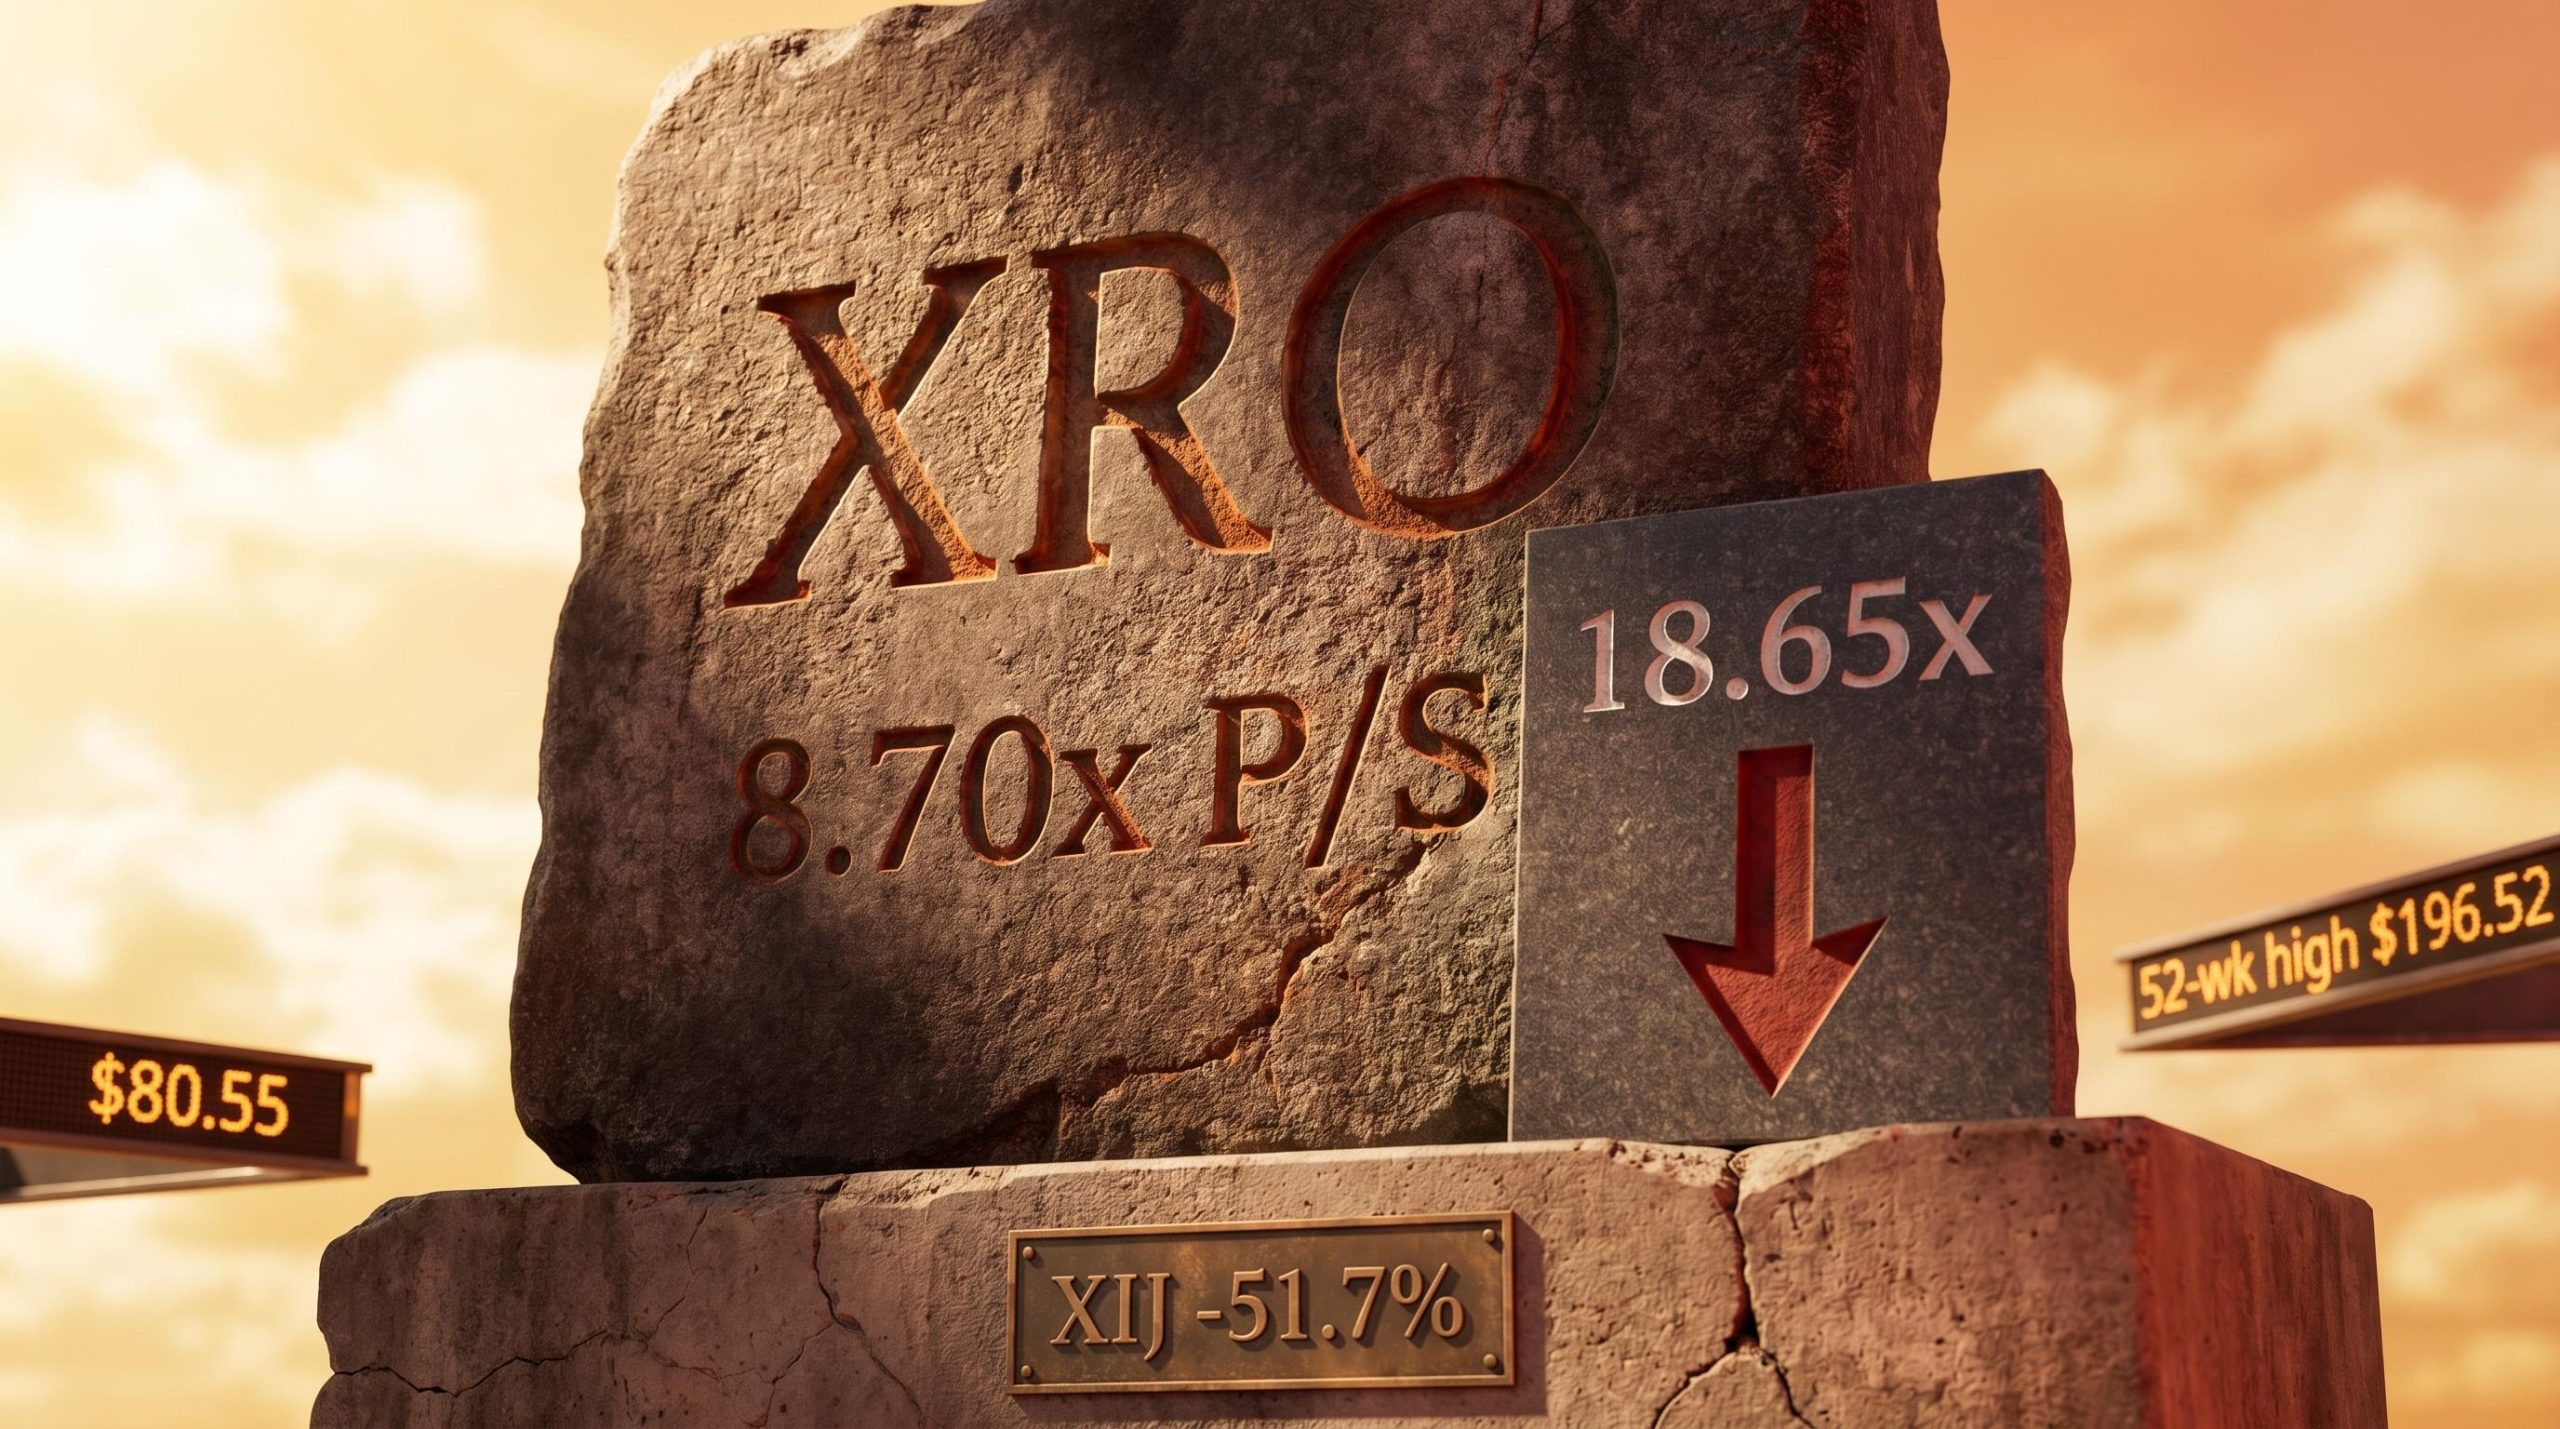
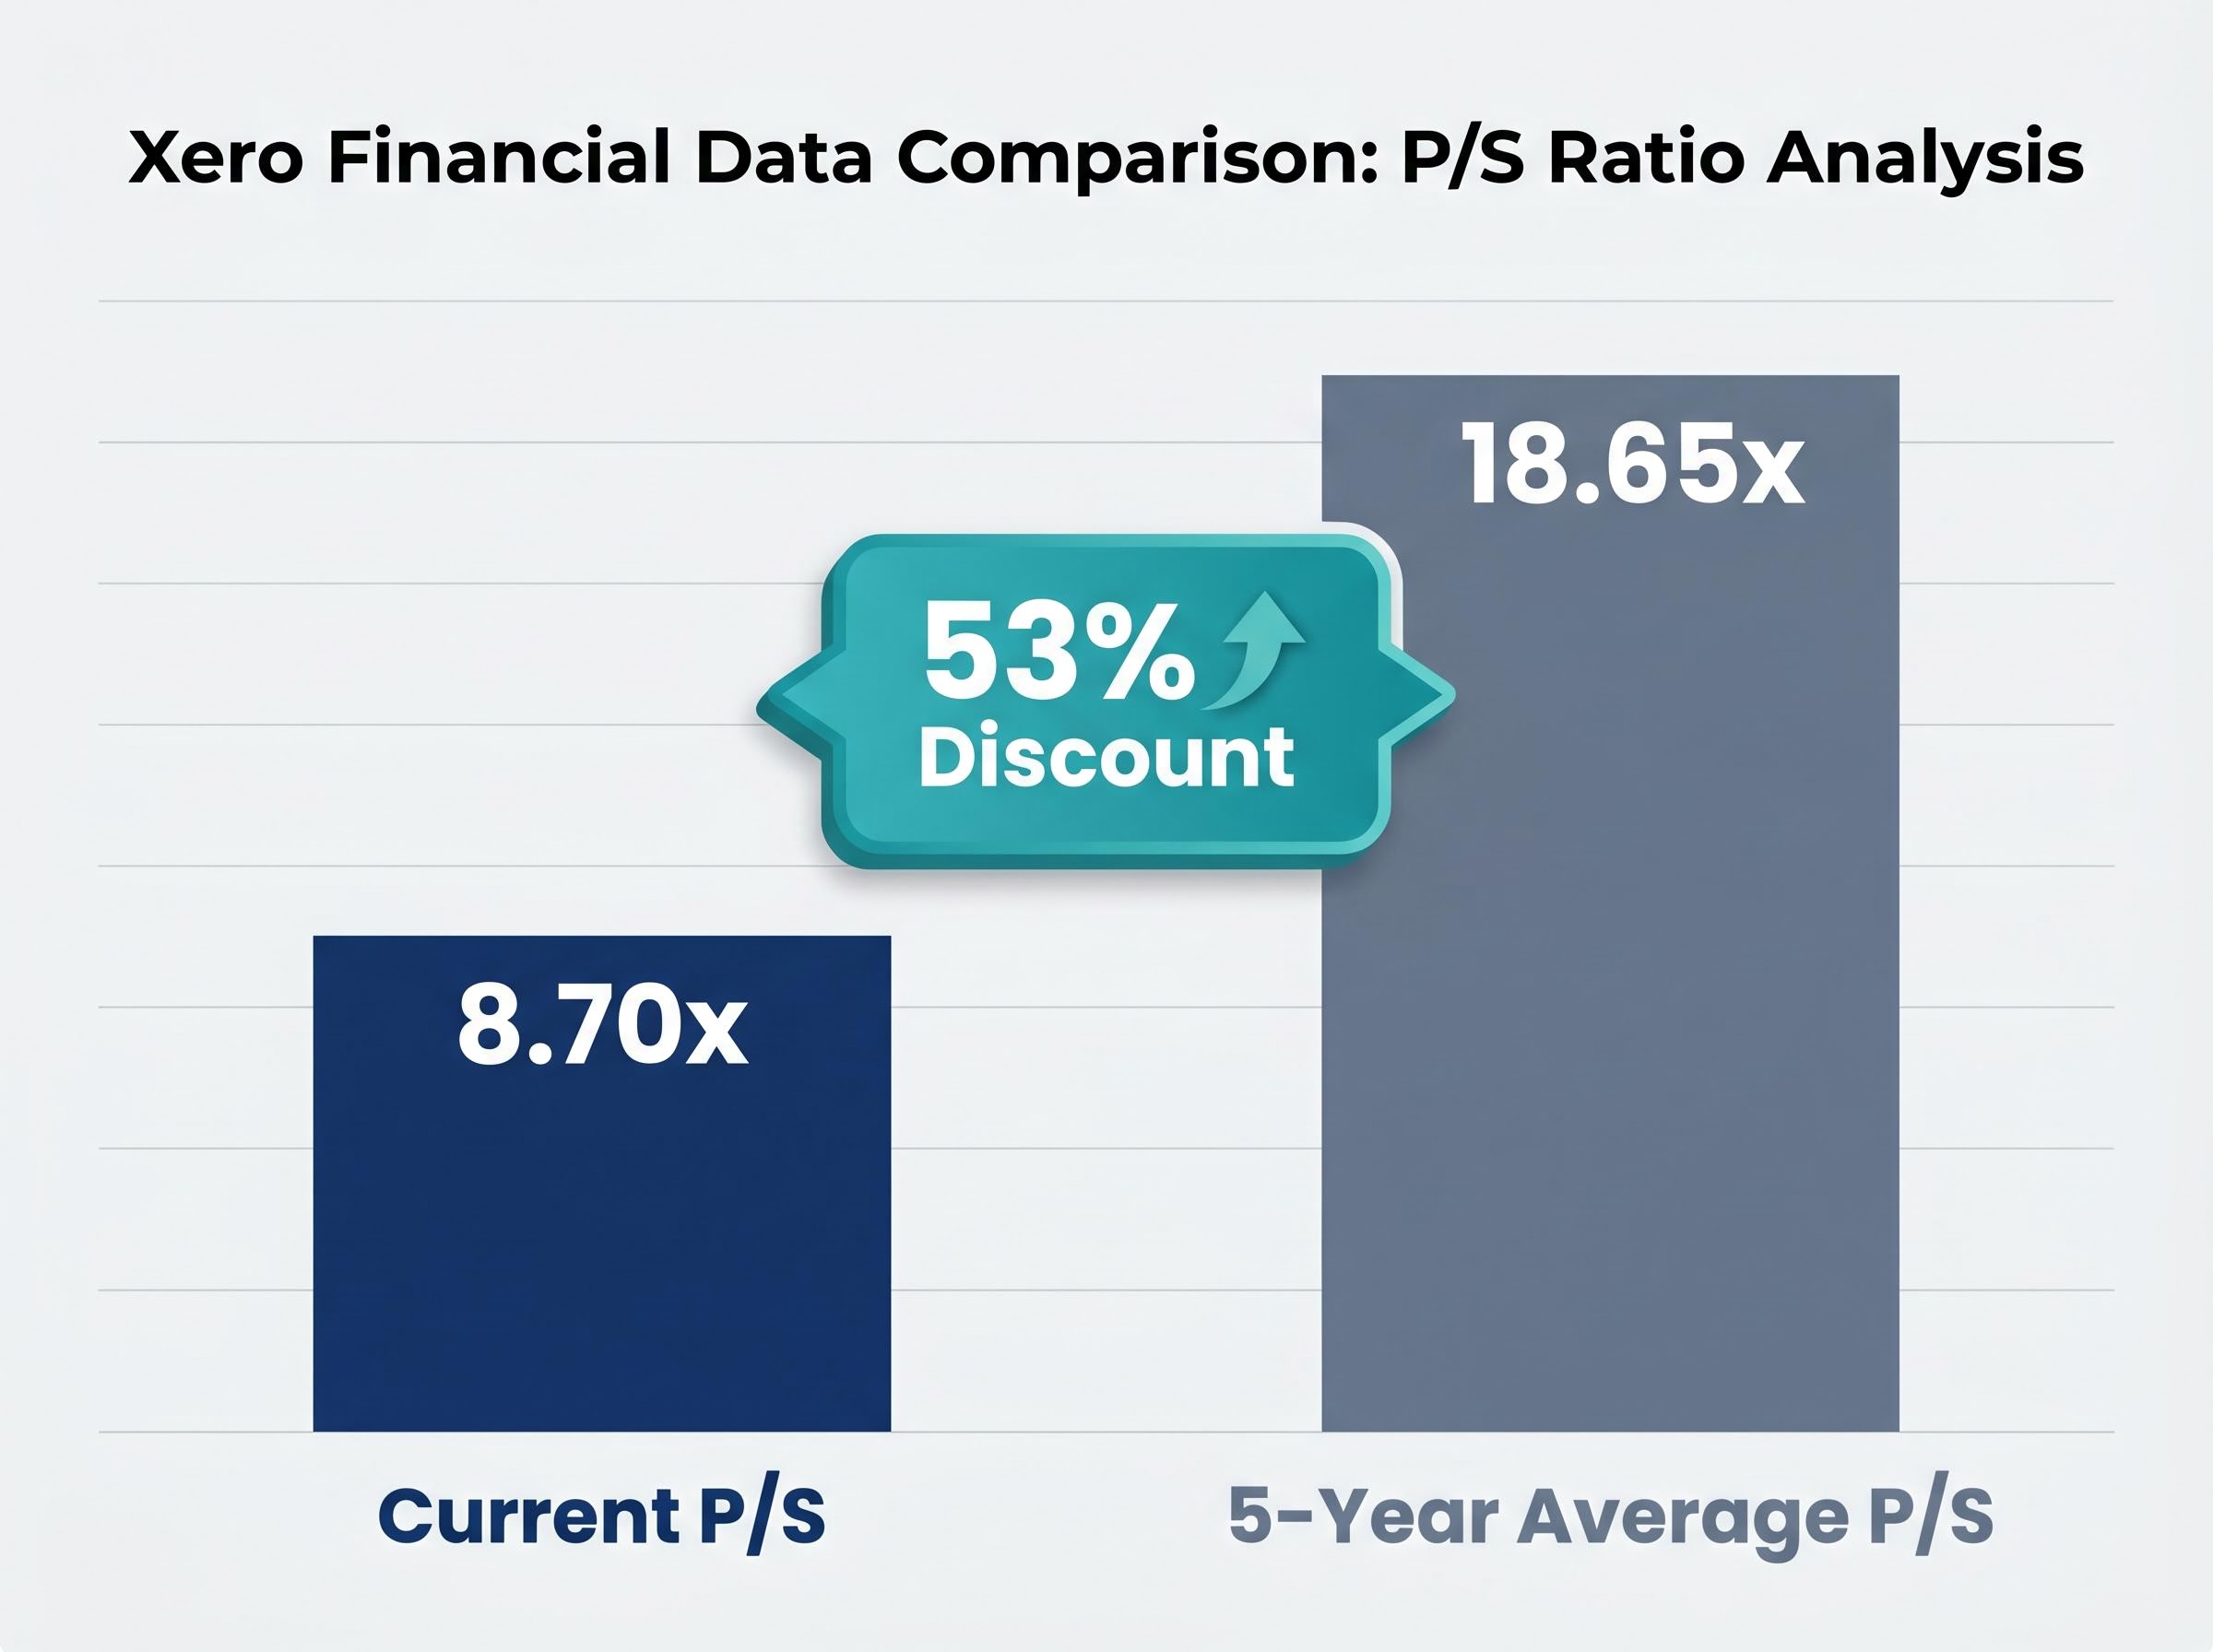
Xero shares have fallen approximately 35.77% since January 2025, compressing the stock’s price-to-sales ratio to roughly 8.70x, against a five-year historical average of 18.65x. That represents a discount of approximately 53%. For quality-focused investors, a gap that wide demands more than a headline; it demands an explanation.
The decline has unfolded against one of the most severe repricing events in recent ASX technology sector history. The S&P/ASX 200 Information Technology Index (XIJ) has fallen approximately 51.7% from its 52-week peak, dragging down high-multiple software-as-a-service (SaaS) stocks regardless of their underlying business performance. Whether Xero’s selloff reflects a structural reassessment of the company or an indiscriminate macro flush is the question retail investors are now working through.
What follows is an examination of what drove the decline, what the business’s financials actually show, how to interpret the P/S discount, where that metric falls short, and which variables will determine whether the current price represents an entry point or a trap.
Three forces have converged on ASX-listed SaaS stocks since the start of 2025, and all three apply to Xero:
The AI disruption pressure on SaaS pricing models has been acute: autonomous AI agents are dismantling traditional per-seat licensing by automating human-driven tasks, and the US enterprise software sector alone lost over $1 trillion in market capitalisation in February 2026 as institutional capital rotated toward pure-play generative AI platforms, a dynamic that compounds the rate-driven derating already weighing on ASX SaaS names like Xero.
Xero has not been singled out. Its shares have moved from a 52-week high of $196.52 to approximately $80.55, a decline of roughly 65% from the peak. That is severe, but the pattern is not unique.
WiseTech Global (ASX: WTC), another high-quality ASX SaaS name, has declined approximately 65.6% from its 52-week high of $121.31 to roughly $41.77. TechnologyOne faces similar headwinds.
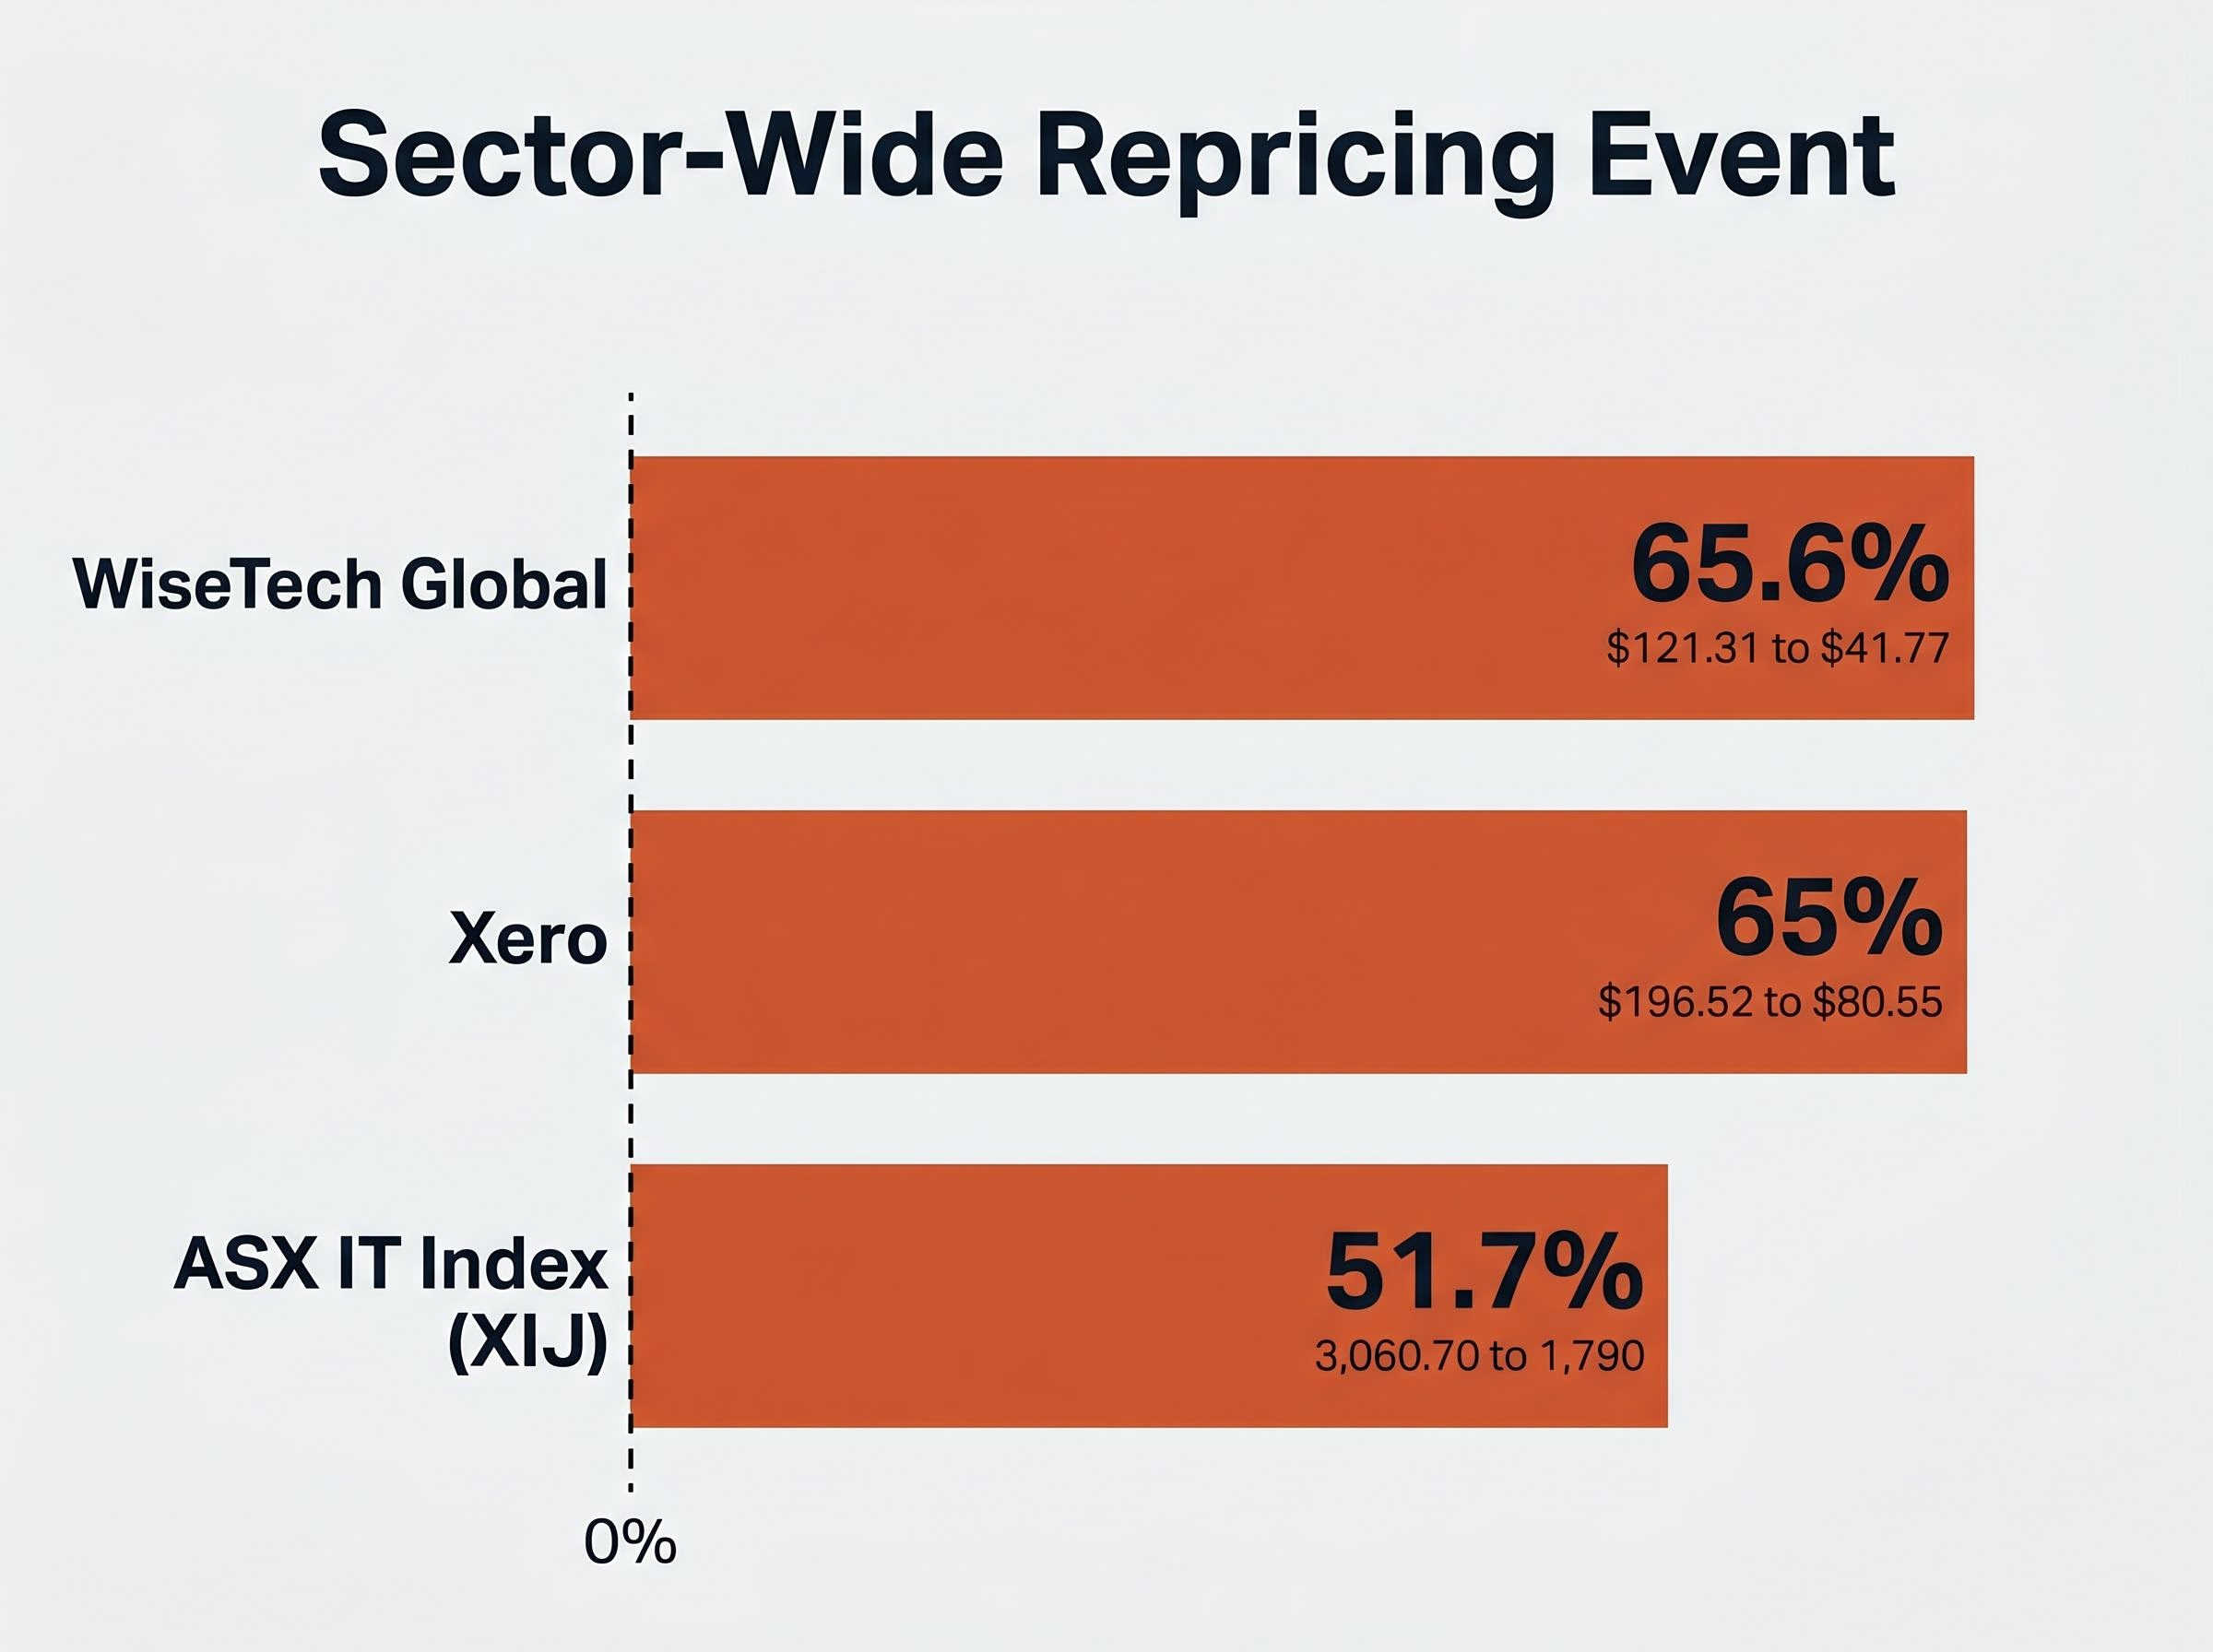
“WiseTech Global has declined approximately 65.6% from its 52-week high, suggesting sector-wide forces are the dominant driver of XRO’s underperformance.”
When two of the ASX’s highest-quality software businesses fall by comparable magnitudes within the same period, the signal is clear: this is a sector event, not an isolated stock story. The analytical task shifts accordingly. Rather than diagnosing what broke at Xero, investors should evaluate whether the business itself justifies a recovery when the macro headwinds ease.
The pattern across the ASX growth cohort is consistent: ASX growth stock multiple compression between October 2025 and April 2026 pushed forward P/E ratios down 26%-64% across ten prominent names, even as consensus earnings forecasts held firm or improved in all but one case, with WiseTech’s FY27 EPS estimates rising approximately 28.9% during the same period its share price fell more than 50%.
Xero operates a cloud-based accounting platform serving small and medium-sized businesses (SMBs), accountants, and bookkeepers across Australia, New Zealand, and the United Kingdom. The model carries structural advantages that few traditional businesses can match: subscription revenue provides predictability, software scales globally at low marginal cost, and the product embeds deeply into customer workflows.
The margin data reflects those advantages.
Gross margin: 88.20% This figure, drawn from the latest annual report, anchors the quality argument. It means Xero retains approximately $0.88 of every dollar of revenue after direct costs, a profile that few industries outside software can sustain.
The operating margin stands at 15.10%, and over the past five years, earnings have grown at approximately 57.1% per year. The revenue decline story, if one exists, sits at the share price level. It does not sit at the business performance level.
| Metric | Xero (Latest Annual) | Typical Traditional Business | Indicative SaaS Range |
|---|---|---|---|
| Gross Margin | 88.20% | 30-50% | 70-85% |
| Operating Margin | 15.10% | 5-15% | 10-25% |
| 5-Year Earnings Growth (p.a.) | ~57.1% | 5-10% | 20-40% |
Note: Traditional business and SaaS range figures are illustrative benchmarks for contextual comparison, not sourced from a single index.
For further context, the five-year average annual return of the ASX XIJ index sits at -0.66%, compared with the ASX 200 at 4.25%. Sector-level weakness has punished even the strongest operators. The distinction between sector performance and business performance is the foundation of the value case, and it needs to be clearly drawn before interpreting the valuation discount.
P/S measures revenue. It does not measure profitability, cash generation, or return on invested capital. A company with deteriorating margins or an unsustainable cost structure can appear cheap on a P/S basis while the underlying economics worsen quarter by quarter. The metric identifies a potential discount. It does not confirm one.
In Xero’s specific case, this limitation is partially mitigated. The 88.20% gross margin and 15.10% operating margin confirm that the business does generate meaningful earnings, not merely revenue. The five-year earnings compound annual growth rate (CAGR) of approximately 57.1% provides additional data that a discounted cash flow (DCF) analysis would need to model forward.
“Price-to-sales identifies a potential discount. Discounted cash flow analysis tests whether that discount is justified.”
For retail investors conducting their own due diligence, a more complete valuation approach involves three steps:
A dividend discount model (DDM) is less relevant for Xero given its growth profile and current dividend policy. The P/S discount is a screening signal. The work that follows the screen is what determines whether the discount is justified.
One framework that contextualises Xero’s margin profile against sector peers is the Rule of 40, a SaaS health benchmark that combines revenue growth rate and operating margin into a single score; companies scoring above 40 command revenue multiples of 8-15x, and each 10-point improvement above that threshold added 1.1x EV/Revenue multiple in Q4 2025, making it a useful cross-check on whether Xero’s current P/S discount is consistent with its underlying operating performance.
Price-to-sales (P/S) is the ratio of a company’s market capitalisation to its annual revenue. It measures how much investors are paying for each dollar of revenue the company generates. For high-growth SaaS businesses that may not yet be maximising earnings, P/S is often a more useful gauge than price-to-earnings, because it captures the market’s assessment of a company’s revenue trajectory and pricing power without being distorted by reinvestment-driven expenses.
Xero’s current P/S ratio sits at approximately 8.70x, according to source theme data. Its five-year average is 18.65x. The discount: approximately 53%.
That figure is not isolated. Alternate measurement approaches produce similar readings. A 10-year median reference places the current P/S at roughly 8.10x against a historical median of 14.37x, a discount of approximately 43.6%. A third estimate puts the current figure as low as 6.31x, roughly 56% below its historical median.
| Measure | Current P/S | Historical Reference | Discount to Historical |
|---|---|---|---|
| Source theme (5-year avg) | 8.70x | 18.65x | ~53% |
| 10-year median variant | ~8.10x | 14.37x | ~43.6% |
| Lowest alternate estimate | ~6.31x | Historical median | ~56% |
The variation between estimates reflects differences in the reference period and revenue base used. The directional finding is consistent across all three: Xero is trading at a material discount to its own valuation history.
The average 12-month analyst price target for Xero is $141.45, against a current price of approximately $80.55. That implies potential upside of roughly 75%.
The range, however, signals genuine uncertainty. The lowest target sits at $87.67, barely above the current price. The highest reaches $245.49. Professional opinion sees material upside from current levels, but the width of the spread reflects the degree to which the outcome depends on macro variables that no single analyst can forecast with precision. Analyst targets represent one data point in a probabilistic assessment, not a guarantee of future performance.
The retrospective analysis points to a high-quality business at a depressed price. The forward-looking question is whether the conditions that created the depression will persist.
The RBA cash rate trajectory is the single most consequential external variable. A dovish pivot would reduce the discount rate applied to future earnings and could rapidly re-rate the entire ASX SaaS cohort. A sustained or elevated rate environment extends the valuation compression. Commentators consistently identify RBA rate decisions as the primary catalyst in either direction for stocks like Xero.
The RBA’s May 2026 monetary policy outlook sets out the Board’s current cash rate assumptions, inflation forecasts, and economic growth projections, providing the macro framework against which any rate pivot scenario for ASX growth stocks should be assessed.
The AI disruption question cuts both ways. If generative AI proves structurally disruptive to accounting software workflows, Xero’s competitive moat faces a direct threat. If the company successfully embeds AI as a product feature, as approximately 76% of private SaaS companies are now doing, it could become a competitive advantage rather than a vulnerability.
Wall Street’s emerging AI-native versus AI-adjacent classification assigns materially different valuation premiums to each category: roughly 16-22x FY2027 EV/Sales for AI-native platforms versus 10-14x for AI-adjacent software, a distinction that has direct implications for how Xero’s accounting platform is priced as it integrates generative AI as a product feature rather than a core infrastructure play.
Investors weighing a position should track four items:
Xero’s FY2025 results, subscriber growth trajectory, revenue per user trends, and any churn guidance from management are the company-specific inputs that current research materials do not yet contain. These are available through Xero’s ASX announcements platform and investor relations page. Any investment decision made without reviewing these figures is incomplete, regardless of how attractive the valuation signal appears on a screen.
Xero’s 52-week trading range of $67.93 to $196.52 illustrates the scale of potential repricing in both directions. The current price sits closer to the bottom of that range than the top.
The data supports a clear summary position:
The next step for retail investors is not a buy or sell decision. It is sourcing the company-specific data, reviewing FY2025 results and management guidance, and running a DCF stress-test before acting on the valuation signal.
This article is for informational purposes only and should not be considered financial advice. Investors should conduct their own research and consult with financial professionals before making investment decisions. Past performance does not guarantee future results. Financial projections are subject to market conditions and various risk factors.
A price-to-sales ratio measures how much investors pay for each dollar of a company's annual revenue. For high-growth SaaS businesses like Xero, it is often more useful than price-to-earnings because it captures the market's view of revenue trajectory without being distorted by reinvestment-driven expenses.
Three main forces converged on Xero: rising RBA interest rates compressing growth stock valuations, market concern that generative AI could erode SaaS pricing power, and a broad sector derating that pushed the ASX Information Technology Index down approximately 51.7% from its 52-week peak.
Xero's fall is broadly consistent with peers; WiseTech Global declined approximately 65.6% from its 52-week high over the same period, suggesting sector-wide macro forces rather than Xero-specific problems are the dominant driver.
Xero reported an 88.20% gross margin and a 15.10% operating margin in its latest annual results, alongside a five-year earnings compound annual growth rate of approximately 57.1%, none of which reflect the kind of business deterioration that would typically accompany a 35% share price decline.
Investors should source Xero's FY2025 results including revenue, subscriber count, churn metrics, and management guidance, run a discounted cash flow stress-test using conservative assumptions, and monitor RBA rate decisions and Xero's AI product strategy updates before drawing any conclusions.