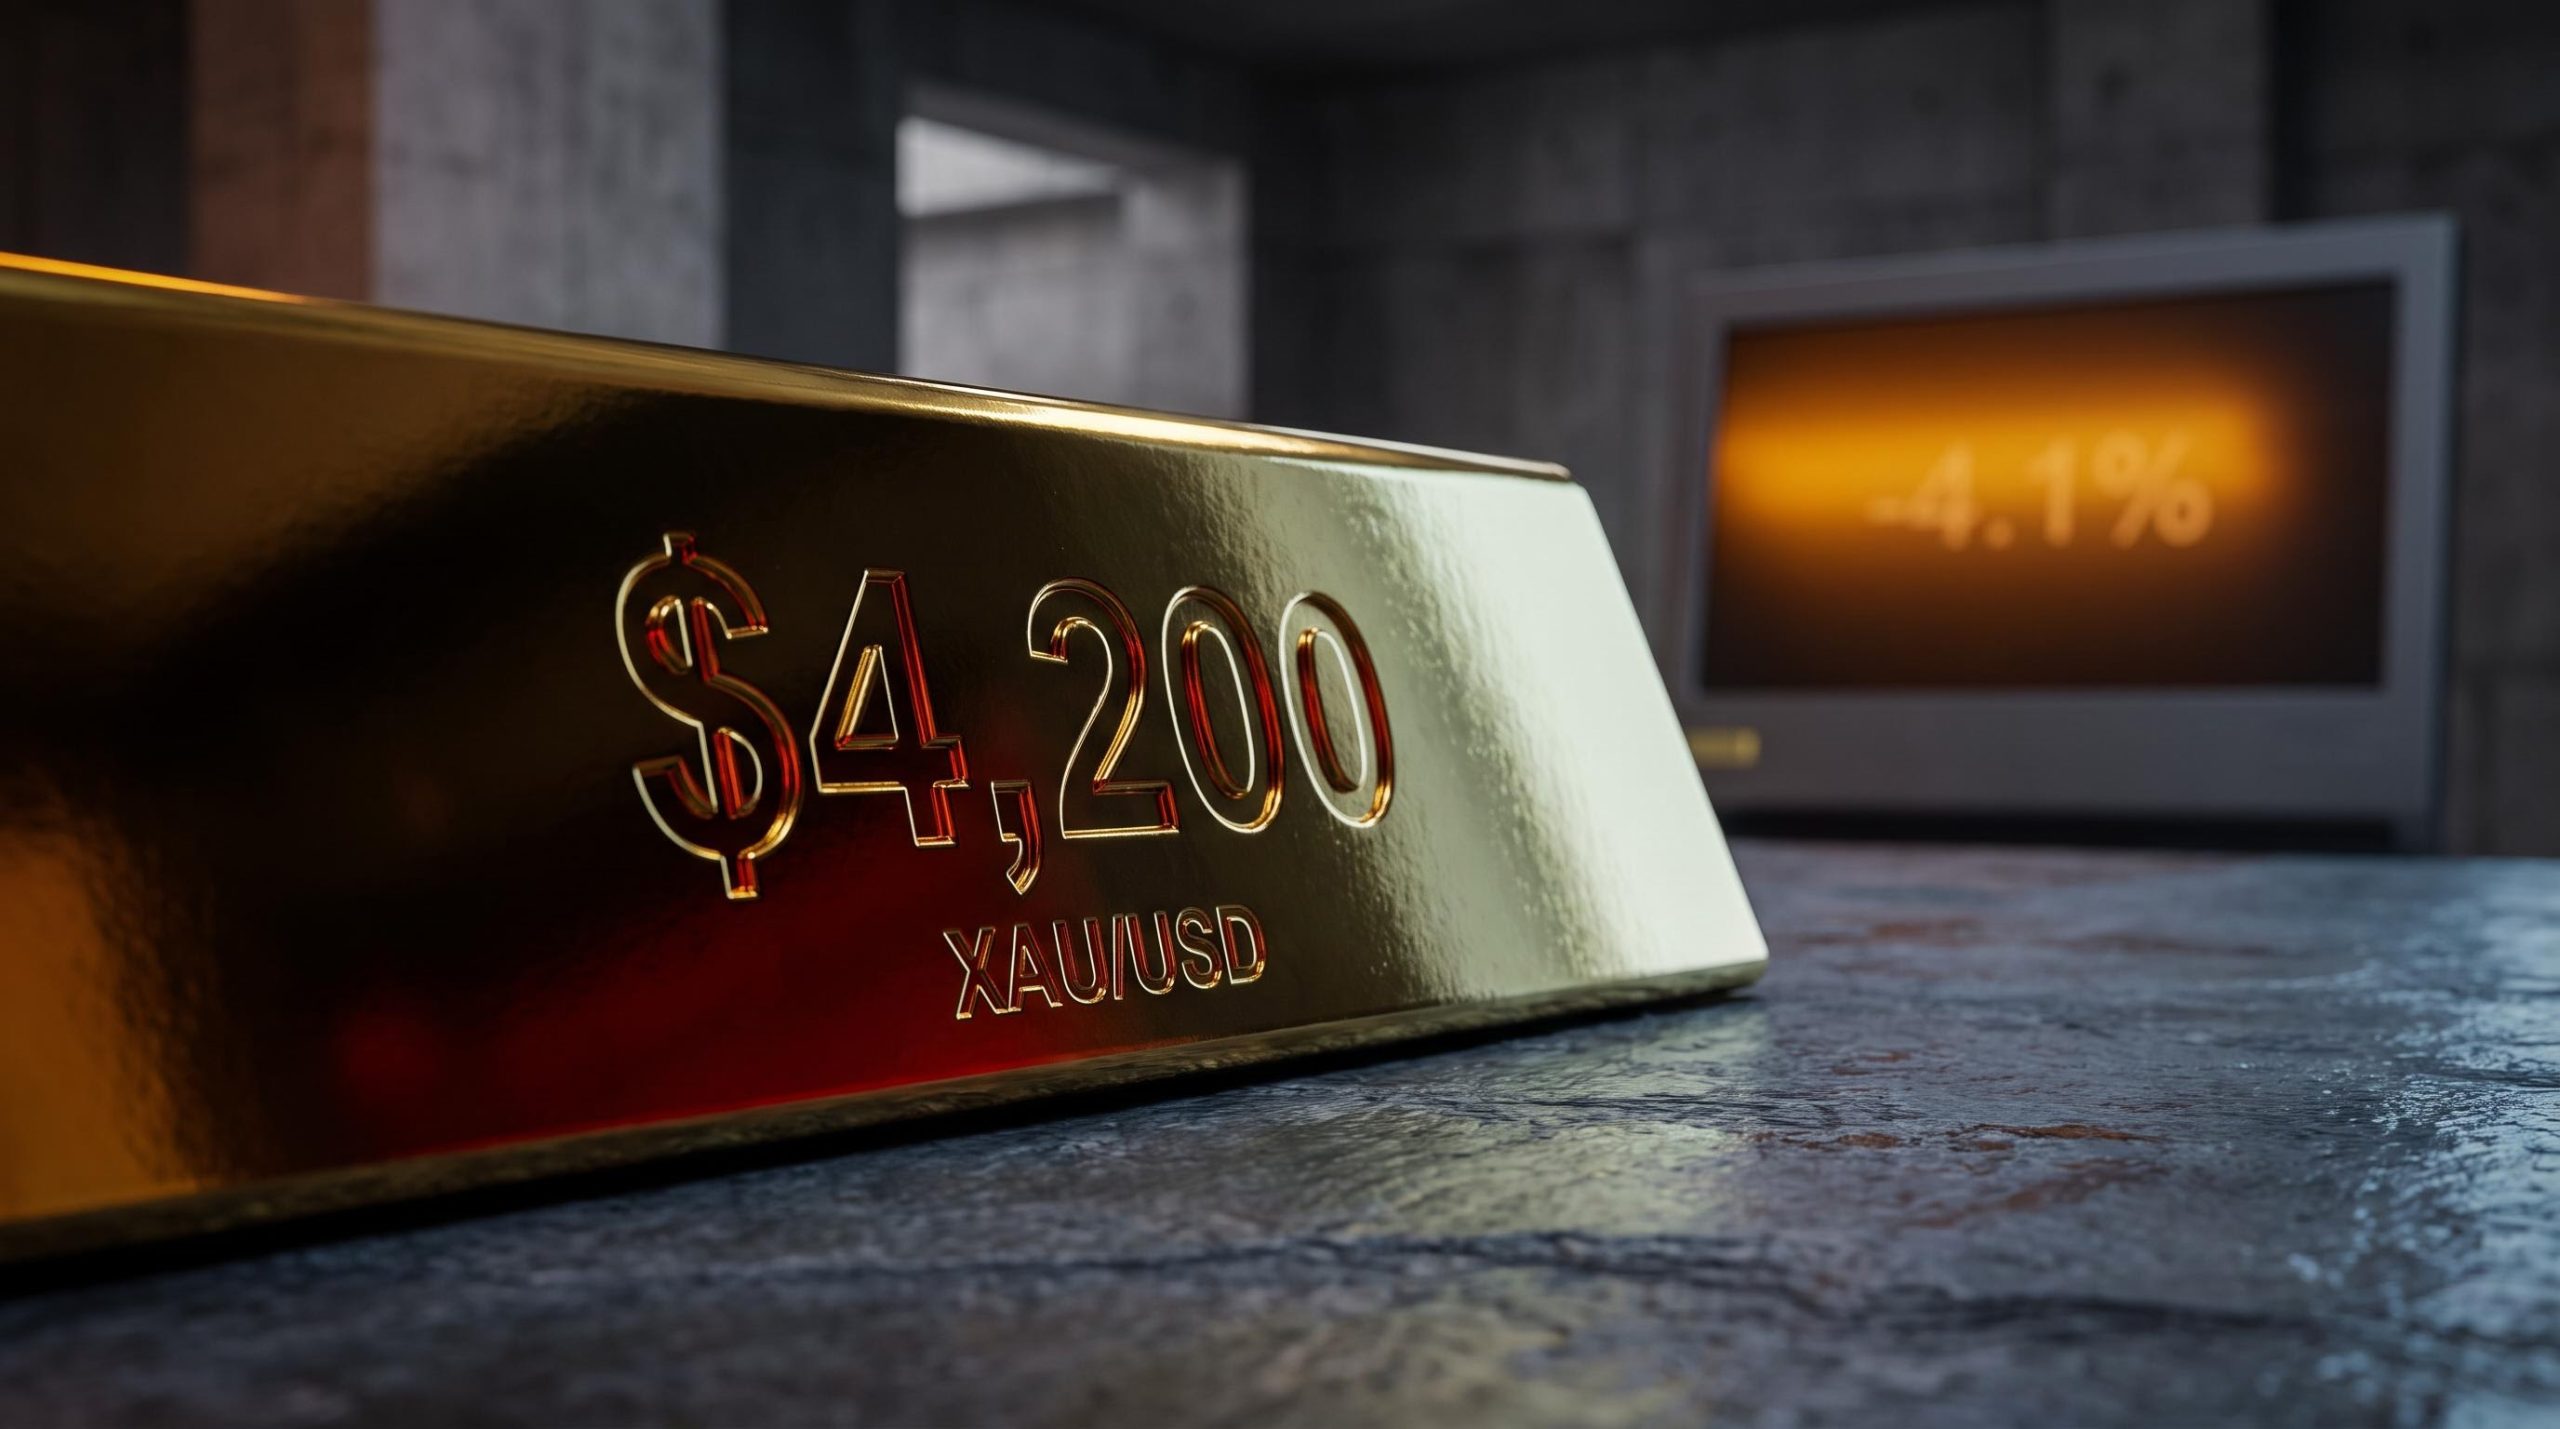
Gold is sitting in the low-to-mid $4,300s, and the Federal Reserve has just told the market it may not be done hiking. That combination raises a sharper question than the usual gold headline: not whether the metal is under pressure, but whether the floor beneath it will hold.
The pressure is real and multi-sourced. The dollar is climbing, real yields sit near their highest levels since 2007, and both push against a non-yielding asset. Yet in the same window, global central banks bought a net 244 tonnes of gold in Q1 2026 alone, a demand force that pays no attention to the next rate decision.
That is the tension this analysis unpacks. What follows here is a map of what actually moves XAU/USD right now, sorting the forces with staying power from the ones that are transient, so you can articulate both the bull case and the bear case with reference to the rate path, the dollar, and the specific technical levels where the market will render its verdict first.
Why the Fed’s updated rate projections are the dominant drag on gold right now
Start with the mechanism, because the price action makes no sense without it.
On 16 September 2026, the Federal Open Market Committee delivered a 25 basis-point hike, lifting the target range to 3.75%-4.00%. That was the easy part to read. The harder signal sat in the Summary of Economic Projections, where the median dot for the federal funds rate landed at 4.1% for 2026.
A 4.1% median with the range already at 3.75%-4.00% means one thing: between 12 and 16 of the 18 policymakers expect at least one more quarter-point hike before the year closes. This is not a market guess about the Fed. It is the Fed pre-committing, on paper, to a hawkish posture.
The Fed’s Summary of Economic Projections released on 16 September placed the median federal funds rate at 4.1% for 2026, the primary document anchoring market expectations for the final hike now priced into gold’s current suppression.
Here is how that projection travels into gold’s problem, one link at a time:
- A higher expected Fed rate lifts nominal and real Treasury yields.
- Rising real yields raise the return on holding risk-free government debt.
- That widens the opportunity cost of holding gold, which pays no yield at all.
When a 10-year Treasury pays a real return that keeps climbing, gold has to compete against a rising risk-free alternative while offering nothing in coupon. The 10-year yield made that competition vivid, peaking at 5.041% on 15 September 2026, its highest reading since 2007, before easing to 4.95% by 21 September.
The relationship between real yields and gold prices is not a simple inverse function: it operates through the spread between nominal Treasury yields and TIPS breakeven inflation, and that spread has behaved differently across each of the past three tightening cycles.
The higher-for-longer consensus has named faces
What makes this a durable headwind rather than a one-day repricing is that Fed officials have put their names to it.
“Better to act sooner than wait.” That was the framing from Alberto Musalem, President of the St. Louis Fed, in a 21 September 2026 interview, arguing further hikes are needed to bring demand-driven inflation and a broad commodity price shock under control.
Susan Collins, President of the Boston Fed, added the other half of the picture the same day, confirming she backed the September hike and expects rates to stay unchanged through next year. Ricardo Evangelista of ActivTrades reads the medium-to-long-term picture the same way, noting gold’s path from here will be heavily dictated by monetary policy and dollar strength.
The read for you is straightforward. The primary bearish force on gold is not a surprise the market has to digest. It is a policy stance the Fed has explicitly signalled, which means gold bears are not fighting the central bank. They are aligned with it heading into Q4.
When big ASX news breaks, our subscribers know first
How the dollar’s strength is amplifying bearish pressure, and what is currently capping it
Rates are the first front. The dollar is the second.
As of 21 September 2026, Bloomberg recorded the US Dollar Index (DXY) at 100.4150. The Bloomberg Dollar Spot Index had climbed 1.1% over the week ending 18 September, its strongest weekly showing since June, driven squarely by the higher-rate expectations described above.
A stronger dollar hurts gold through two channels at once. Because gold is priced in dollars, a rising greenback makes the metal more expensive for buyers holding other currencies, which cools global demand. At the same time, dollar strength tends to accompany risk-off positioning, and that puts the dollar in direct competition with gold for the same safe-haven allocation.
| Catalyst | Mechanism | Gold impact |
|---|---|---|
| Fed hike projection | Higher real yields | Raises opportunity cost of holding gold |
| Dollar strength | Gold more expensive in foreign currencies | Reduces global demand |
| Sustained high yields | Competing risk-free return | Shifts institutional allocation away from gold |
Independent metals trader Tai Wong ties the recent downward pressure to the market actively pricing in September hikes, alongside softer inflation expectations and a dollar sitting at 13-month highs. Institutional money is repositioning to match.
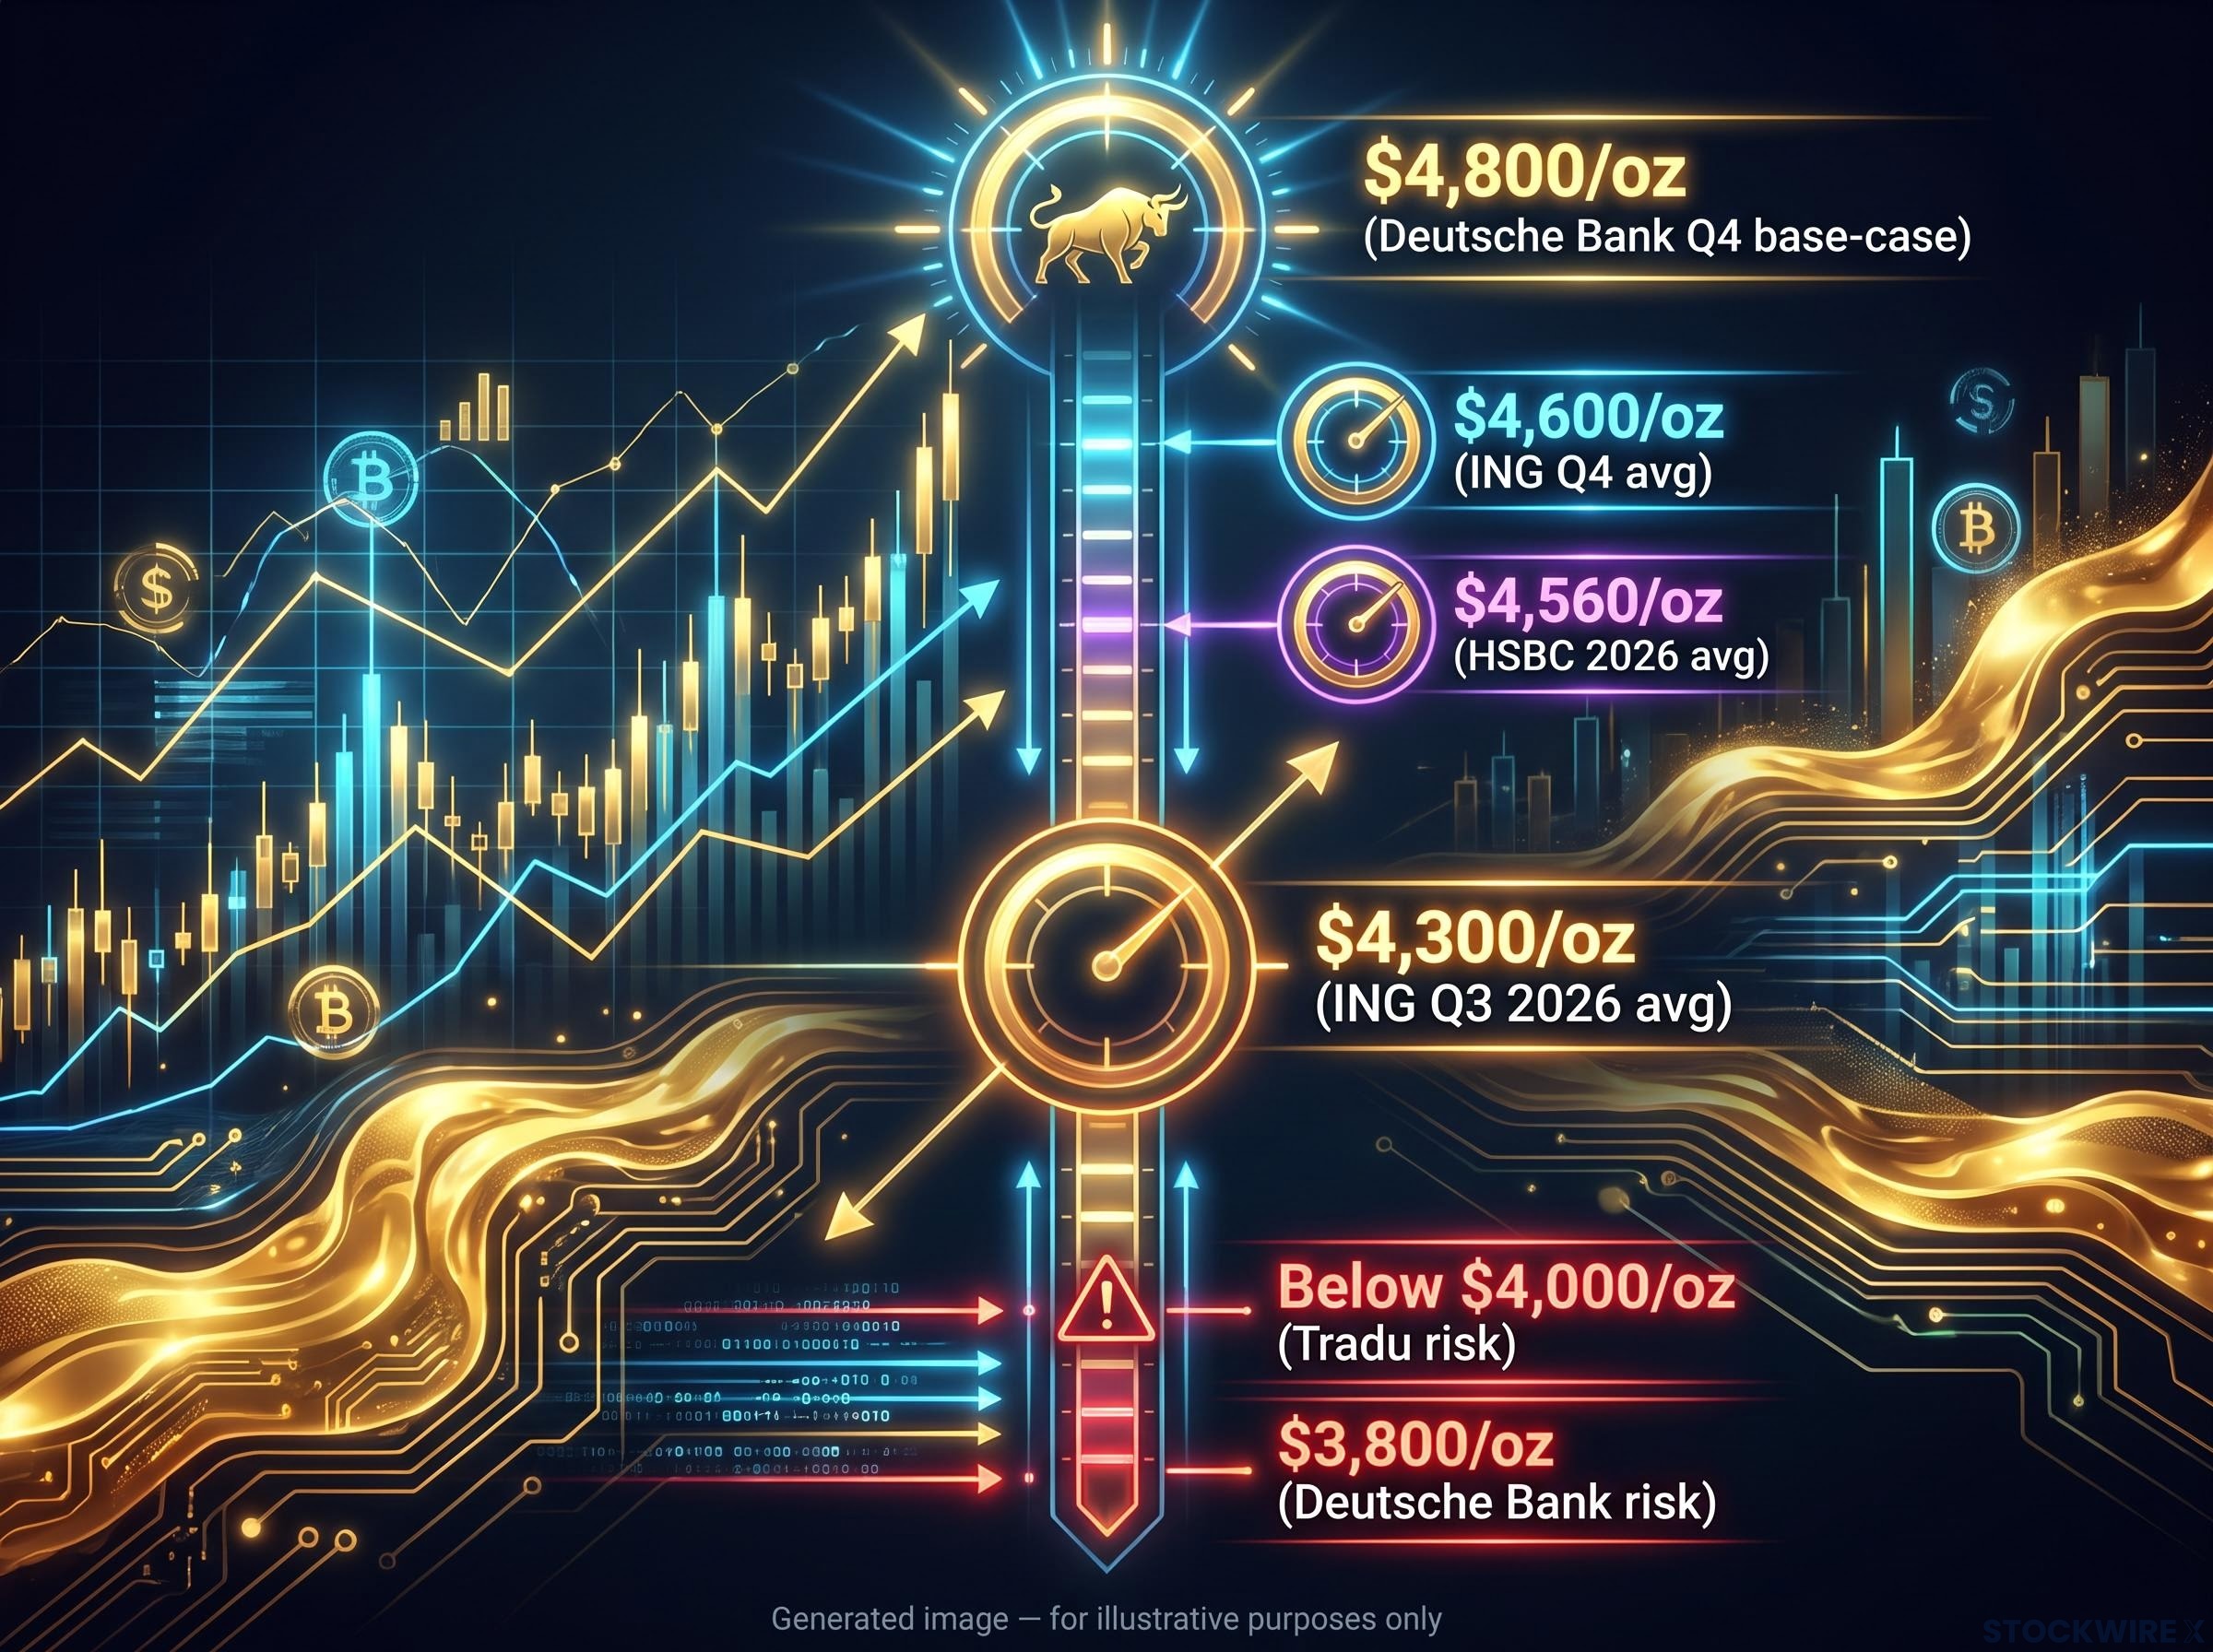
HSBC has revised its 2026 average gold forecast down to $4,560/oz, citing the hawkish shift in US policy expectations and a stronger dollar. ING went further, cutting its forecasts to an average of $4,300/oz in Q3 2026 and $4,600/oz in Q4, explicitly pointing to hawkish Fed signals.
There is a relief valve, and it explains why the downside has been limited rather than open-ended. A recent pullback in crude oil prices eased near-term inflation anxiety, which pulled Treasury yields back from their 5.041% peak and stopped the dollar from extending its run. That gave gold a partial buffer near $4,300.
The read for you is a conditional one. Gold’s current support is leaning on subdued oil prices to keep yields in check, which means any re-acceleration in crude would knock out one of the metal’s few near-term props. Watch oil, not just the Fed.
What history tells us about gold during Fed tightening cycles, and why the current setup may be late-phase
Step back from the immediate pressure and the picture shifts.
The near-term pain is well documented. Benzinga’s review of 10 Fed hiking cycles since 1972 found gold slipped an average of -0.7% in the month immediately after the first hike. That aligns cleanly with what gold is doing now.
The medium-term picture is where it turns. In that same Benzinga dataset, gold gained an average of 6.1% in the 12 months following the first hike, finished higher in 7 of 10 periods, and posted a median gain of 8.1%. A Financial Express analysis of recent cycles points the same way, with median returns of +11.5% six months after the first hike and +7.5% one year after.
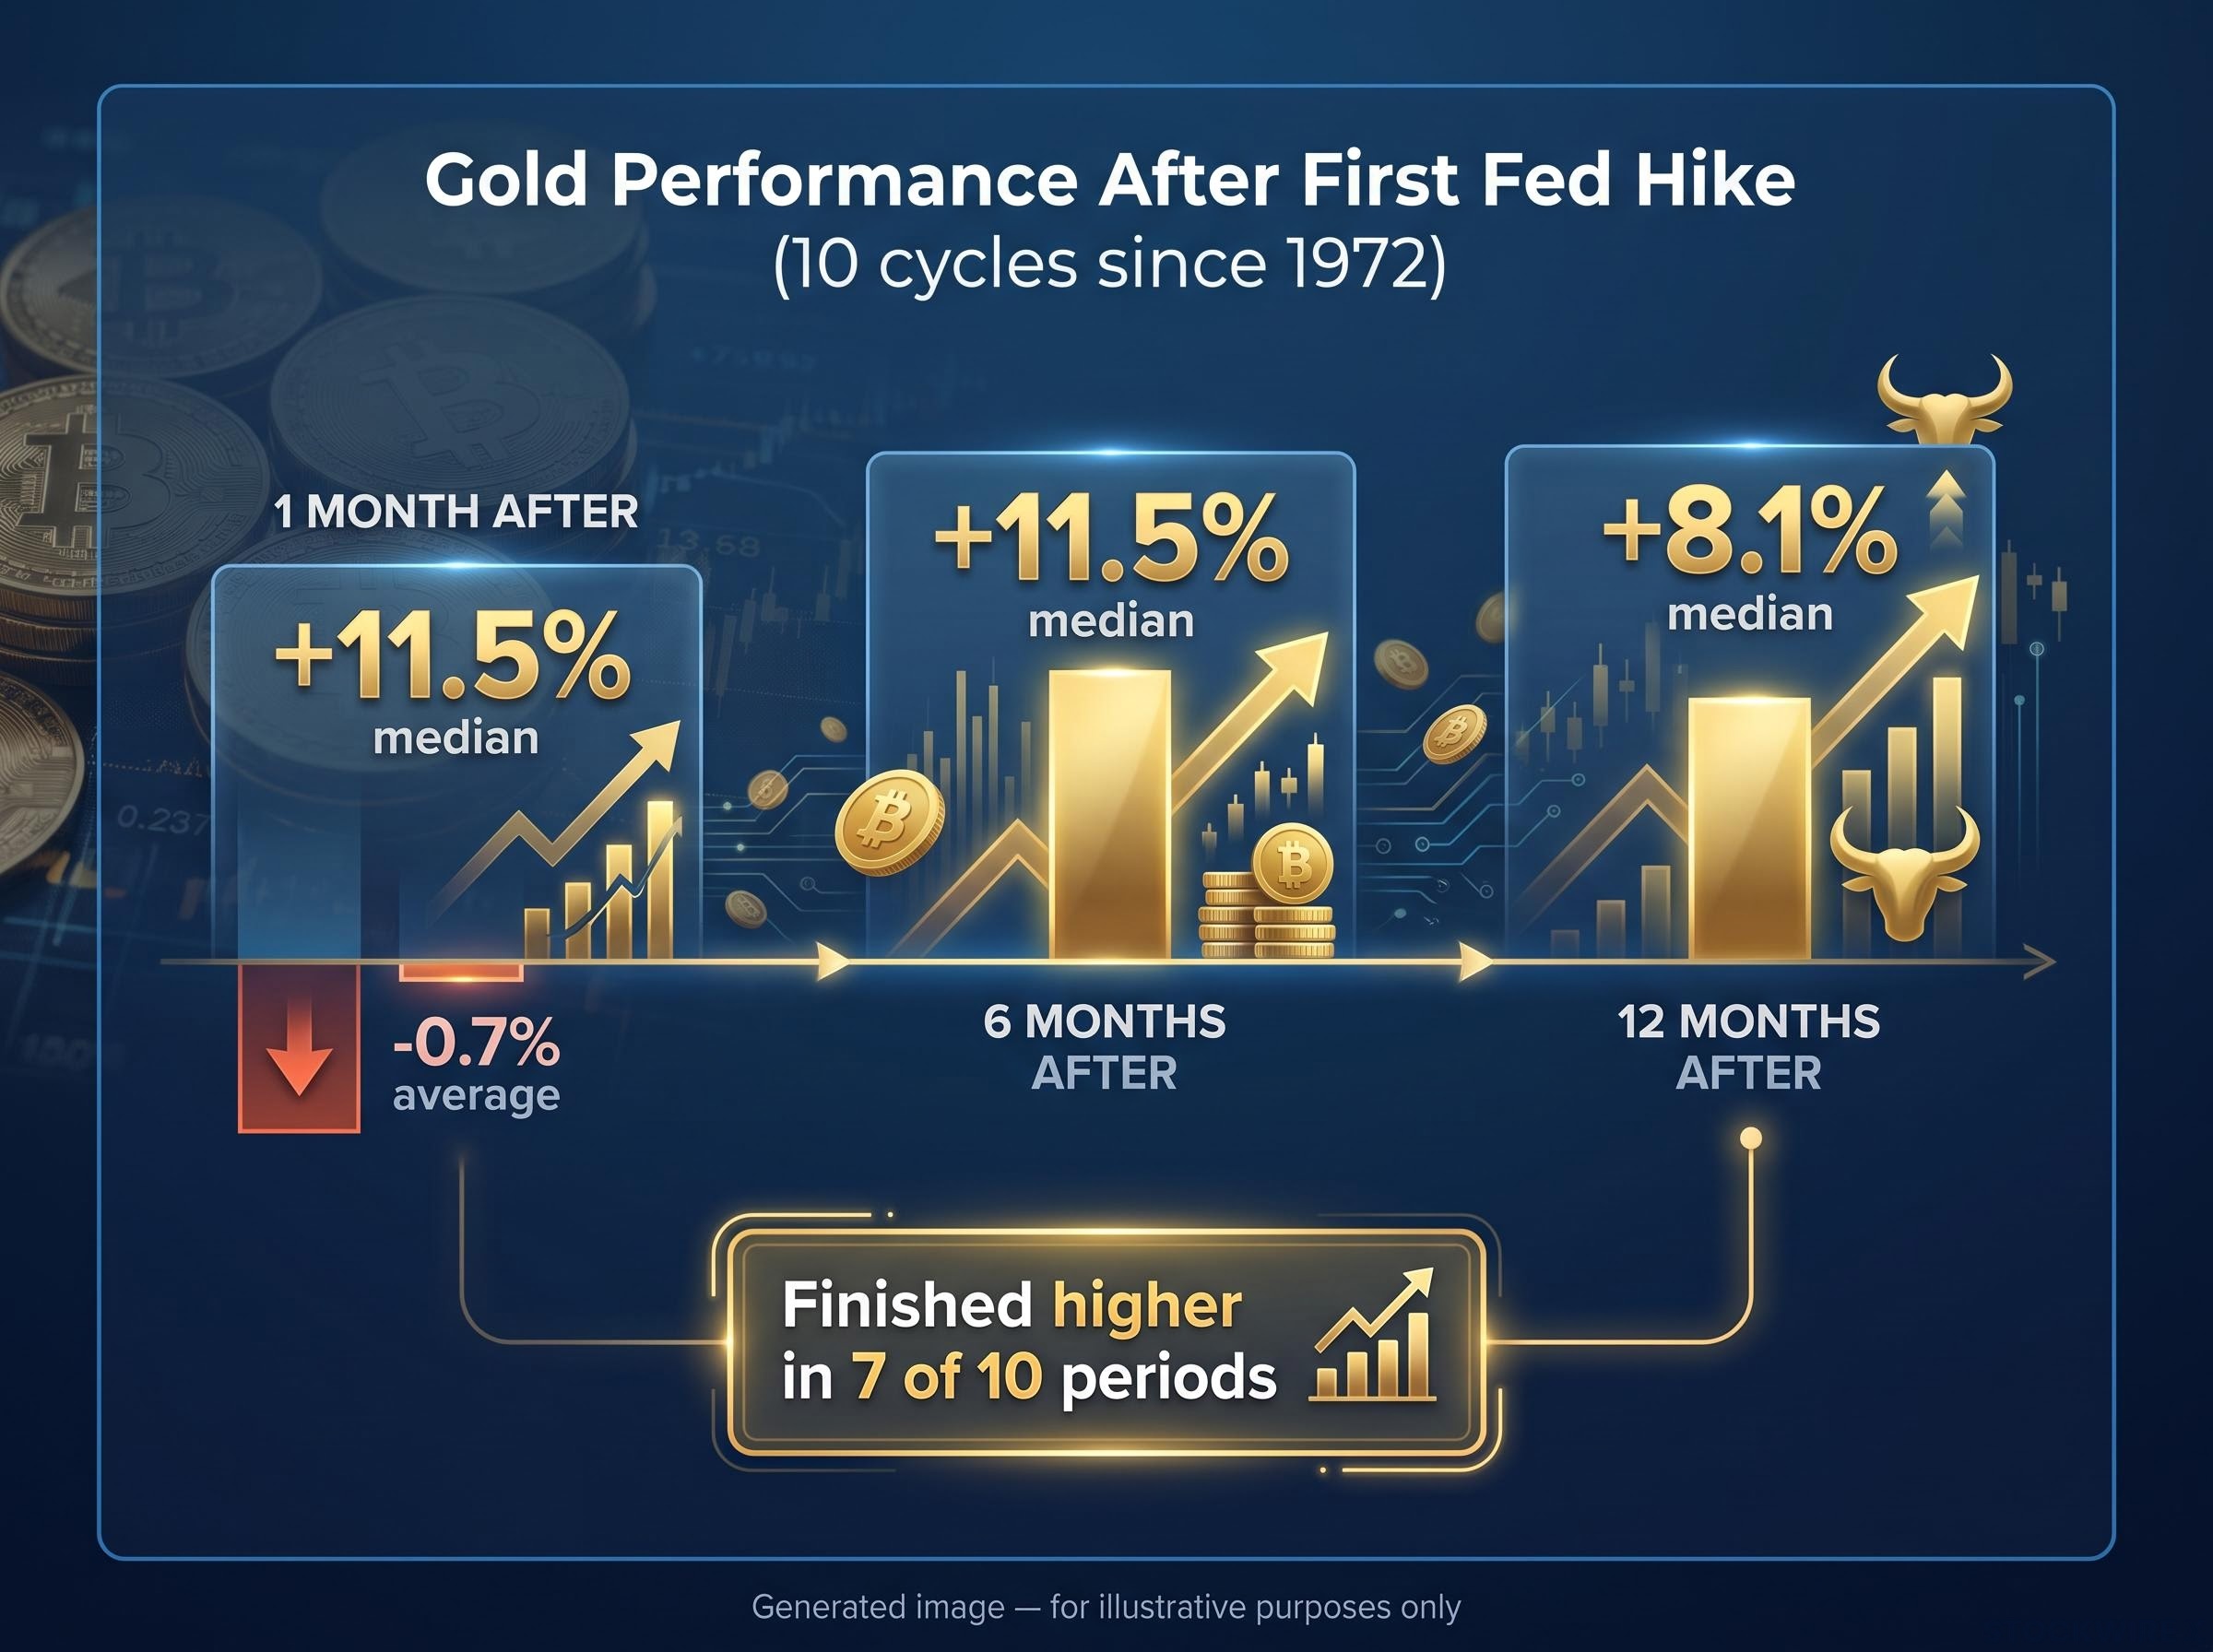
The three phases of a tightening cycle tend to run like this:
- Pre-hike and early-hike underperformance, with gold typically dipping around -0.7% in the first month.
- Mid-cycle volatility, as the market absorbs the pace and duration of tightening.
- Post-cycle recovery, with median gains near +8.1% in the 12 months once the hiking concludes.
The World Gold Council’s cycle data adds texture to how varied that recovery can be.
| Tightening cycle period | Annualised return during cycle | Source |
|---|---|---|
| 1999-2001 | 2.2% | World Gold Council |
| 2004-2007 | 20.8% | World Gold Council |
| 2015-present | 7.2% | World Gold Council |
Why this looks like a late-phase environment
The current setup does not resemble the start of a tightening cycle. It resembles the end of one.
The Fed has already delivered multiple hikes, real yields sit at multi-year highs, and the dot-plot points to a single additional hike as the most likely outcome rather than an extended series. Goldman Sachs frames the implication directly: as expectations for further hikes eventually fade, US monetary policy stops being such a drag and gold’s relative appeal improves.
JPMorgan Global Research reinforces the two-sidedness, citing robust investment demand and macro uncertainty as drivers while flagging its main bearish risk as a scenario where US growth accelerates and forces more aggressive hikes.
The read for you is about time horizon, not direction alone. If the Fed delivers one final hike and pauses, the historical record suggests gold’s current suppression is closer to its end than its beginning, which changes how long any bearish position deserves to be held.
The structural demand floor and what is limiting gold’s downside despite macro headwinds
Here is what keeps the bear case from becoming a one-directional story.
Central banks are the floor. Crux Investor reports a net 244 tonnes of gold purchased by central banks in Q1 2026, and the World Gold Council’s Q2 2026 report noted a 62% year-over-year jump in official-sector buying, driven by softer prices and geopolitical positioning.
This demand behaves differently from speculative flows. Central banks are diversifying reserves away from the dollar on a multi-year mandate, which makes their buying largely indifferent to the next rate decision or inflation print. Three structural pillars sit beneath the metal:
Central bank reserve diversification away from dollar holdings has accelerated sharply since 2022, when the freezing of approximately $300 billion in Russian sovereign assets demonstrated that dollar-denominated reserves carry jurisdictional risk that physically vaulted gold does not.
- Central bank reserve diversification away from dollar holdings.
- Geopolitical safe-haven allocation during periods of macro uncertainty.
- ETF accumulation tied to the dollar-debasement narrative.
TD Securities analyst Ryan McKay argues that this combination of central bank buying, ETF accumulation and a renewed debasement narrative creates durable support that outlasts systematic fund sell-offs.
Speculators have paired back, not capitulated
The positioning data tells a similar story on the tactical side.
CFTC figures from mid-September showed managed money net-long at roughly 133,116 COMEX gold contracts and large speculators net-long at approximately 230,338 contracts. That is a modest week-over-week reduction, cautious paring rather than a rush for the exits, and it leaves room for a short-squeeze if key support levels hold.
The two-sided risk is best captured by the spread in institutional targets.
Deutsche Bank projects a Q4 base-case target of $4,800/oz assuming an indefinite Fed hold, but flags a risk scenario of 3 to 4 additional aggressive hikes that could drive gold toward $3,800/oz.
Nikos Tzabouras of Tradu sits nearer the bearish edge, warning gold risks slipping below $4,000/oz if Fed hawkishness and dollar strength persist.
The read for you is where the analytical weight lands. The 62% year-over-year surge in central bank buying tells you the base beneath gold is not retail sentiment or ETF flows that reverse on the next CPI print. It is sovereign-level portfolio decisions that persist whether or not the Fed hikes once more, and that is what stops rising yields and a strong dollar from being an unambiguous sell signal.
What the technical picture tells you about XAU/USD’s near-term risk boundaries
The macro arguments do not stay abstract. They get tested at specific prices.
XAU/USD is trading within a broad $4,200-$4,565 band, with spot around $4,342-$4,353/oz as of 21 September 2026, having recently bounced from an over one-month low. The levels below are where each side of the argument gets confirmed or denied.
| Level type | Price zone | Significance |
|---|---|---|
| Resistance (near-term) | $4,380-$4,395 | First ceiling before momentum can build |
| Resistance (key) | $4,510-$4,541 | Band that must clear for the bull case |
| Resistance (critical) | $4,530 (200-period SMA) | StoneX bull-case threshold |
| Support (near-term) | $4,223-$4,235 | Mitrade floor zone |
| Support (critical) | $4,200 | StoneX ultimate support, breach signals dominant bearish bias |
StoneX identifies $4,530, which aligns with the 200-period simple moving average, as the level the bull case needs to reclaim. On the downside, StoneX flags $4,200 as ultimate critical support, warning that a breach would invite a dominant bearish bias.
The 200-day SMA support zone near $4,527-$4,530 was stress-tested as recently as 28 August 2026, when hawkish Jackson Hole commentary drove CME-linked rate hike odds up roughly 20 percentage points overnight and sent gold through $4,600 intraday before the level held.
The moving average dashboard splits by timeframe:
- Short-term averages (MA5, 10, 20, 50) are flashing Sell, capturing the current weakness.
- Long-term averages (MA100, 200) remain on Buy, signalling the broader uptrend is still intact.
That divergence is the whole story in miniature. The read for you is that the present weakness looks like a correction inside a still-standing structural trend rather than a reversal, which is exactly how the CFTC positioning frames the risk: room for long-liquidation if support breaks, but genuine short-squeeze potential if price rebounds from these support zones.
Watching the right variables before the Fed’s next move
The analysis points to three variables worth monitoring, in order of priority.
First, the next Fed communication or dot-plot revision, which will confirm or deny the final 2026 hike the median currently signals. Second, the 10-year Treasury yield relative to its 5.041% peak from 15 September, the clearest gauge of gold’s opportunity-cost pressure. Third, crude oil direction, the commodity variable currently keeping yields from extending and giving gold its partial relief.
Underneath all three sits the demand floor. Central bank buying of 244 tonnes in Q1 and the 62% year-over-year rise in Q2 is what the macro headwinds have to work against, not through, and it is why Deutsche Bank’s $3,800 scenario reads as a tail risk rather than a base case.
The gold price outlook for H2 2026 is shaped by the same one-hike-or-many question the current dot-plot poses: a one-and-done scenario reopens the path toward $4,300-$4,500, while a multi-hike cycle brings the $3,700-$3,900 support band into play as the next meaningful test.
The disposition the evidence supports is a late-phase tightening suppression, with historical precedent pointing to medium-term recovery once the hikes conclude. The near-term path hinges on whether the oil-yield buffer holds and whether the Fed’s final hike arrives as signalled.
This article is for informational purposes only and should not be considered financial advice. Investors should conduct their own research and consult with financial professionals before making investment decisions. Past performance does not guarantee future results, and the forward-looking scenarios cited here are speculative and subject to change based on market developments.