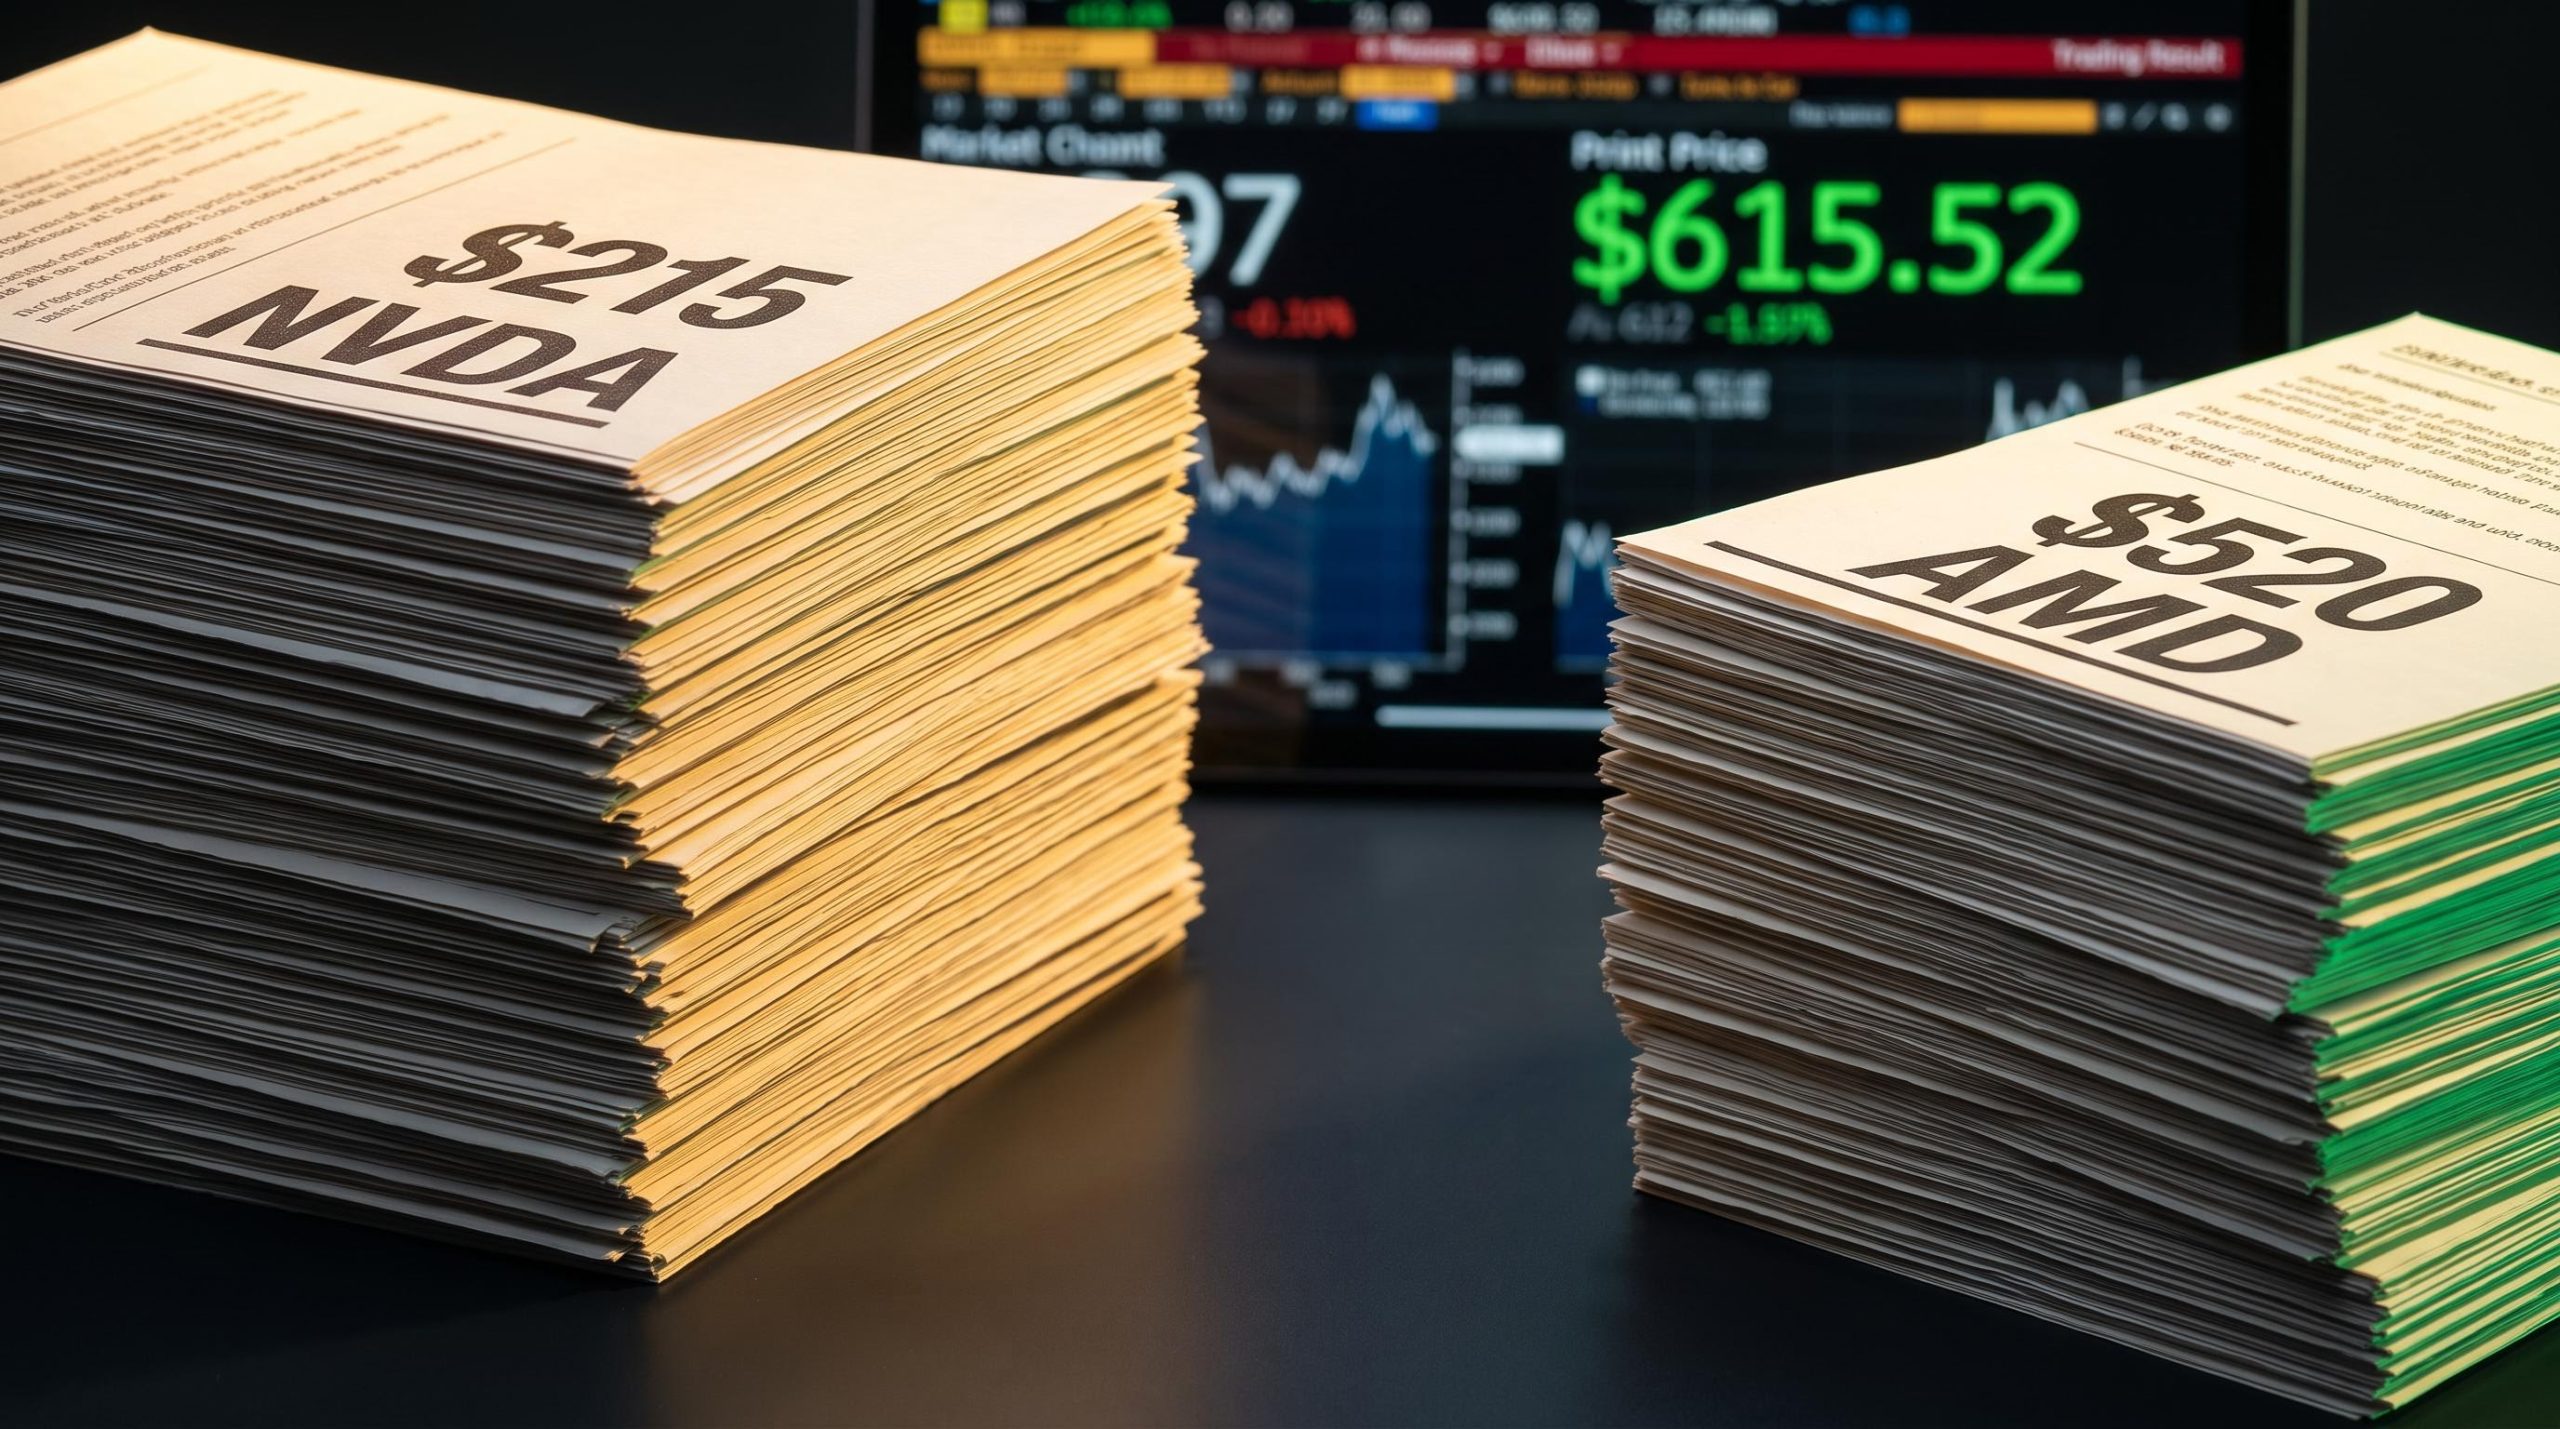
Seventeen days ago, someone spent $4.2 million on AMD call options that expired in eleven days. The stock needed to climb from roughly $515 to a breakeven near $550 for the bet to work at all.
Within two trading sessions, AMD traded up to approximately $615.52. The money was right, and the way the bet was built tells you something about how professional players are reading AI chip names right now.
That trade was one piece of roughly $17 million in call premium deployed across Nvidia and AMD, according to observations from Tasty Live’s Signal Versus Noise segment. Big trades do not always predict correctly. But the structural choices inside these ones (how much capital went where, over what duration, at what strike) reveal how sophisticated players are separating two semiconductor names that a casual observer might treat as one interchangeable AI momentum trade.
After reading this, you will know how to look at a large options print and ask the right questions about what its structure is actually saying, using these Nvidia and AMD positions as a live case study.
How $17 million was split across Nvidia and AMD, and what that split reveals
The single most useful fact about this basket is not the total. It is the split.
The headline allocation Roughly $17 million in call premium, split about 75/25: $12.8 million across three separate Nvidia trades, and $4.2 million in a single AMD trade.
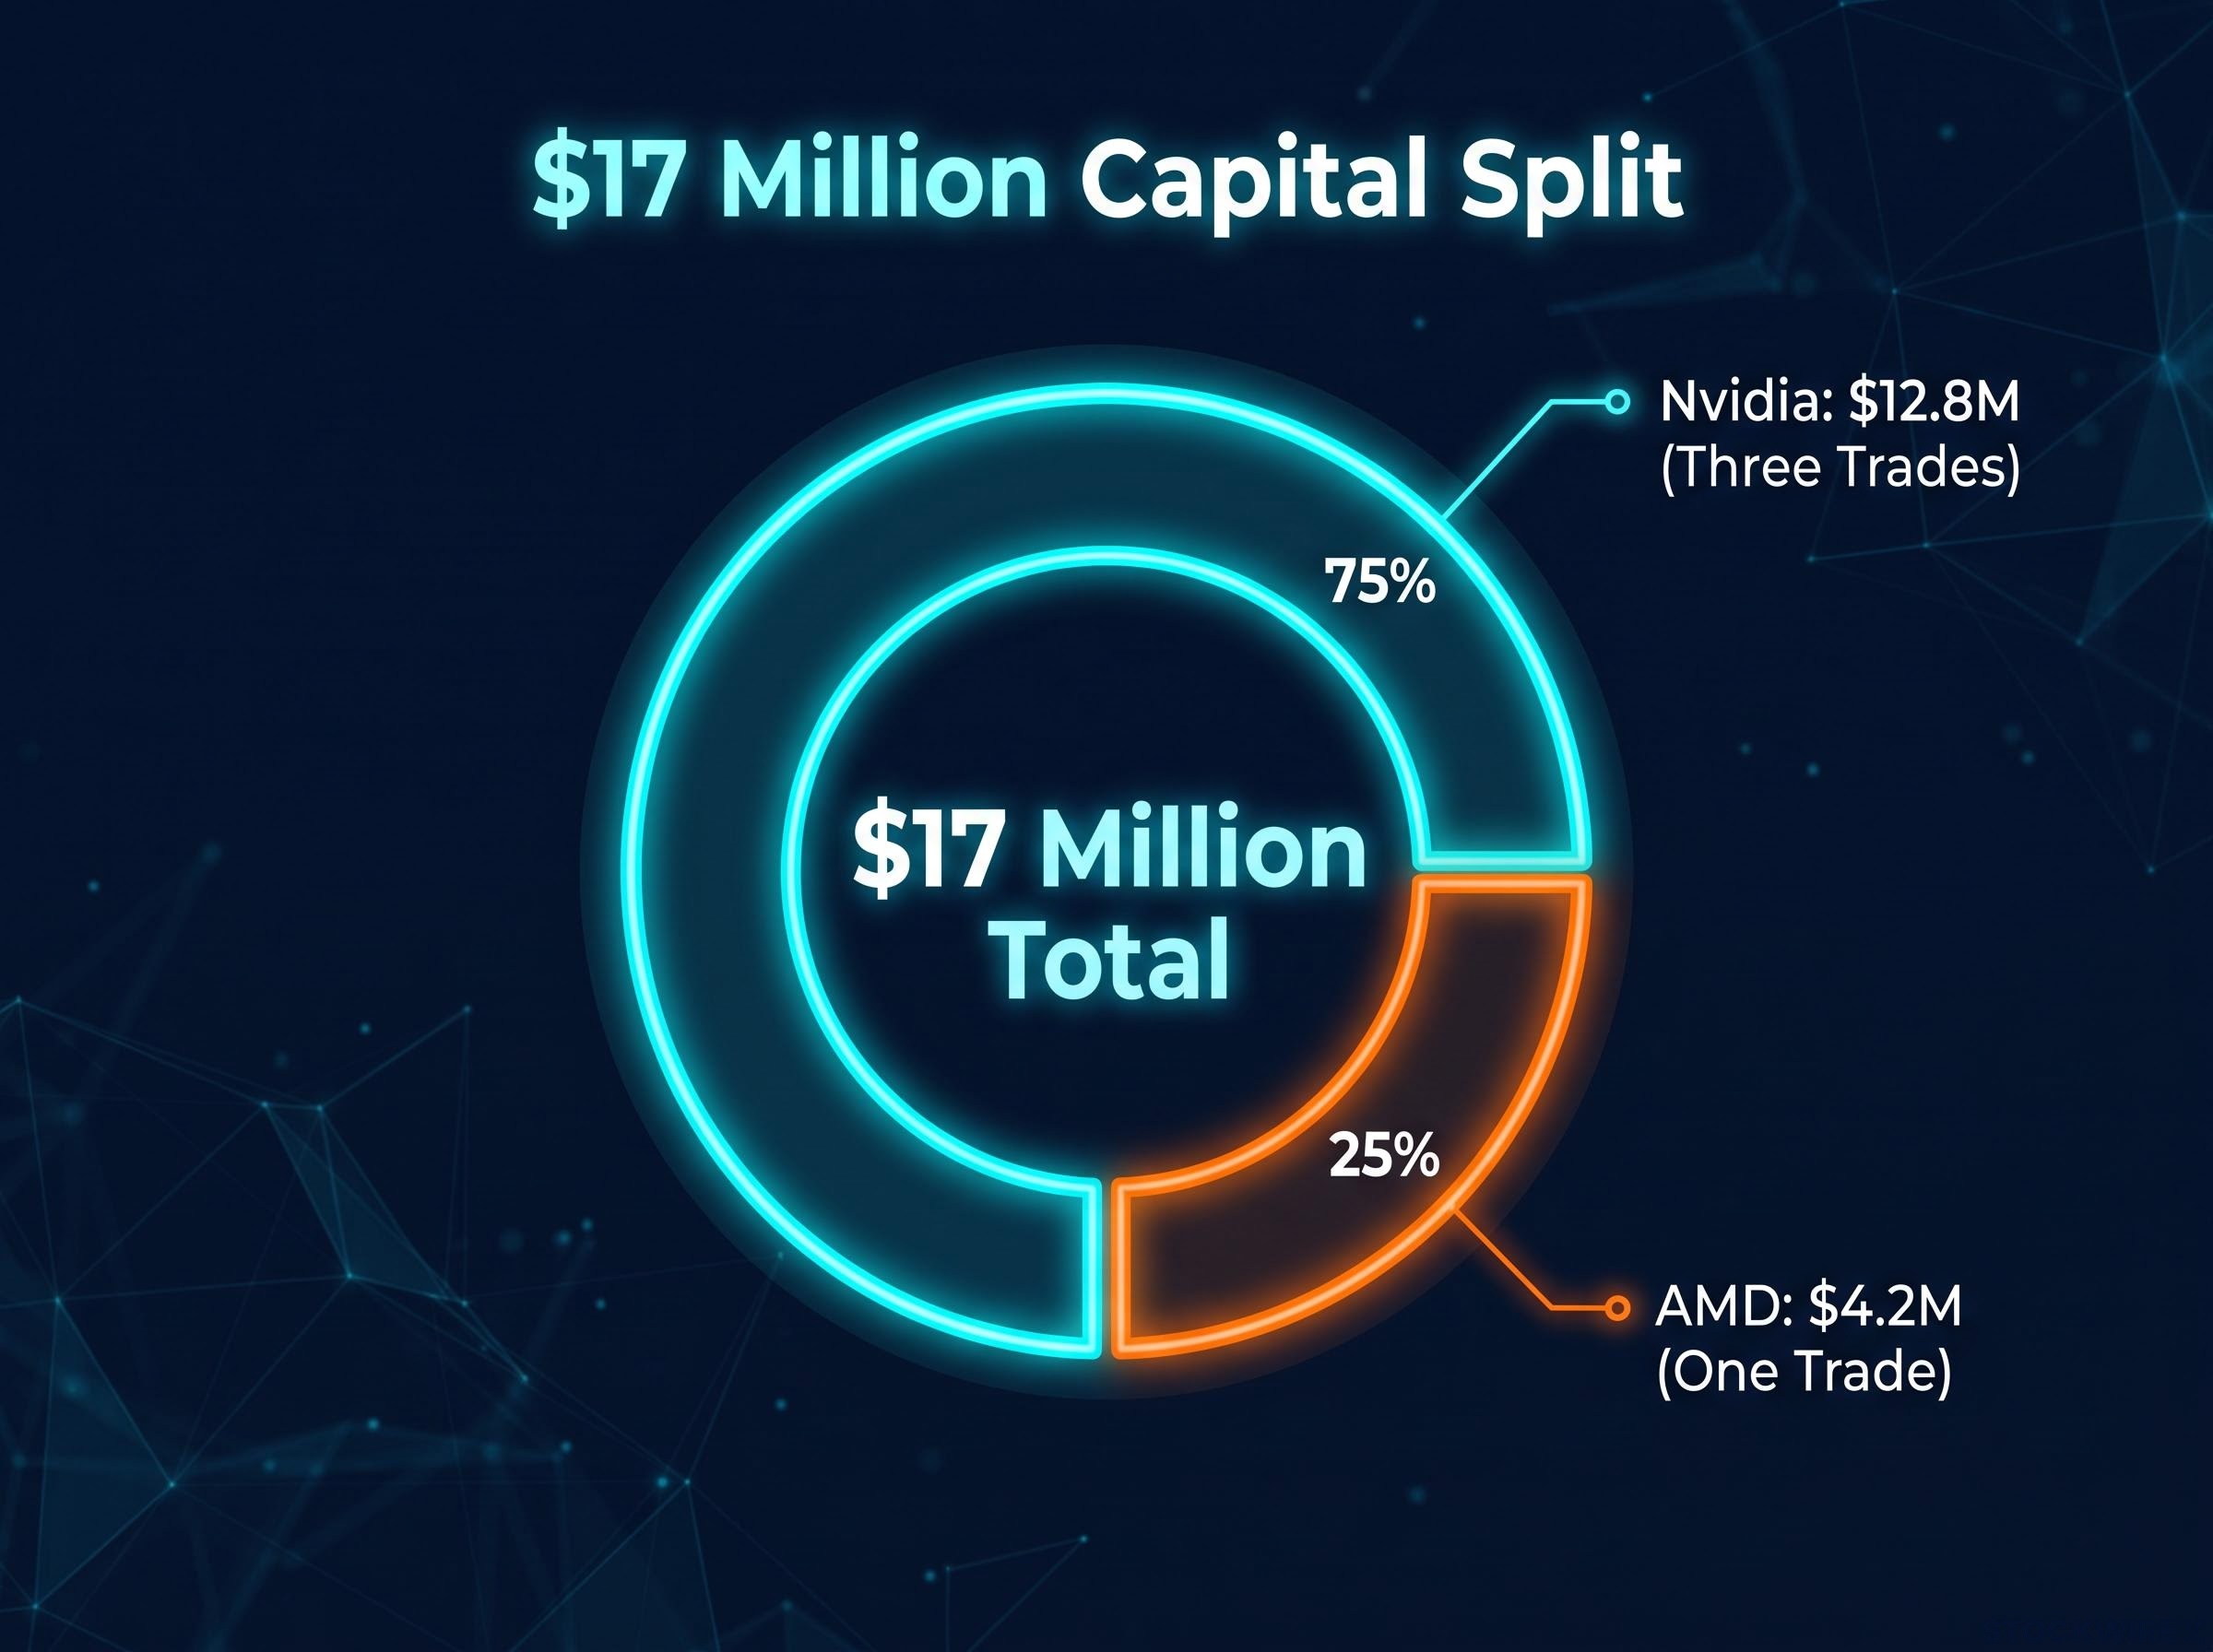
That asymmetry is the puzzle worth solving. Nvidia absorbed three-quarters of the capital through three distinct positions, while AMD got one concentrated bet. And no meaningful put buying accompanied any of it, which confirms the stance here was purely bullish and directional, not a hedge dressed up as conviction.
Here is what makes the split genuinely interesting. AMD had the stronger near-term technical setup at the time, yet it received the smaller slice. Whoever placed these trades chose to anchor the larger capital base in the lower-multiple name and treat the higher-flying stock as the smaller, faster gamble.
| Name | Total Premium | Number of Trades | Strike Type | Duration | Stock at Execution |
|---|---|---|---|---|---|
| Nvidia | $12.8M | Three | Deep ITM to near-the-money | Days to 18 months | $213.56 |
| AMD | $4.2M | One | Near-the-money | ~11 days | $515 |
What this tells you is that the trader was not simply expressing a generic view that AI chips go up. Two different theses are hiding in one basket: Nvidia as the more defensible core, AMD as the high-conviction short-term wager. Those are meaningfully different risk postures, and reading the allocation, not just noting that trades happened, is the first step from signal-reading to noise-chasing.
Semiconductor sector divergence across AI infrastructure, PC client, and handset end-markets is the structural backdrop for both positions: AMD and Nvidia are not interchangeable AI momentum trades but distinct businesses with different revenue compositions, and the options allocation in this basket reflects exactly that distinction.
When big ASX news breaks, our subscribers know first
Inside the three Nvidia trades: stock replacement, medium-term positioning, and a short-dated momentum bet
The three Nvidia trades are not three random bullish bets. Stacked from longest and deepest to shortest and riskiest, they form a coherent risk ladder, all placed near the stock’s then-current price of approximately $213.56 after roughly six weeks of range-bound trading.
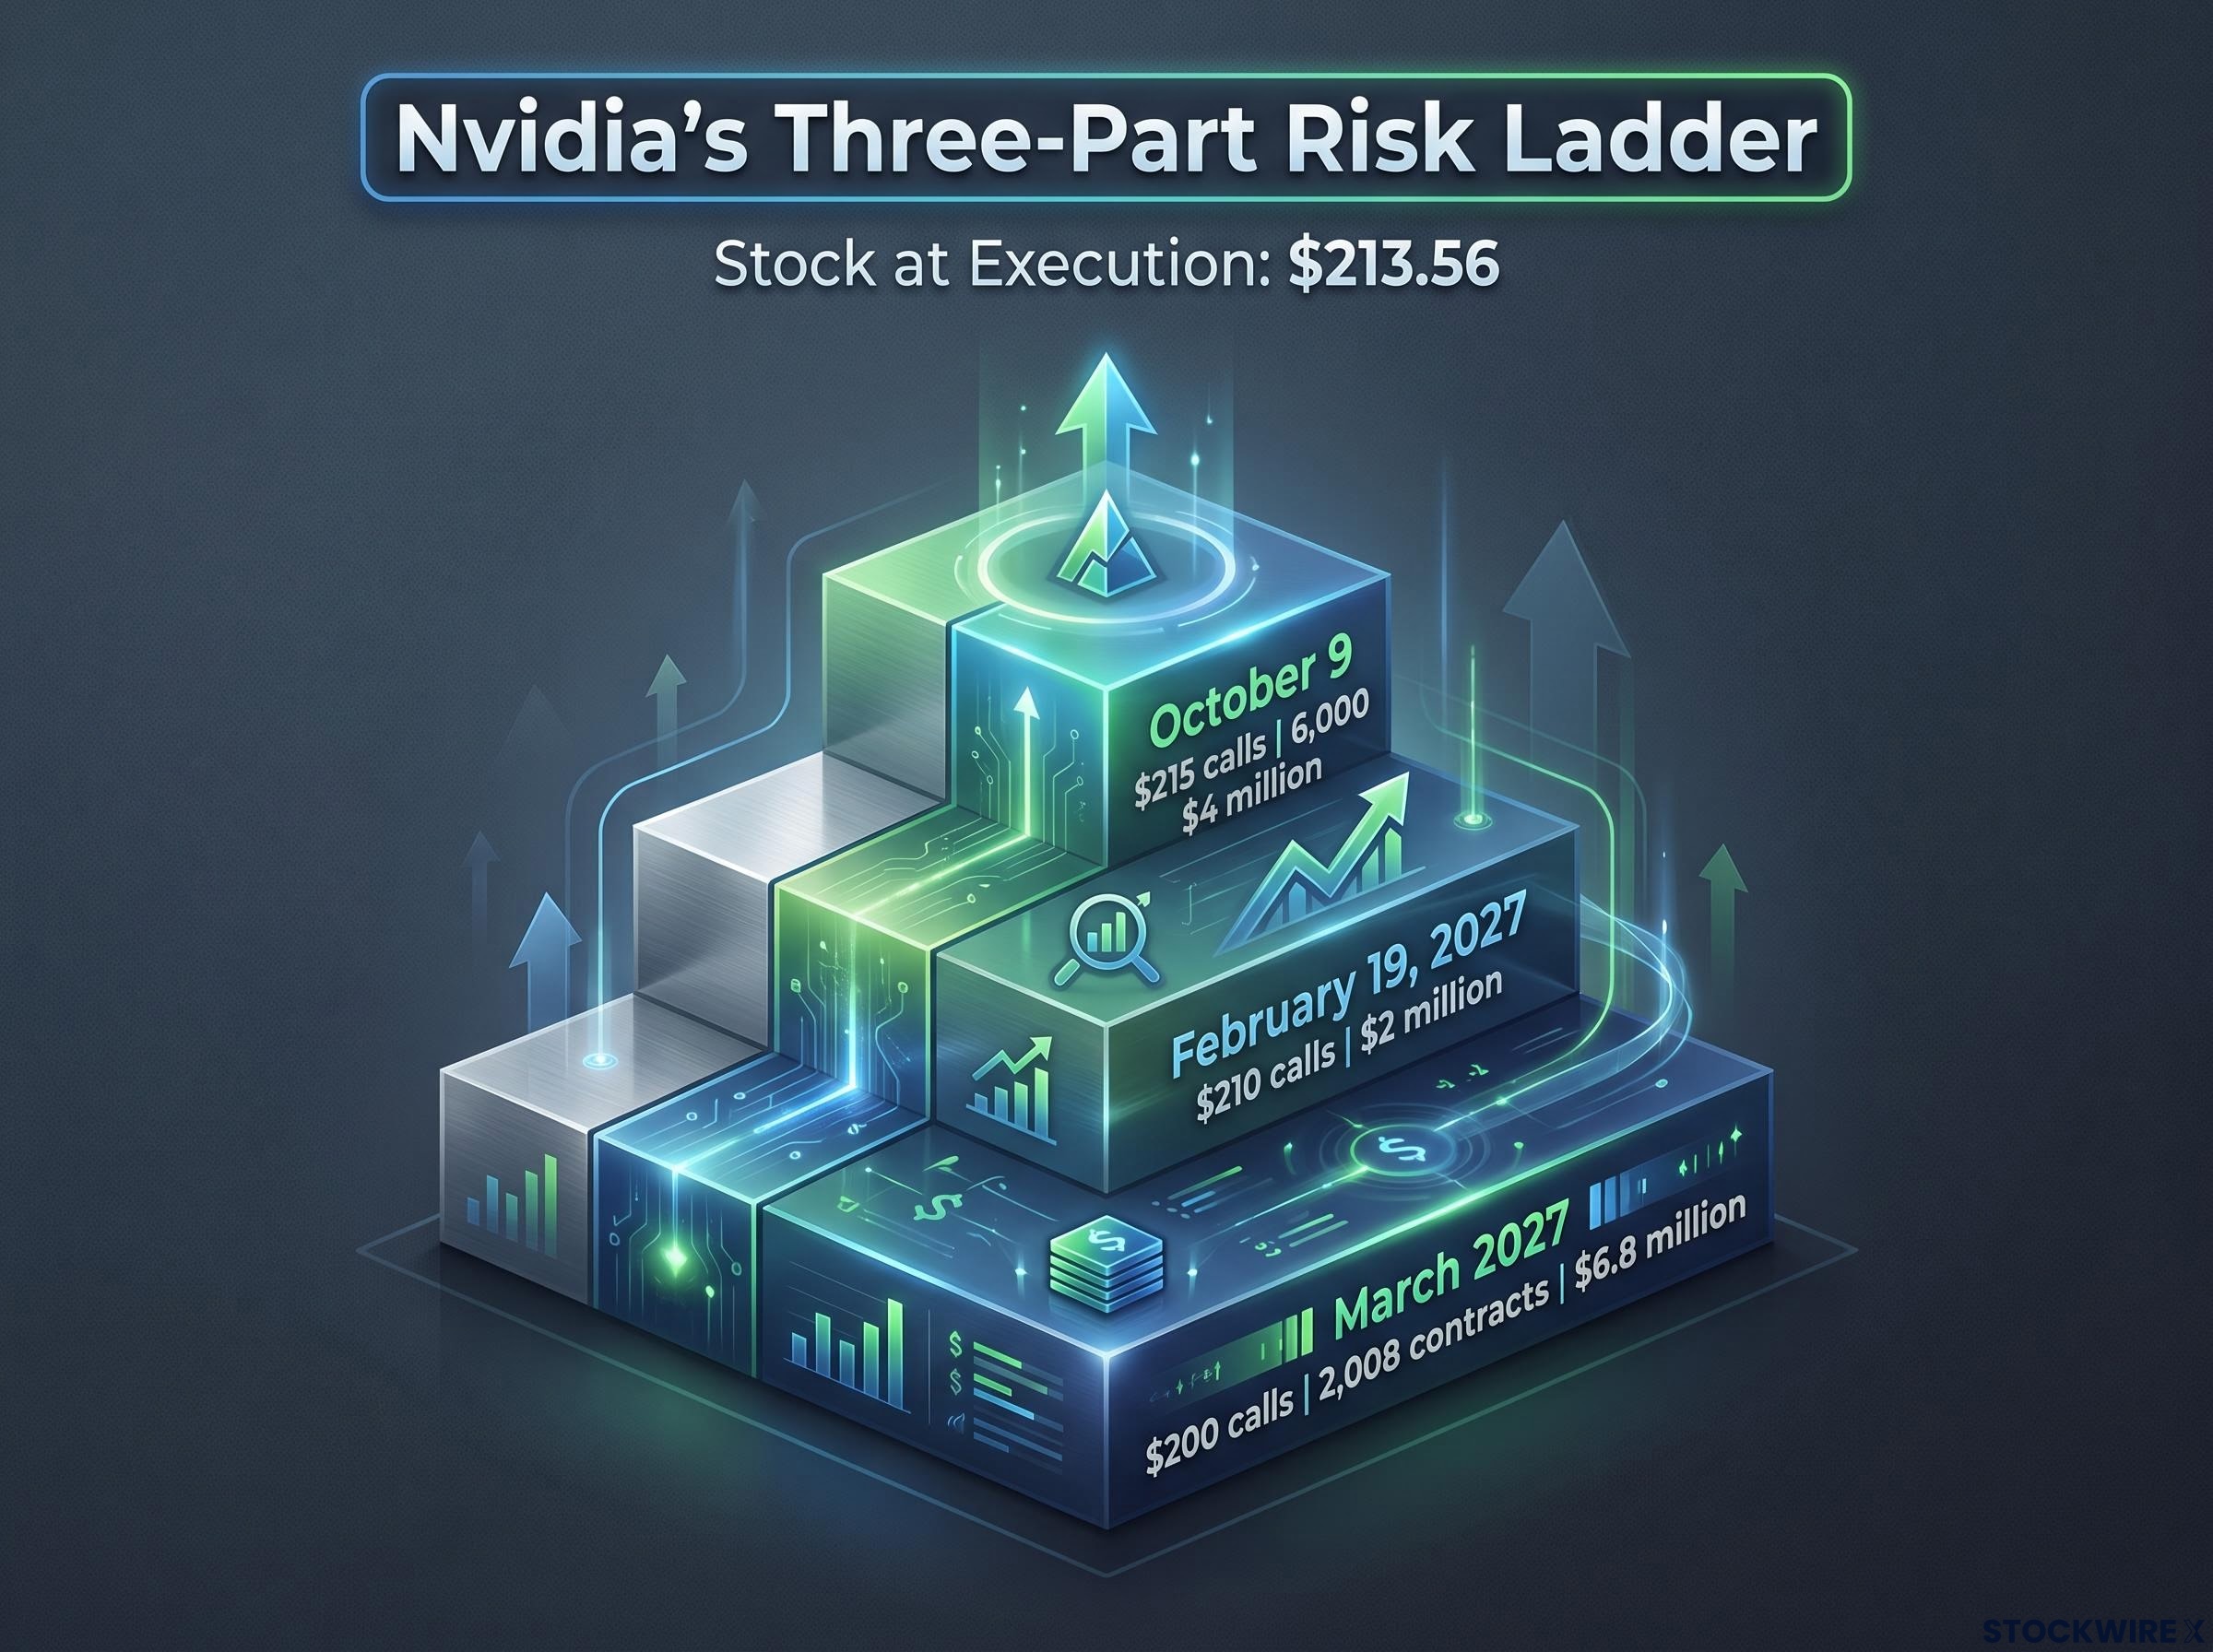
- March 2027 $200 calls. 2,008 contracts, approximately $6.8 million, already in the money at execution. This is the anchor, and it behaves more like leveraged equity than a speculative bet.
- February 19, 2027 $210 calls. Approximately $2 million, around 18 months of runway. A medium-term directional position with plenty of time for the thesis to develop.
- October 9 $215 calls. 6,000 contracts, approximately $4 million, expiring before Nvidia’s next earnings. The short fuse of the group.
The March 2027 position deserves the “stock replacement” label. Because the strike sat below the share price, the option carried a delta approaching 1, meaning its price moves almost one-for-one with the stock. The buyer gets near-stock exposure for a fraction of the notional cash, with maximum loss capped at the premium paid. That is a fundamentally different animal from a lottery ticket.
Where does Nvidia’s valuation sit against all this? The Tasty Live segment cited a forward price-to-earnings ratio (a measure of how much investors pay per dollar of expected future earnings) of roughly 14.8x at execution. Subsequent September 2026 sources report a range of 18.45x to 26x, but on any of those figures, this is not a stretched multiple for the category.
The pre-earnings deadline: why the short-dated trade stands apart
The October 9 trade has a structural problem the other two do not. Nvidia’s next scheduled earnings release falls on 17 November, after the calls expire.
That means this position cannot ride an earnings pop. To pay off, it needs the stock to keep climbing on sentiment or technical momentum alone, with no scheduled catalyst to do the heavy lifting.
For you as a reader of flow, that detail reframes the trade entirely. Betting on independent near-term price continuation is a much harder ask than positioning for a known earnings event, which marks this as the highest-conviction, highest-risk of the three Nvidia positions rather than a routine event play.
The AMD trade paid off: what a $4.2 million eleven-day bet looked like, and how it played out
Now the AMD side, and the structure matters before the outcome does.
The trade was 2,000 contracts of the October 2 $520 calls, a $4.2 million block, with AMD trading near $515. Breakeven sat around $550, and expiry was roughly eleven days out. That is a short-fuse, near-the-money directional wager with almost no time value to spare.
The outcome AMD advanced to approximately $615.52 within two trading sessions, a move of roughly $100 per share that cleared the $550 breakeven by a wide margin.
Spectacular result. But do not confuse the payoff with the risk. An eleven-day call with a $35 gap to breakeven, on one of the most richly valued names in the sector, was a high-probability-of-loss bet that happened to land.
The valuation backdrop sharpens that point. Here is where AMD stood around the trade:
- Trailing P/E: approximately 194x per the Tasty Live segment, later reported at 232.3x by VCPSCanner on 22 September 2026.
- Forward P/E: in the range of 67.7x to 80.7x across September 2026 sources.
- Consensus 12-month targets: from $565 (MarketBeat) up to $654.63 (Ultra Stock Analysis Pro).
- Analyst sentiment: roughly 80% of covering analysts rated the stock bullish as of 10 September 2026.
What this means for you is a discipline point. This is compressed-time options leverage working exactly as intended, but the same structure on the same stock a week earlier or later could have expired worthless. Treat it as a case study in the trade-off, not a template to copy.
Reading the options tape: what the mechanics of stock replacement and unusual flow actually tell you
To evaluate any of these trades honestly, you need two things: how the instrument works, and why confident conclusions from public tape always carry an asterisk.
How stock replacement actually works
Return to the March 2027 Nvidia position. Options educators at bodies such as Cboe and the Options Industry Council have long described deep-in-the-money, long-dated calls as “stock replacement” vehicles, and the logic is straightforward.
A deep-ITM call with a delta near 1 tracks the underlying almost one-for-one. You get stock-like exposure while posting only the premium rather than the full share value, which frees capital and builds in leverage. Your maximum loss is fixed at the premium, no matter how far the stock falls.
That is genuinely useful, but not free. Even long-dated calls carry time decay and volatility risk, convey no voting rights, and only reflect dividends indirectly through pricing.
What public tape data can and cannot tell you
Here is the harder part. A big call block can mean several different things, and the tape rarely tells you which.
The same interpretive discipline applies to any ticker: options chain analysis of call-to-put premium ratios, implied move brackets, and far-OTM crowding gives readers the same informational inputs professionals use to calibrate whether a large print reflects directional conviction or something more ambiguous.
- Directional conviction: a genuine bullish bet on AI demand or an upcoming catalyst.
- Hedging or overlay: a covered-call income programme, a collar, or a dealer hedging a structured product. The net stance can be risk-reducing, not bullish.
- Mandate or tax substitution: replacing stock with deep-ITM calls to manage capital gains timing or work within a fund’s constraints on shorting and margin.
Public data compounds the ambiguity. It typically will not tell you whether a trade opened or closed a position, whether it is one leg of a larger spread, or whether an off-exchange stock hedge sits alongside it. Even the bid-versus-ask signal that scanners use to infer buying can be unreliable in fast markets.
The single most important discipline, then, is to treat every large print as a hypothesis to investigate rather than a signal to follow. Use unusual flow as a starting question, then hunt for the context that confirms or kills it.
Why the capital split reflects a valuation call, not just a directional bet
Put the mechanics and the numbers together, and the allocation stops looking arbitrary.
Look at where the two names sat on valuation at the time of the trades.
| Metric | Nvidia | AMD |
|---|---|---|
| Forward P/E | 18.45x-26x | 67.7x-80.7x |
| Trailing P/E | ~27.6x | 194x-232.3x |
| PEG ratio | 0.59 | Not comparable |
| Consensus target | ~$328-$334 | $565-$654 |
| Consensus rating | Strong Buy | Moderate to Strong Buy |
| Options capital | $12.8M | $4.2M |
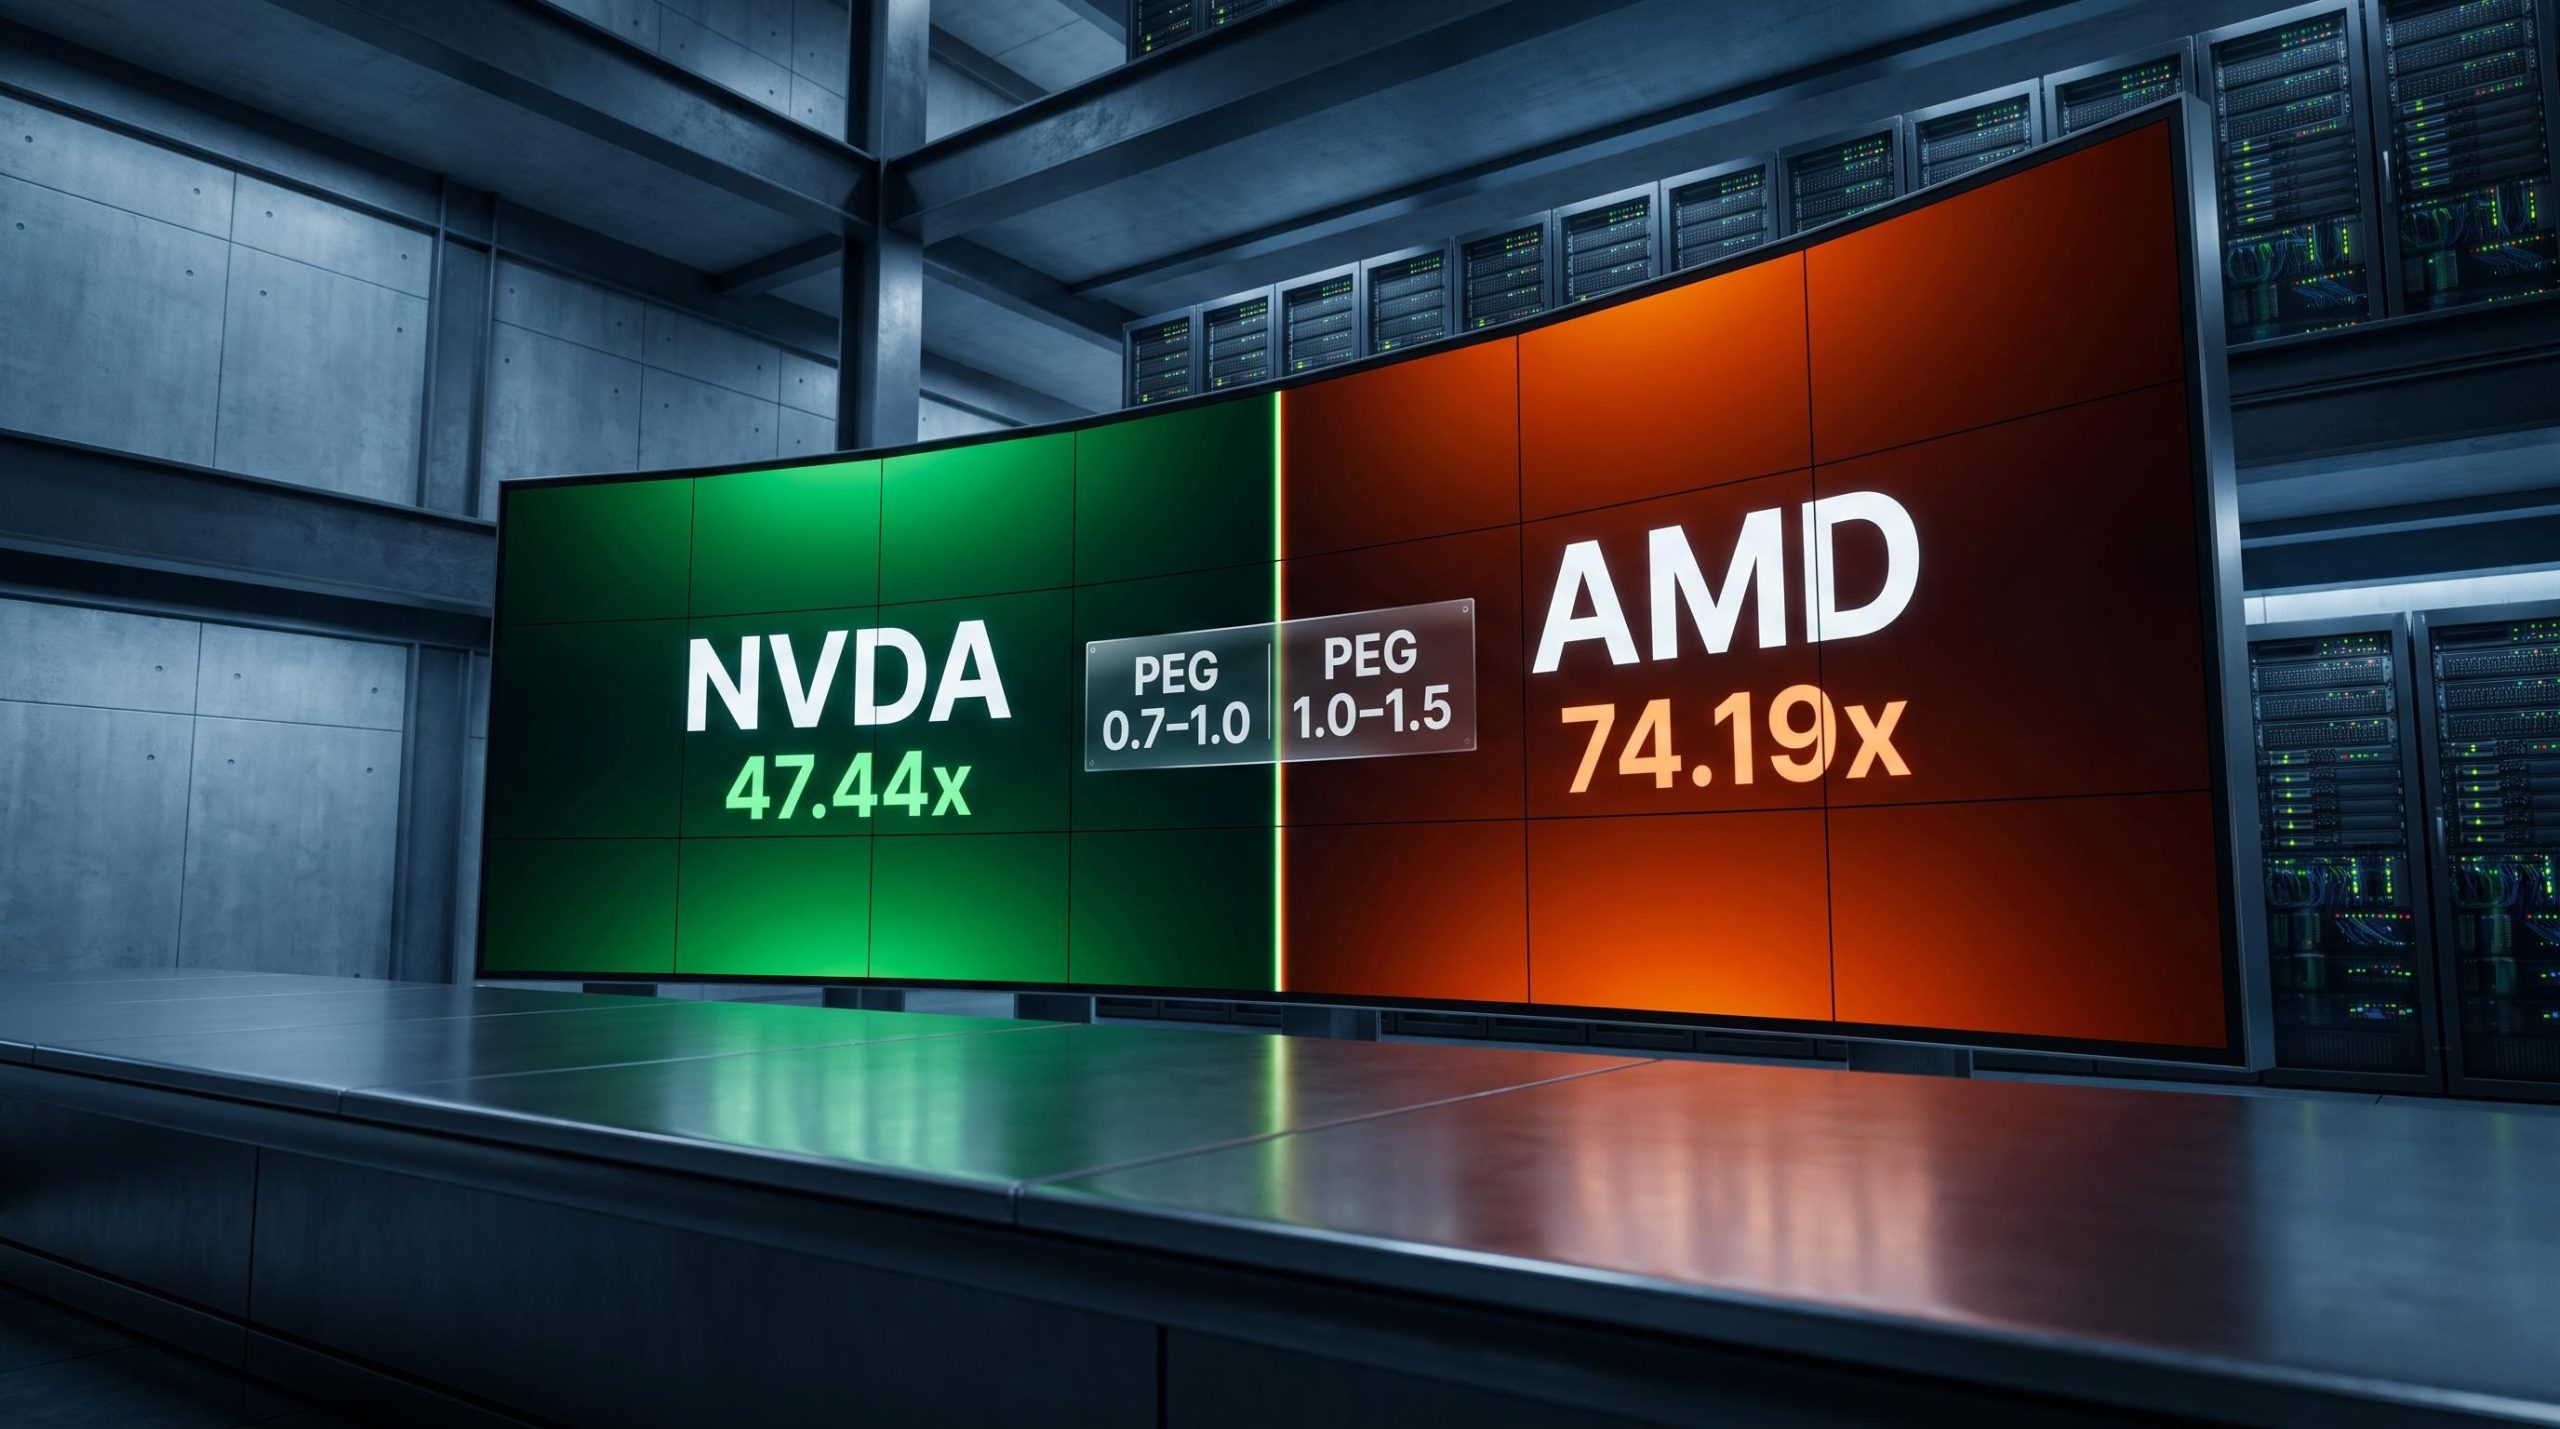
The valuation gap in one line Nvidia carried a PEG ratio (its P/E divided by its growth rate, where under 1.0 suggests earnings growth outpaces the price) of 0.59, while AMD’s forward P/E sat above 67x.
Nvidia’s consensus 12-month targets of roughly $328 to $334 implied around 47% upside from then-current prices, on a Strong Buy consensus. AMD’s targets sat above the stock but on far richer multiples, backed partly by a roughly 6,800% share-price appreciation over its longer growth run.
Nvidia’s competitive position in AI accelerators, which includes an estimated 80-85% share of the discrete GPU market and a data center revenue base that surged roughly 1,600% between early 2023 and Q1 FY2027, is the fundamental context that makes a PEG ratio of 0.59 less counterintuitive than it first appears.
Now map that onto the trade structure. Larger premium, longer duration, deeper-ITM strikes in Nvidia; smaller premium, shorter duration, near-the-money strike in AMD.
That pattern lines up with treating Nvidia as the valuation-supported core and AMD as a tactical bet. And because AMD had the stronger near-term chart, concentrating the bigger capital base in Nvidia was a deliberate, counter-intuitive choice, which only reinforces the valuation read.
What this tells you is that the trader was willing to pay a growth premium for AMD but wanted the larger position anchored in the name with more earnings visibility and a more defensible multiple. That is a risk-management judgment as much as a directional one.
What these trades tell you now, and where the theses can break down
Strip the basket to its shape and you get a three-part structure: a long-dated, valuation-supported Nvidia core; an intermediate Nvidia position; and a short-dated AMD tactical bet that has already delivered, clearing its $550 breakeven on the way to roughly $615.52.
The remaining Nvidia positions still have to prove themselves, and each has a specific way it can fail.
- The October 9 $215 calls need near-term technical continuation with no earnings catalyst before the 17 November release, the hardest ask in the basket.
- The February and March 2027 calls have real runway but depend on AI infrastructure spending holding its trajectory and Nvidia’s earnings estimates continuing to track upward, with consensus still implying roughly 47% upside from mid-September prices.
Two conditions could undermine both names at once:
For investors wanting to quantify how durable the demand backdrop behind both positions actually is, our full explainer on hyperscaler AI capex trends covers the $725 billion combined 2026 commitment and the specific revenue-to-capex ratios that will determine whether infrastructure spending holds into 2027.
- A downward revision to AI infrastructure spending expectations.
- A broader de-rating across the semiconductor sector that compresses multiples regardless of company-level performance.
The portable habit here is simple. When you meet the next large unusual options print, ask about its structure (duration, strike placement, capital concentration) before you react to its size, because the structure of a trade is often more informative than its dollar figure, and most flow-scanning services will not do that interpretive work for you.
This article is for informational purposes only and should not be considered financial advice. Investors should conduct their own research and consult with financial professionals before making investment decisions.
Past performance does not guarantee future results. Financial projections are subject to market conditions and various risk factors. These statements are speculative and subject to change based on market developments and company performance.