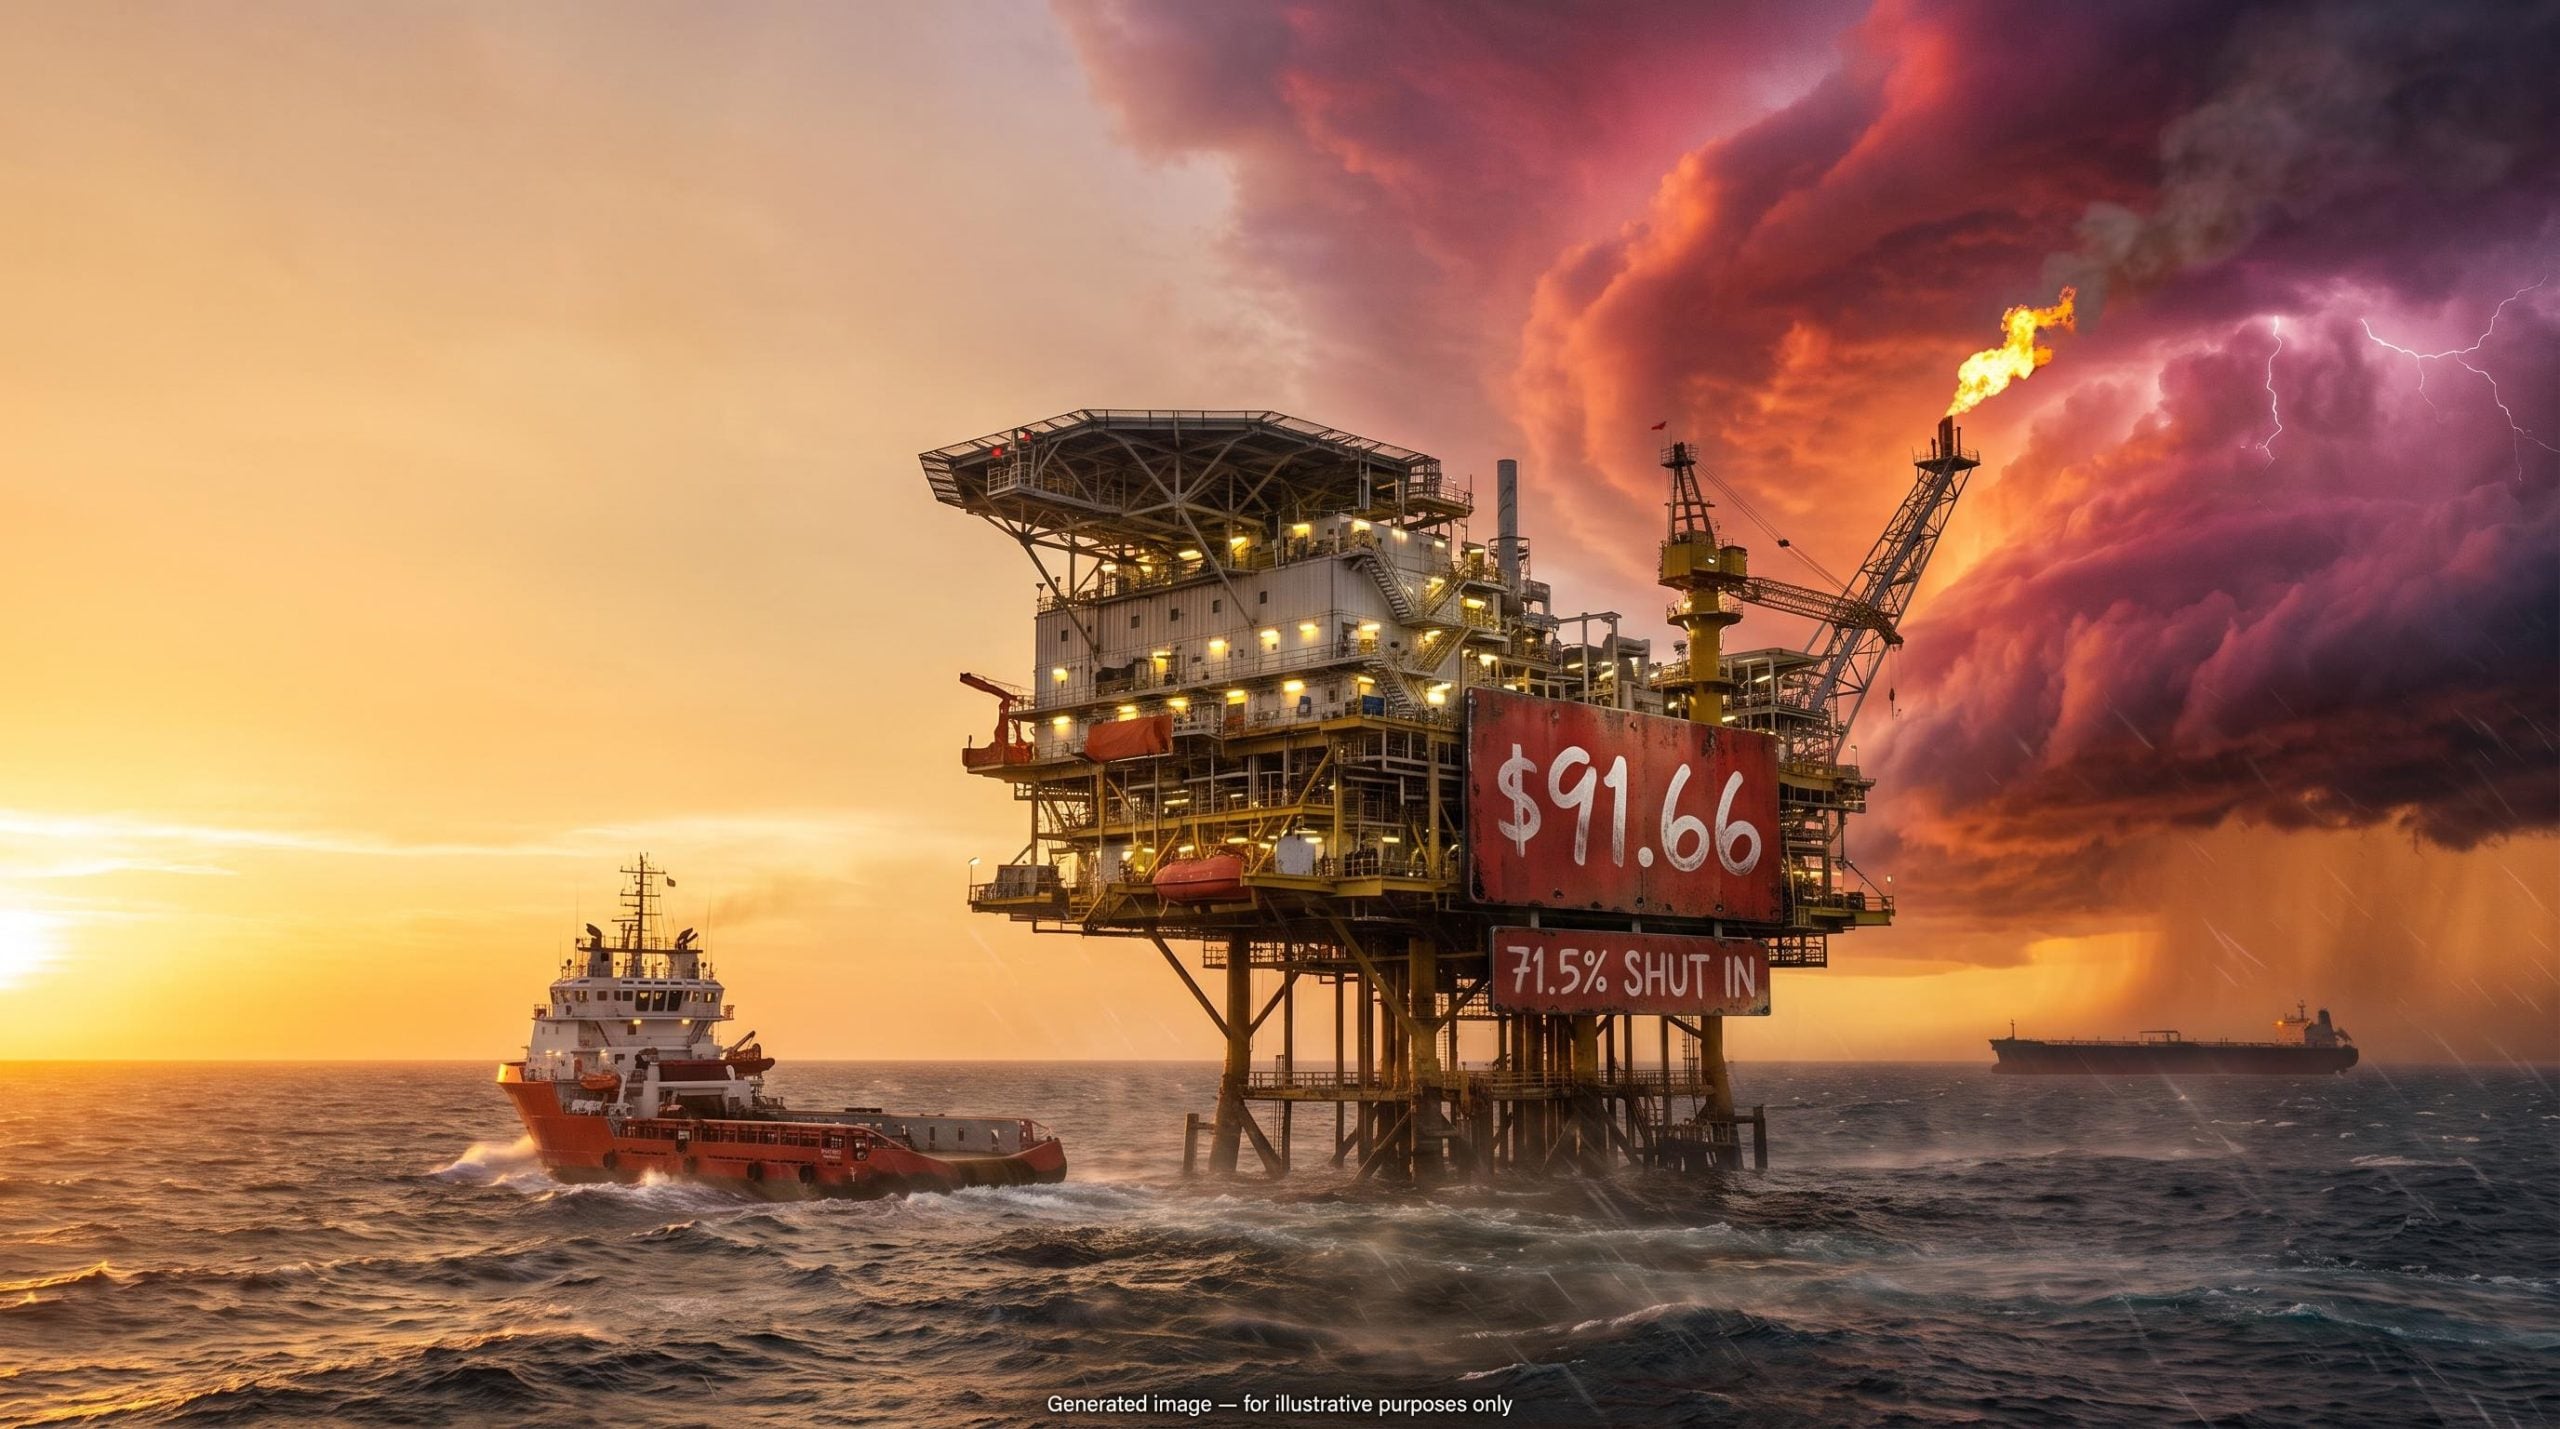
West Texas Intermediate (WTI) crude oil traded near $91.66 a barrel on Friday 10 October 2026, almost exactly where it sat the day before. In the space of 48 hours, the market absorbed a presidential pledge not to strike Iran, a threat from Iran’s Islamic Revolutionary Guard Corps (IRGC) to pursue ships beyond the Strait of Hormuz, a reported tanker fire, and the shut-in of more than 70% of Gulf of Mexico oil output.
A flat price after a week like that does not mean nothing happened. It means several large forces are pulling in opposite directions with roughly equal strength.
The market is weighing a falling probability of a US strike against an unresolved Hormuz closure and real, measurable supply losses. Whether you trade oil, hold energy stocks or simply watch fuel costs, that balance is what decides the next move.
Here is how to read it: which forces are holding the price up, which are capping it, and which dates and data releases are most likely to break the stalemate.
Why is the WTI crude oil price flat when the headlines are so loud?
The contradiction resolves once you line the events up in order. WTI settled at roughly $91.66-$91.85 on 9 October, then barely moved on Friday. FXStreet analyst Vishal Chaturvedi described the benchmark as nearly flat because easing fears of an imminent US strike were offset by continuing threats to supply through Hormuz.
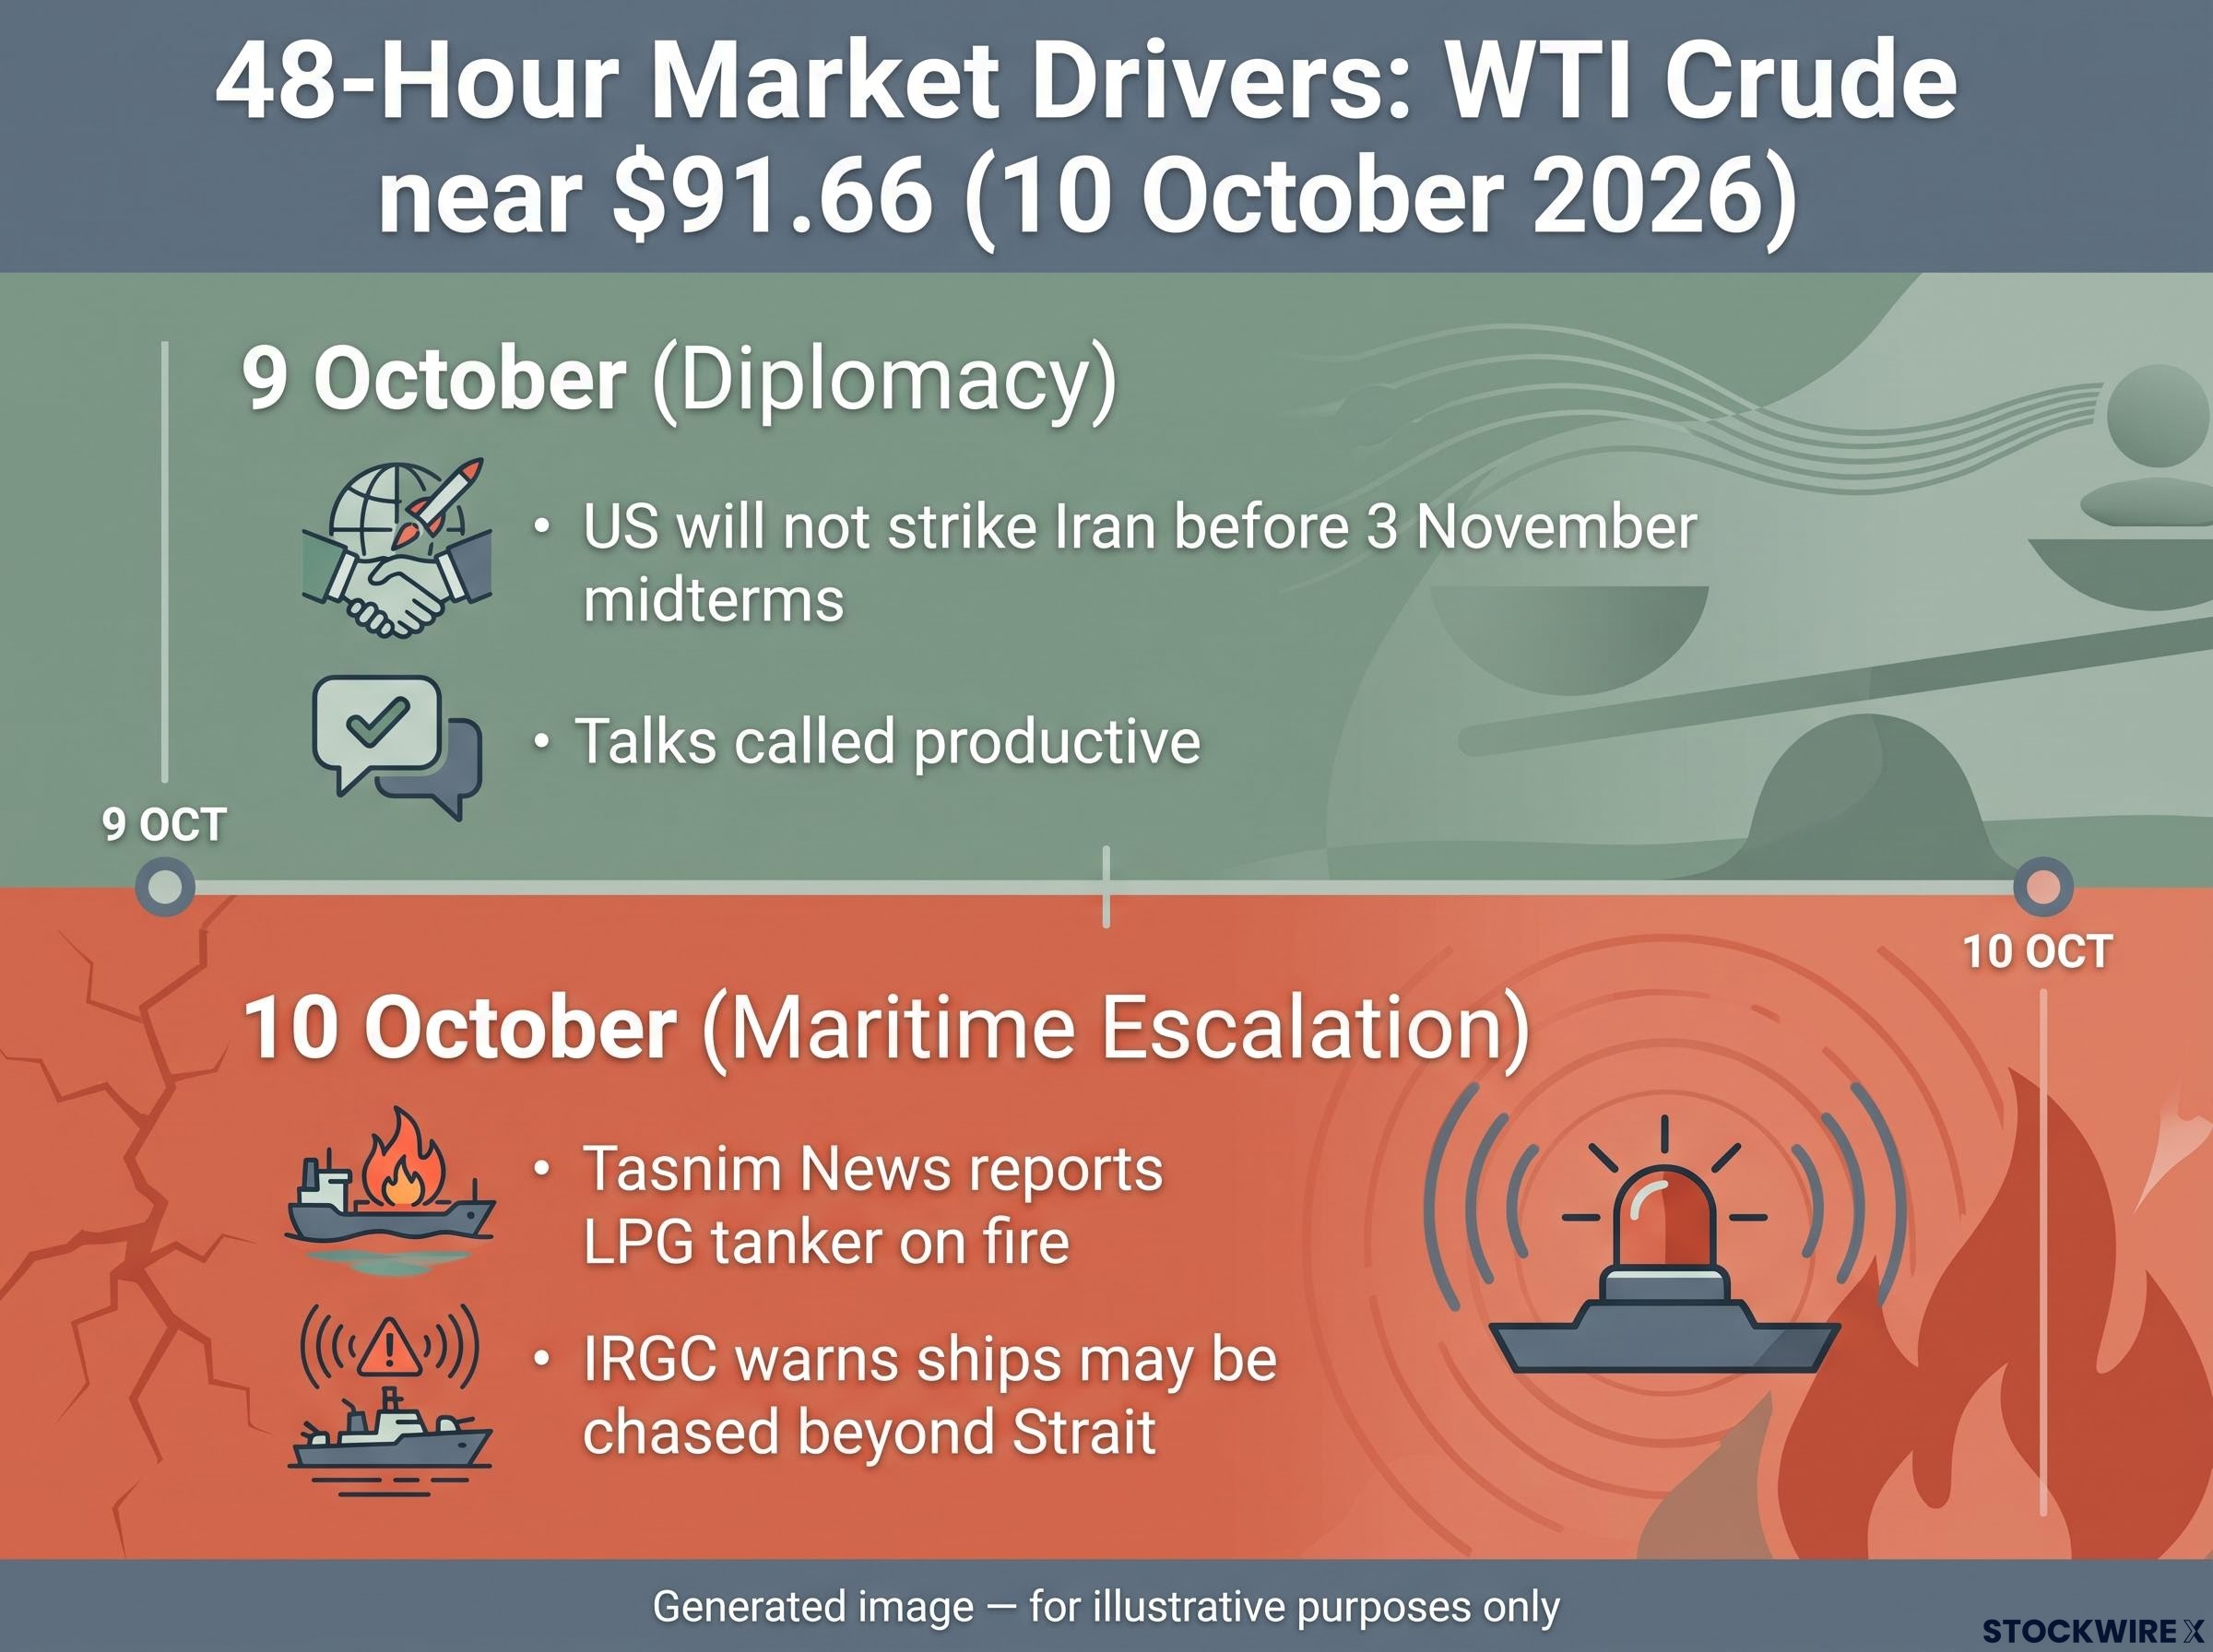
- 9 October: President Trump posts on Truth Social that the US will not strike Iran before the 3 November midterm elections; oil eases.
- 9 October: Trump calls talks with Iran productive and repeats that Iran will not be allowed a nuclear weapon.
- 10 October: Tasnim News reports a large liquefied petroleum gas (LPG) tanker struck and on fire.
- 10 October: The IRGC warns that ships using routes it deems unauthorised may be chased beyond the Strait.
The diplomatic stalemate
Trump’s pledge removed the most immediate tail risk, the scenario of a sudden US military strike. But the talks themselves show little convergence.
Two readings of the same negotiation Trump describes the talks as productive. A senior Iranian official insists Tehran will keep its right to enrich uranium, and argues that the American proposals clash with what Iran is demanding.
Vice President JD Vance told Reuters earlier in the week that Iran must substantially curb its enrichment capacity to end the war. Iran, meanwhile, says Hormuz stays closed until its conditions are met. The pledge may also be read as politically timed, which caps the relief it offers: it covers the weeks before the vote, not the period after it.
The maritime escalation
The second force arrived on Friday. The IRGC warning and the tanker report both come from the IRGC and Iranian-linked media, and the IRGC blamed the US for rising maritime tension.
Those claims are unverified by independent sources, yet they still matter because shipowners and insurers price the threat, not just the confirmed damage.
What this tells you is that the market has not decided which story wins. Treat the current level as a balance point that a single headline can tip quickly in either direction.
When big ASX news breaks, our subscribers know first
How do Hormuz risks reach WTI, a landlocked US benchmark?
Hormuz is a Gulf chokepoint, while WTI is a US inland crude. So why should one move the other?
WTI is one of three major oil benchmarks, alongside Brent and Dubai. It is a light, sweet crude, meaning it has low density and low sulphur content, which makes it easier to refine. It is produced in the US and priced through the storage hub at Cushing, Oklahoma.
The link to the Gulf runs through a chain:
- A closure hits seaborne exports from Saudi Arabia, Iraq, Kuwait, Qatar, the UAE and Iran first.
- Brent, Dubai and Oman benchmarks, which price that seaborne trade, react most directly.
- Refiners that lose Gulf barrels look for substitutes, and arbitrage (buying where crude is cheaper and shipping it where it is dearer) pulls WTI higher.
- In severe disruptions, Brent usually widens its premium over WTI, because the shock sits closer to Brent’s market.
Hormuz is not the only driver. The table below sets out how the main forces tend to act on WTI.
| Driver | Direction of effect | Mechanism | Speed | Typical impact on WTI vs Brent |
|---|---|---|---|---|
| Hormuz closure risk | Upward | Loss of Gulf seaborne exports | Fast, headline-driven | Brent reacts more; spread widens |
| Stronger US dollar | Downward | Dampens demand, caps risk premiums | Gradual | Broadly similar |
| Inventory levels | Either | Low stocks magnify shocks; ample stocks absorb them | Weekly, via data releases | US stocks bear more on WTI |
| Gulf of Mexico hurricanes | Upward, short term | Temporary US output shut-ins | Fast, reversible | WTI more directly |
Inventories are tracked through two weekly releases: the American Petroleum Institute (API) on Tuesdays and the Energy Information Administration (EIA) the following day. Their figures land within 1% of one another in roughly 75% of readings, though the EIA’s status as a government body gives its numbers the stronger reputation for reliability. No verified recent API, EIA or Cushing figures were available for this analysis, so check the latest release before drawing conclusions.
The weekly API and EIA releases matter most when the headline draw is compared with consensus and with concurrent gasoline and SPR moves, since the surprise, not the absolute number, tends to move WTI.
Bypass routes and their limits
Three pipelines can move some Gulf crude around Hormuz: Saudi Arabia’s East-West line to Yanbu on the Red Sea, the UAE’s route from Abu Dhabi to Fujairah on the Gulf of Oman, and Iraq’s link to Ceyhan in Turkey. None can replace full Hormuz flows; they cap how far a risk premium can run rather than removing it.
If you hold or follow WTI, watch the Brent-WTI spread as closely as the headline price. A widening spread tells you the market is pricing a Gulf-specific shock; a narrow one points to a broader repricing.
What is physically happening to supply: Gulf storms, Saudi exports and Houthi fighting?
Diplomacy sets the tail risk. Physical supply sets the near-term balance, and here the clearest numbers come from the US side.
Hurricane Isaias escalated fast across three days of official Marine Minerals Administration (MMA) and Bureau of Safety and Environmental Enforcement (BSEE) data.
| Date | Oil shut in (%) | Oil shut in (bpd) | Gas shut in (%) | Platforms evacuated |
|---|---|---|---|---|
| 7 October | 25.1% | 511,619 | 16.4% | n/a |
| 8 October | 62.9% | about 1.28 million | 57.4% | n/a |
| 9 October (11:00 a.m. CDT) | 71.5% | 1,458,814 | 58.8% | 129 of 371 (34.8%) |
The latest reading 71.51% of Gulf of Mexico oil production, or 1,458,814 barrels per day (bpd), was shut in as of 9 October.
Some 9 October coverage still cited the earlier 1.28 million bpd figure, which reflects an older cut-off. Total lost output from Isaias is estimated at about 7.2 million barrels, close to the 7.1 million lost to Tropical Storm Bertha in July 2026.
The Gulf side of the ledger is far murkier. Saudi Arabia is said to be leading a rebound in shipments from the region, helped by the resumption of flows through its East-West pipeline. No dated volume figures were found, so the size of that recovery remains unknown.
Renewed Saudi-Houthi fighting keeps infrastructure risk elevated. That threat works mainly through freight costs, insurance and rerouting around the Cape of Good Hope, which tends to support Brent more than WTI.
Shut-ins reverse once platforms restart. Read Isaias as a short-term tightening of US supply and a possible inventory draw, not a lasting shift in the oil balance.
What could break the stalemate, and what would limit the move?
The OPEC+ brake
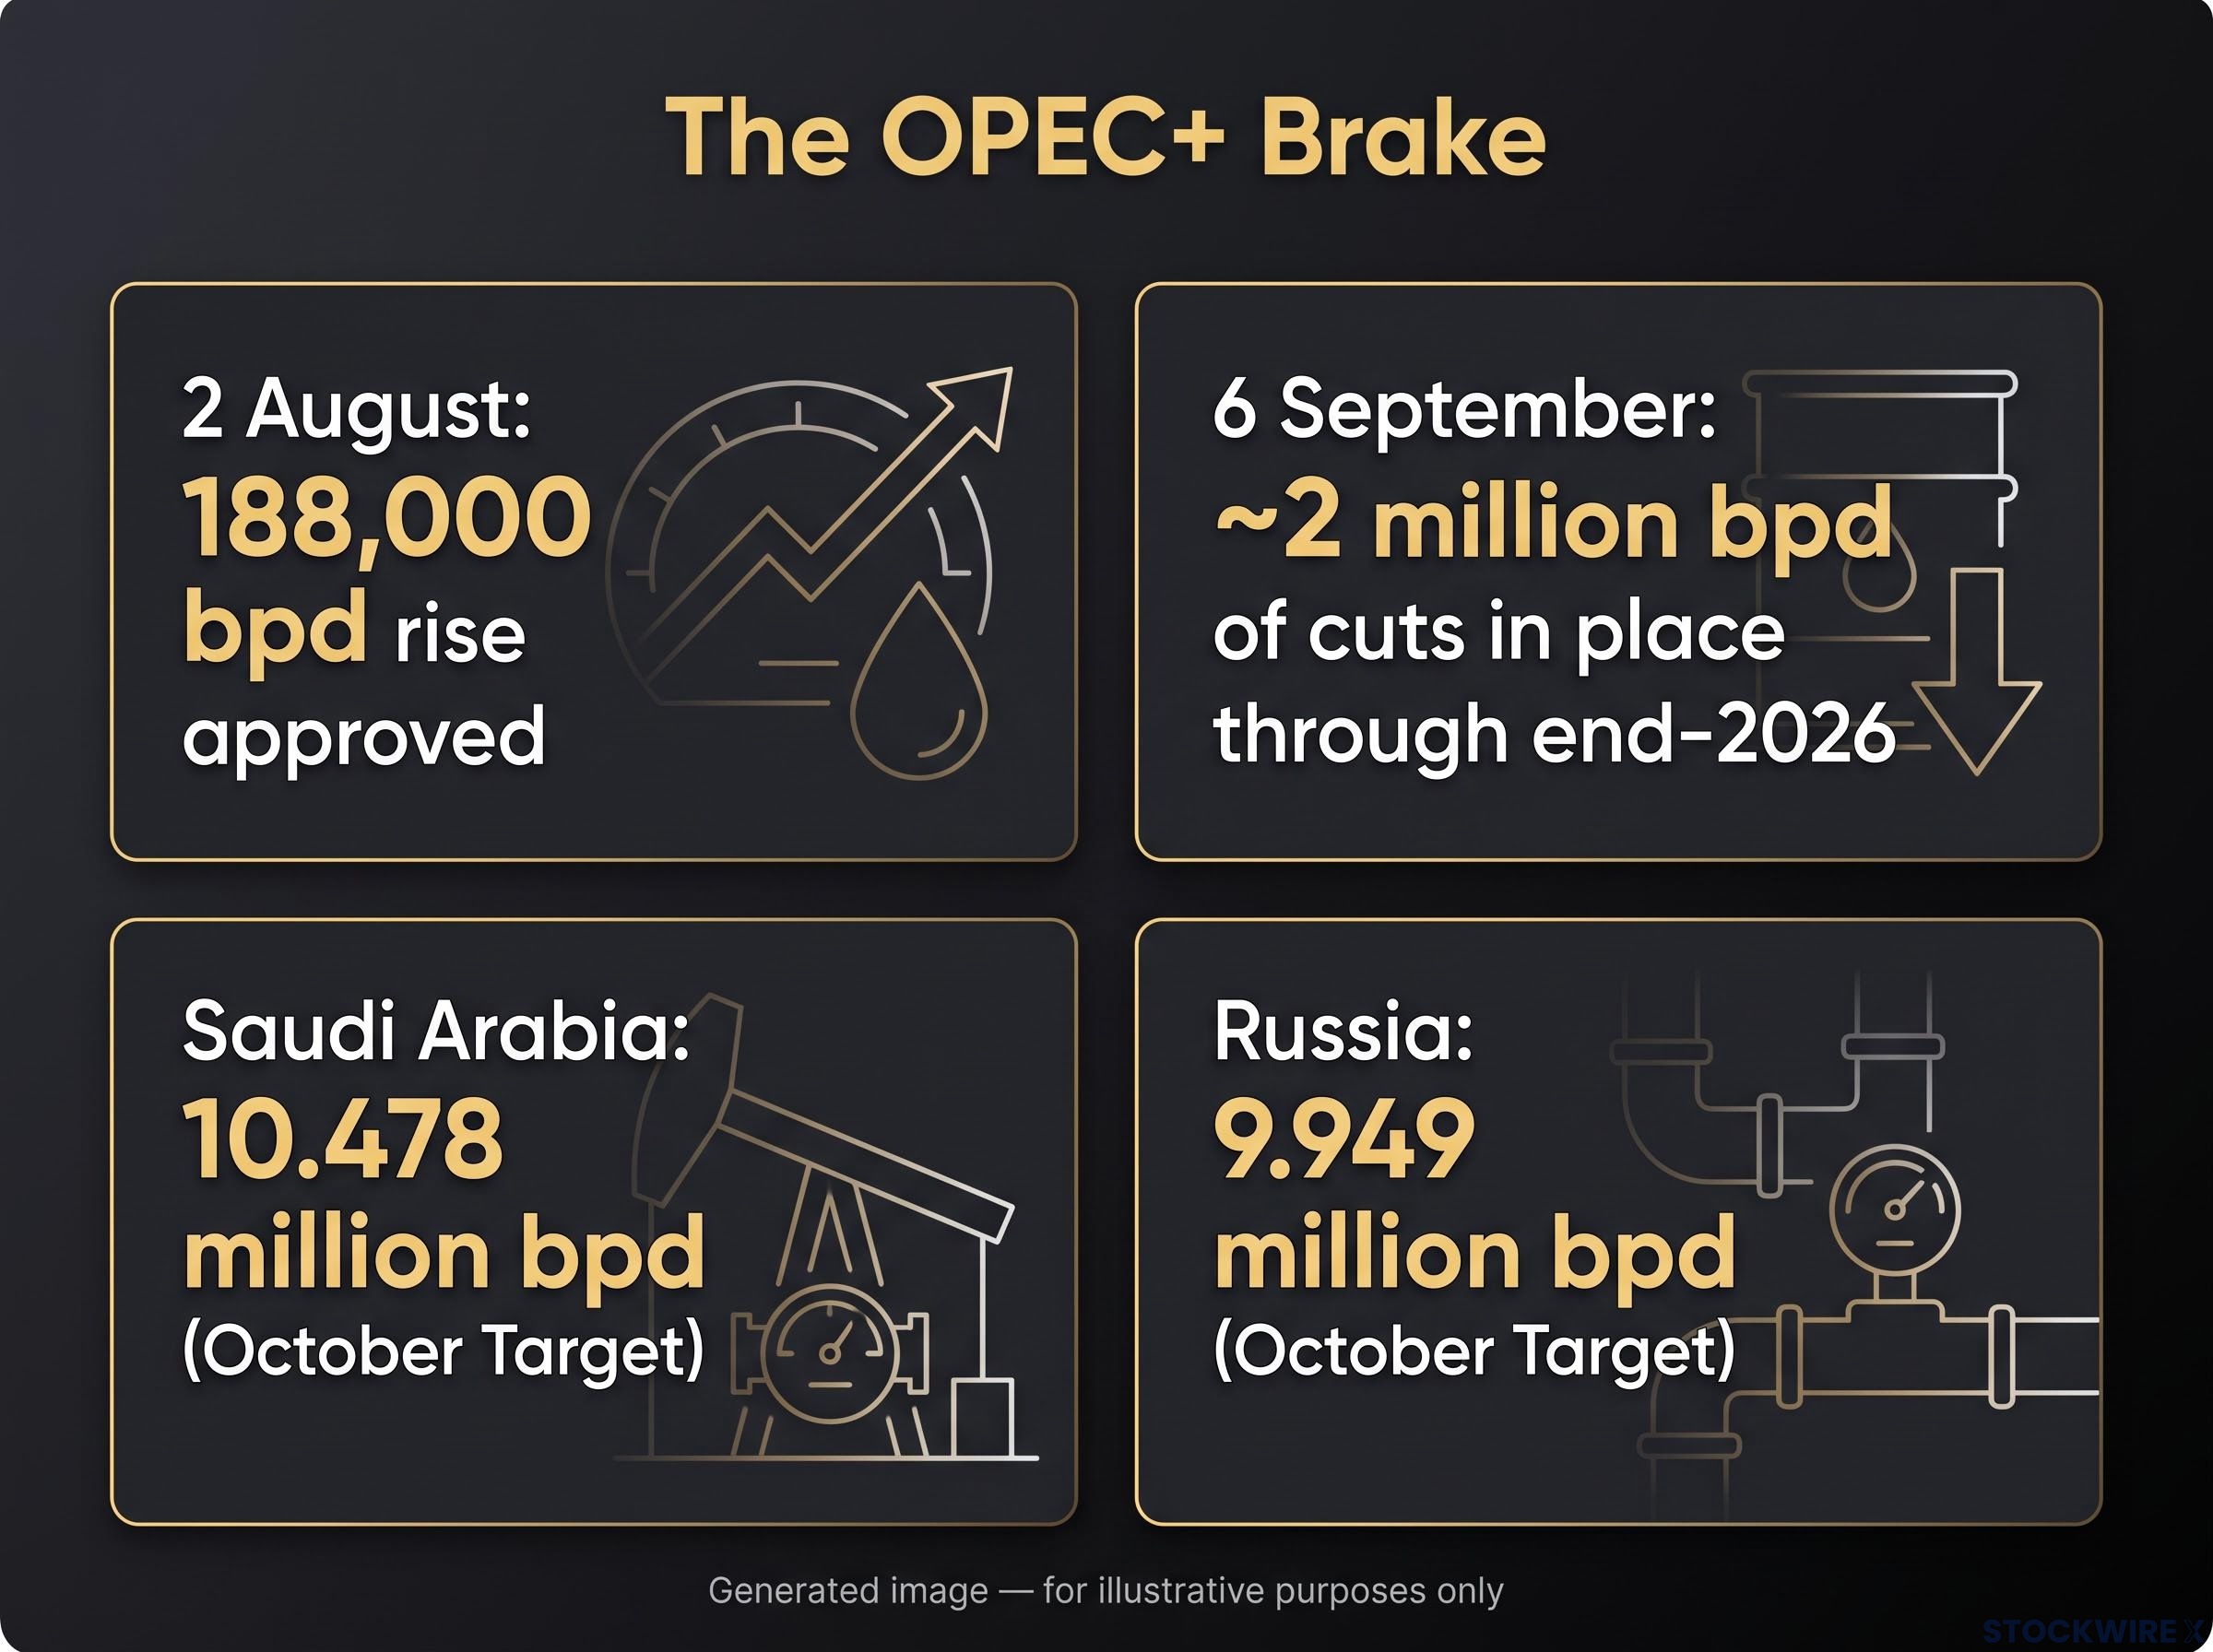
OPEC+ (the Organization of the Petroleum Exporting Countries plus allied producers such as Russia) holds the biggest lever on the ceiling. On 2 August, the group approved a rise of about 188,000 bpd, completing the unwind of the 1.65 million bpd voluntary cut agreed in 2023.
On 6 September, the seven core members kept October targets unchanged, leaving about 2 million bpd of group-wide cuts in place through end-2026. October required production sits at 10.478 million bpd for Saudi Arabia and 9.949 million bpd for Russia. In early October, Reuters reported the group had agreed in principle to hold November targets, with capacity reviews and 2027 baselines still to be debated.
Those idle barrels are the brake: once quotas are settled, they could return and cap any spike.
What history says about premiums
| Precedent | What happened | Duration of price effect | Lesson |
|---|---|---|---|
| 2019 Abqaiq/Khurais attacks | Major Saudi processing damage | Sharp but short-lived | Repairs and spare capacity fade spikes |
| 2019 tanker incidents near Hormuz | Limited physical damage | Premium driven by escalation fears | Threats alone can lift prices |
| Red Sea/Houthi attacks | Rerouting, higher freight and insurance | Persistent cost pressure, no output loss | Logistics shocks favour Brent |
The pattern holds across cases: disruptions that are large and uncertain in duration move prices most, while buffered, well-understood ones fade. The counter-arguments are real too. High prices can destroy demand, consumers can release Strategic Petroleum Reserve (SPR) stocks, and a swing to de-escalation can unwind a premium quickly. Commentators remain split on whether today’s premium is structural or cyclical.
The dates worth tracking:
- Weekly API (Tuesday) and EIA (Wednesday) releases: the first read on the Isaias inventory draw.
- Gulf platform restarts: how quickly the 71.5% shut-in reverses.
- IRGC activity and Hormuz traffic: whether threats become confirmed flow losses.
- 3 November 2026: the midterms, when the no-strike pledge lapses.
- End-2026 OPEC+ review: decisions on 2027 baselines and the 2 million bpd of cuts.
Treat the premium as reversible. De-escalation, a stable Hormuz or returning OPEC+ barrels could deflate it fast; a confirmed closure-related loss of flow would not.
Even if talks progress, the Hormuz risk premium may decompress slowly, because insurers and shipowners price lingering threat well after diplomatic headlines improve, and the IEA sees recovery taking around two years.
Past performance does not guarantee future results. Financial projections are subject to market conditions and various risk factors.
Reading the next move in WTI without chasing headlines
Three forces explain the flat close. Diplomacy sets the tail risk, physical supply sets the near-term balance, and OPEC+ spare barrels set the ceiling. A headline only matters if it shifts one of those three.
Two gaps remain open: US inventory levels and Saudi export volumes. The next API and EIA releases will fill the first, and Gulf restarts will show how temporary the hurricane squeeze proves to be.
The date that matters most is 3 November. After the midterms, the no-strike pledge no longer applies, and the market will have to price the diplomacy on its own terms.
Investors exploring how much of today’s price is fear premium will find our full explainer on WTI backwardation and the fear premium, which quantifies the gap between spot and one-year forward contracts.
This article is for informational purposes only and should not be considered financial advice. Investors should conduct their own research and consult with financial professionals before making investment decisions.