
Why Drug Reformulation Carries Less Risk Than Investors Price in
2 hrs ago

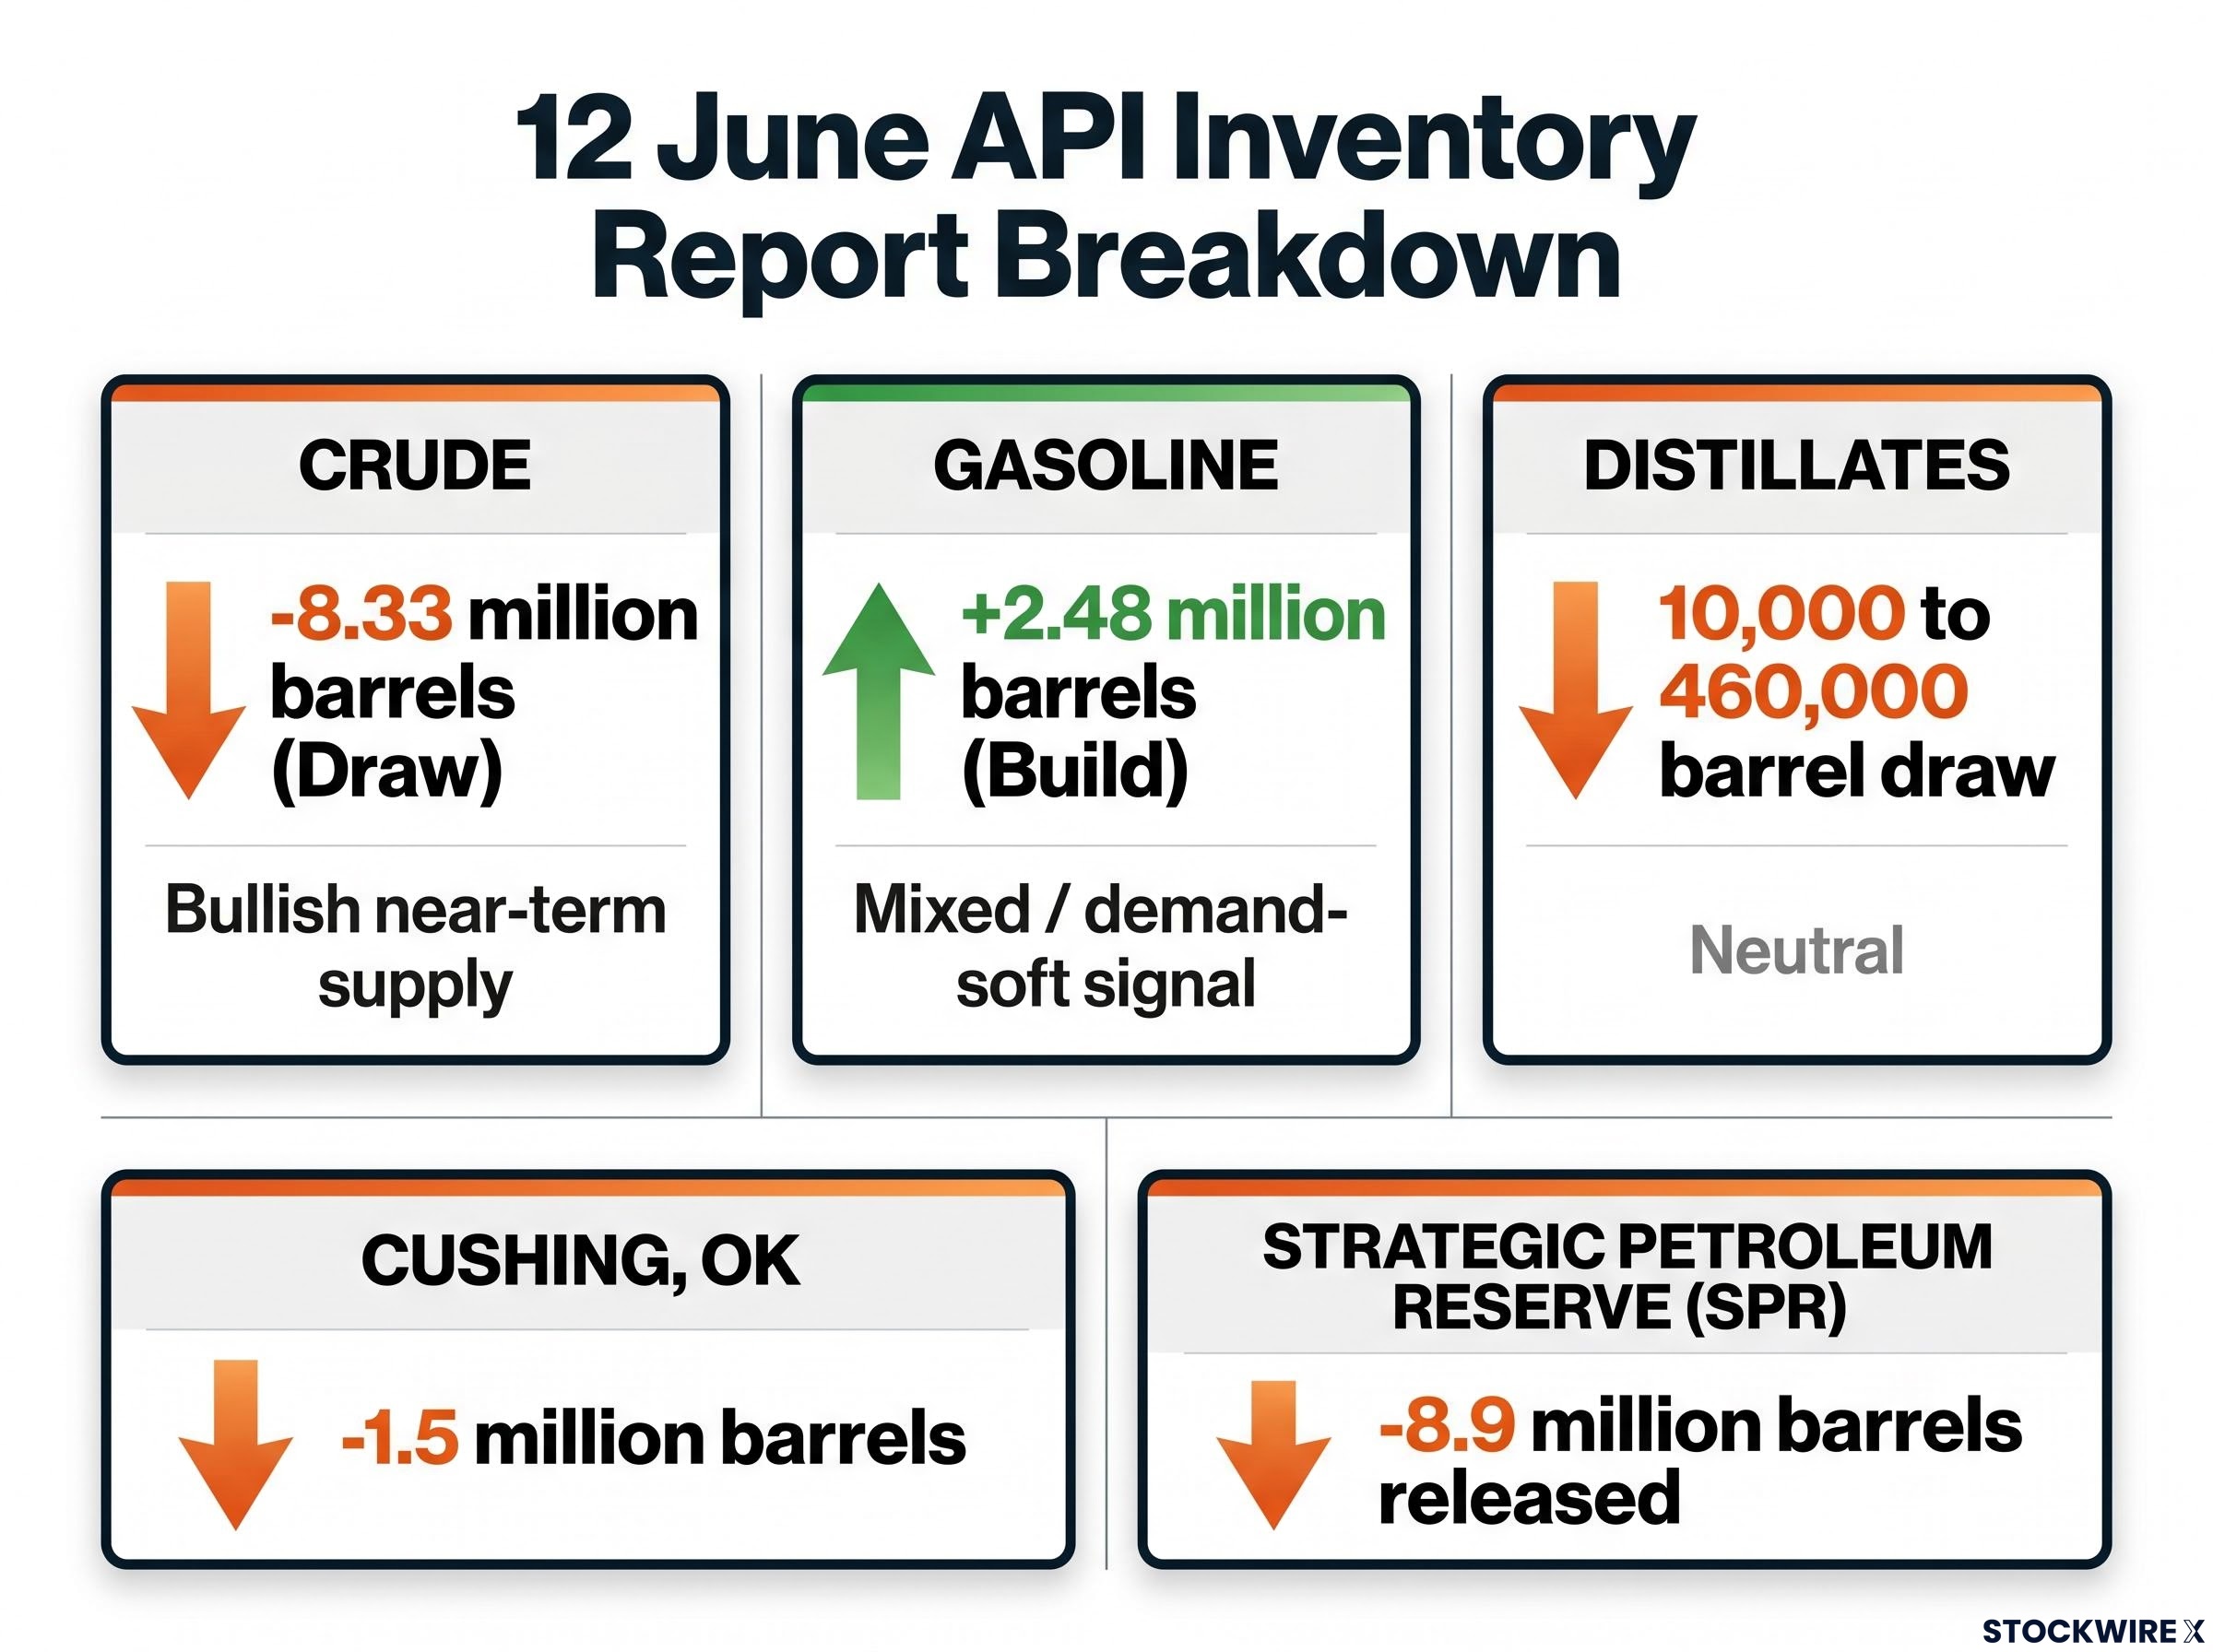
An 8.33 million barrel crude draw sounds unambiguously bullish, until you notice gasoline inventories rose by 2.48 million barrels in the same week and the government was simultaneously releasing nearly 9 million barrels from its emergency reserve.
On 16 June 2026, the American Petroleum Institute (API) released its weekly estimate for the period ending 12 June, showing a crude stockpile decline almost double the consensus forecast of 4.5 million barrels. The headline number moved markets. The full picture is considerably more textured.
For investors trying to incorporate weekly oil inventory data into energy market analysis, this report is an ideal case study in how to read the numbers that actually matter and how to filter out the noise. What follows walks through the 12 June API report layer by layer, explains the difference between API and Energy Information Administration (EIA) releases, and provides a six-step framework readers can apply every week the data lands.
A trader scanning the API release on Tuesday evening saw one figure first: crude inventories fell by 8.33 million barrels. In inventory language, a “draw” means stocks declined week-on-week, signalling that consumption or exports exceeded supply. A “build” means the opposite: stocks rose because supply outpaced demand.
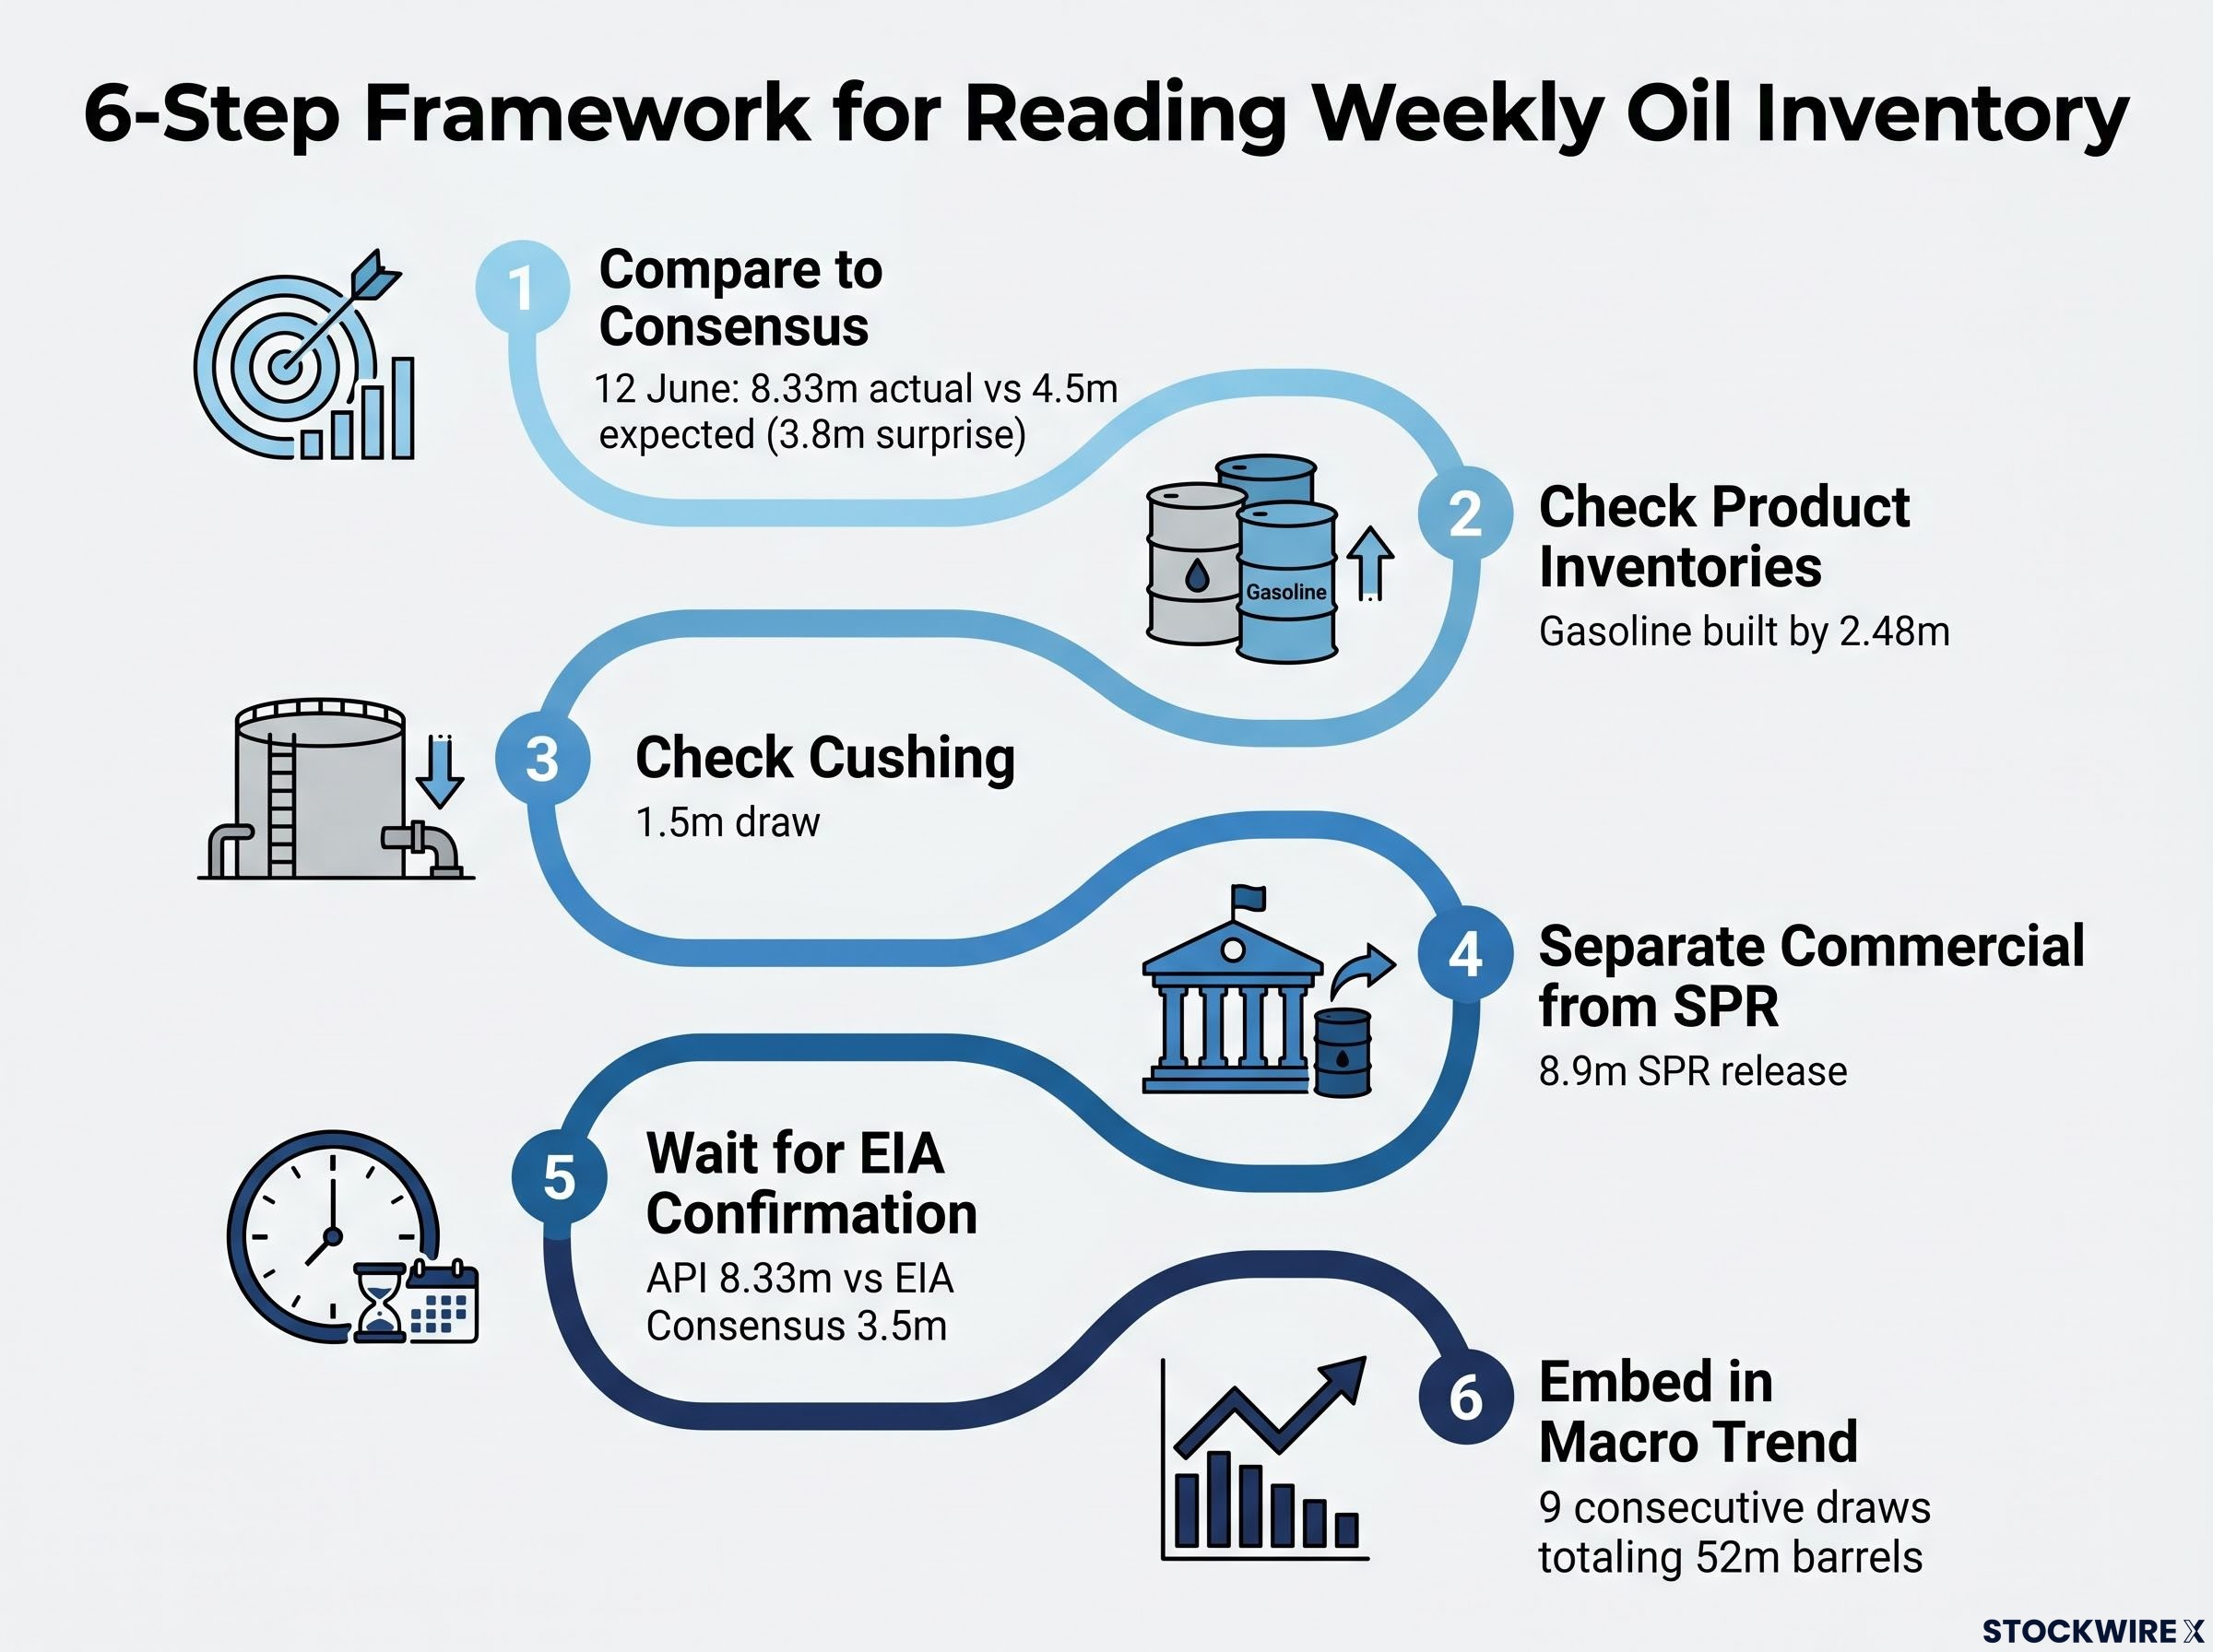
The draw itself is only half the signal. Markets had already priced in a decline. The consensus forecast sat at 4.5 million barrels. What moved prices was the gap between expectation and reality.
“It is the deviation from consensus that moves prices, not the sign of the change by itself.”
Bank of Canada research on inventory news and asset markets confirms that the price-moving variable in weekly petroleum data is the surprise component, specifically the deviation between the reported figure and the consensus forecast, rather than the direction or magnitude of the change in absolute terms.
Consider the inverse. A 2 million barrel draw when 6 million was expected would be bearish, even though inventories technically fell. The market had positioned for a larger decline; the smaller actual draw implies supply conditions are looser than anticipated. Investors who skip this step misread inventory headlines constantly, treating any draw as bullish regardless of what was already priced in.
For investors who want to understand why the SPR has been drawn down so aggressively in the first place, our dedicated guide to how the Iran conflict reshaped oil markets traces the Brent price surge from $72-$74 to a peak of $126, the Strait of Hormuz closure mechanics, and the Fed implications of sustained energy inflation, providing the geopolitical backdrop that makes the weekly inventory numbers meaningful.
Two separate organisations publish weekly U.S. inventory estimates, and they use fundamentally different methodologies. Understanding this gap is the single most practical risk-management insight for retail investors in energy markets.
| Attribute | API | EIA |
|---|---|---|
| Source | Industry trade group | U.S. government agency |
| Methodology | Voluntary reporting from members | Mandatory reporting from operators |
| Release timing | Tuesday after market close | Wednesday morning |
| Market authority | Preliminary estimate | Treated as authoritative |
The two reports regularly diverge by several million barrels. When they do, the EIA print re-anchors the market. In one illustrative prior episode, the API reported an approximately 4.5 million barrel draw, but the EIA showed only approximately 1.2 million barrels, and oil prices fell sharply when the official data landed. (This example is sourced from research aggregation and has not been independently verified against historical records, but the pattern it illustrates is well documented.)
The API showed a 8.33 million barrel draw. Analyst consensus heading into the EIA release (expected 17 June) sits at approximately 3.5 million barrels.
That gap is significant. A disciplined investor treats the Tuesday API print as a strong preliminary signal, not as confirmation. Between Tuesday evening and Wednesday morning, the rational response is to avoid large positioning changes and wait for the official figure. If the EIA confirms a draw close to the API’s magnitude, the bullish signal is validated. If the EIA reports a much smaller draw, the Tuesday price move could partially reverse.
If demand were uniformly strong across the U.S. petroleum supply chain, crude draws would accompany product draws. Crude would leave commercial storage, refineries would process it into gasoline and diesel, and those products would be consumed faster than they are produced. The 12 June API report told a more complicated story.
| Category | Reported change | Direction | Signal interpretation |
|---|---|---|---|
| Crude | -8.33 million barrels | Draw | Bullish for near-term supply |
| Gasoline | +2.48 million barrels | Build | Mixed; demand-soft signal |
| Distillates | Marginal draw (source figures vary) | Slight draw | Neutral |
A crude draw paired with a gasoline build is consistent with refineries running at high utilisation rates, pulling in crude but producing more gasoline than the market is immediately consuming. That is not the same signal as roaring end-user demand.
The distillate figure warrants a transparency note: the original source reported a decline of 10,000 barrels while a secondary research source cited approximately 460,000 barrels. Both describe the move as marginal and neutral. Neither figure suggests a strong diesel-driven industrial demand signal.
The crude headline is bullish for near-term supply balance. The product breakdown qualifies that bullishness. Most retail investors never look past the crude number, and that is precisely where the misreading begins.
Gasoline demand signals carry weight beyond the refinery margin calculation: U.S. average gasoline prices reaching $4.25 per gallon in late April 2026 triggered a historically rare threshold that has preceded an average 11% S&P 500 decline in the six months following every comparable episode since 1993, connecting the product-level inventory build to a broader equity market risk that most energy analysts do not model explicitly.
The headline draw obscures two layers of context that change the interpretation materially. Location matters, and so does the type of barrel being counted.
Cushing, Oklahoma is the physical delivery hub for West Texas Intermediate (WTI) futures contracts, meaning oil stored at Cushing is what sellers deliver when a front-month futures contract expires. A draw at Cushing tightens deliverable supply for WTI specifically, even if nationwide commercial stocks remain comfortable.
The 12 June API report estimated Cushing inventories fell by approximately 1.5 million barrels, following a draw the prior week as well. Sustained Cushing draws can push front-month futures prices above later-dated contracts, a condition the market calls backwardation.
The Strategic Petroleum Reserve (SPR), the U.S. government’s emergency stockpile, is entirely separate from commercial inventories. Both the API and EIA exclude SPR barrels from their commercial inventory counts. In the week ending 12 June, the SPR released approximately 8.9 million barrels, bringing it to its lowest level since the early 1980s.
SPR releases at scale have historically been treated as temporary demand management tools, but the approximately 280 million barrels deployed across IEA and US reserves since the Iran conflict began have failed to halt global inventory drawdowns, which raises a structural question about whether government-sourced supply can substitute for organic production over an extended disruption.
Commercial inventory tightness and SPR-driven tightness are two fundamentally different market signals. Commercial draws reflect organic supply-demand dynamics. SPR releases add government-sourced supply that can mask how tight, or how loose, the commercial market actually is.
The question investors should be asking: how much of the headline crude tightness reflects genuine market forces versus barrels the government put on the market?
The EIA’s Weekly Petroleum Status Report is the authoritative source for U.S. oil inventory data. It uses mandatory reporting from operators, covering the full scope of commercial petroleum storage across the country. The API estimate, released the evening before, serves as a preliminary read using voluntarily submitted industry data.
The EIA report tracks five major categories, each telling investors something different about the supply chain:
By the week ending 12 June, API-tracked crude inventories had fallen for roughly nine consecutive weeks, totalling approximately 52 million barrels in cumulative draws. That sounds dramatic in isolation.
The year-to-date picture tells a different story. Inventories were only approximately 1-1.5 million barrels lower than where they began the year, because stocks started 2026 at elevated levels. Nine weeks of draws had largely returned inventories toward a more normal range rather than creating genuine scarcity.
The question this reframes for investors: is the market converging toward balance, or simply normalising from excess? The answer determines whether the draw trend represents a bullish structural shift or a statistical correction that will flatten once stocks reach equilibrium.
Every Tuesday evening when the API number lands, walk through this sequence before making any portfolio decisions. Each step is anchored to the 12 June report as a worked example.
“Cautiously bullish near-term, with ambiguous demand signals and meaningful dependence on EIA confirmation.”
That is the net assessment this framework produces for the 12 June case. It is a measured conclusion, not a trading trigger.
A 3.8 million barrel bullish surprise is a material data point. It is not a standalone price forecast. The 12 June report generated a mixed or muted market response despite the headline strength, and that reaction was not irrational; it reflected a market weighing the inventory signal against a broader set of forces.
The SPR draw of approximately 8.9 million barrels adds physical supply in the short term, potentially moderating the price response even when commercial stocks tighten. When OPEC+ production decisions, sanctions developments, or demand-side macro shocks dominate the weekly narrative, a single bullish inventory surprise may register as only a modest move.
Four macro factors can override or mute an inventory signal on any given week:
Investors who understand the limits of the inventory signal are better positioned than those who act reflexively on headlines. Weekly inventory data is one node in a decision tree. The framework above helps place it in proper proportion, and the discipline to wait for EIA confirmation before acting on preliminary API figures is what separates informed positioning from reactive trading.
The supply shock pricing paradox visible in 2026 oil markets, where a cumulative 246 million barrels drawn from commercial inventories across March and April still left Brent trading at $106-$107 rather than the $150-$200 range pre-crisis models projected, reflects the same multi-factor dampening logic that the six-step framework above applies at the weekly level: demand destruction, partial reopening probabilities, and divergent agency forecasts all compress the price response to what the raw inventory figures imply.
This article is for informational purposes only and should not be considered financial advice. Investors should conduct their own research and consult with financial professionals before making investment decisions.
The API releases a preliminary weekly estimate on Tuesday evening using voluntary data from industry members, while the EIA publishes the authoritative figure on Wednesday morning using mandatory reporting from operators. The two reports regularly diverge by several million barrels, and the EIA print is treated as the definitive market anchor.
A crude draw only becomes a bullish signal when compared against the consensus forecast. If the draw is larger than expected, that surprise component is what moves prices; a draw smaller than forecast can actually be bearish even though inventories technically declined.
The SPR is tracked separately and excluded from commercial inventory counts, so a large SPR release can add significant government-sourced supply to the physical market without appearing in the commercial draw headline. In the week ending 12 June, approximately 8.9 million barrels were released from the SPR alongside the reported commercial draw.
A crude draw paired with a gasoline build typically signals that refineries are running at high utilisation and producing more gasoline than the market is immediately consuming, which is not the same as strong end-user demand. Investors who only watch the crude headline miss this product-level qualification.
Cushing is the physical delivery hub for WTI futures contracts, meaning the crude stored there is what sellers must deliver when a front-month contract expires. A sustained draw at Cushing tightens deliverable supply specifically for WTI and can push front-month prices above later-dated contracts, a condition known as backwardation.