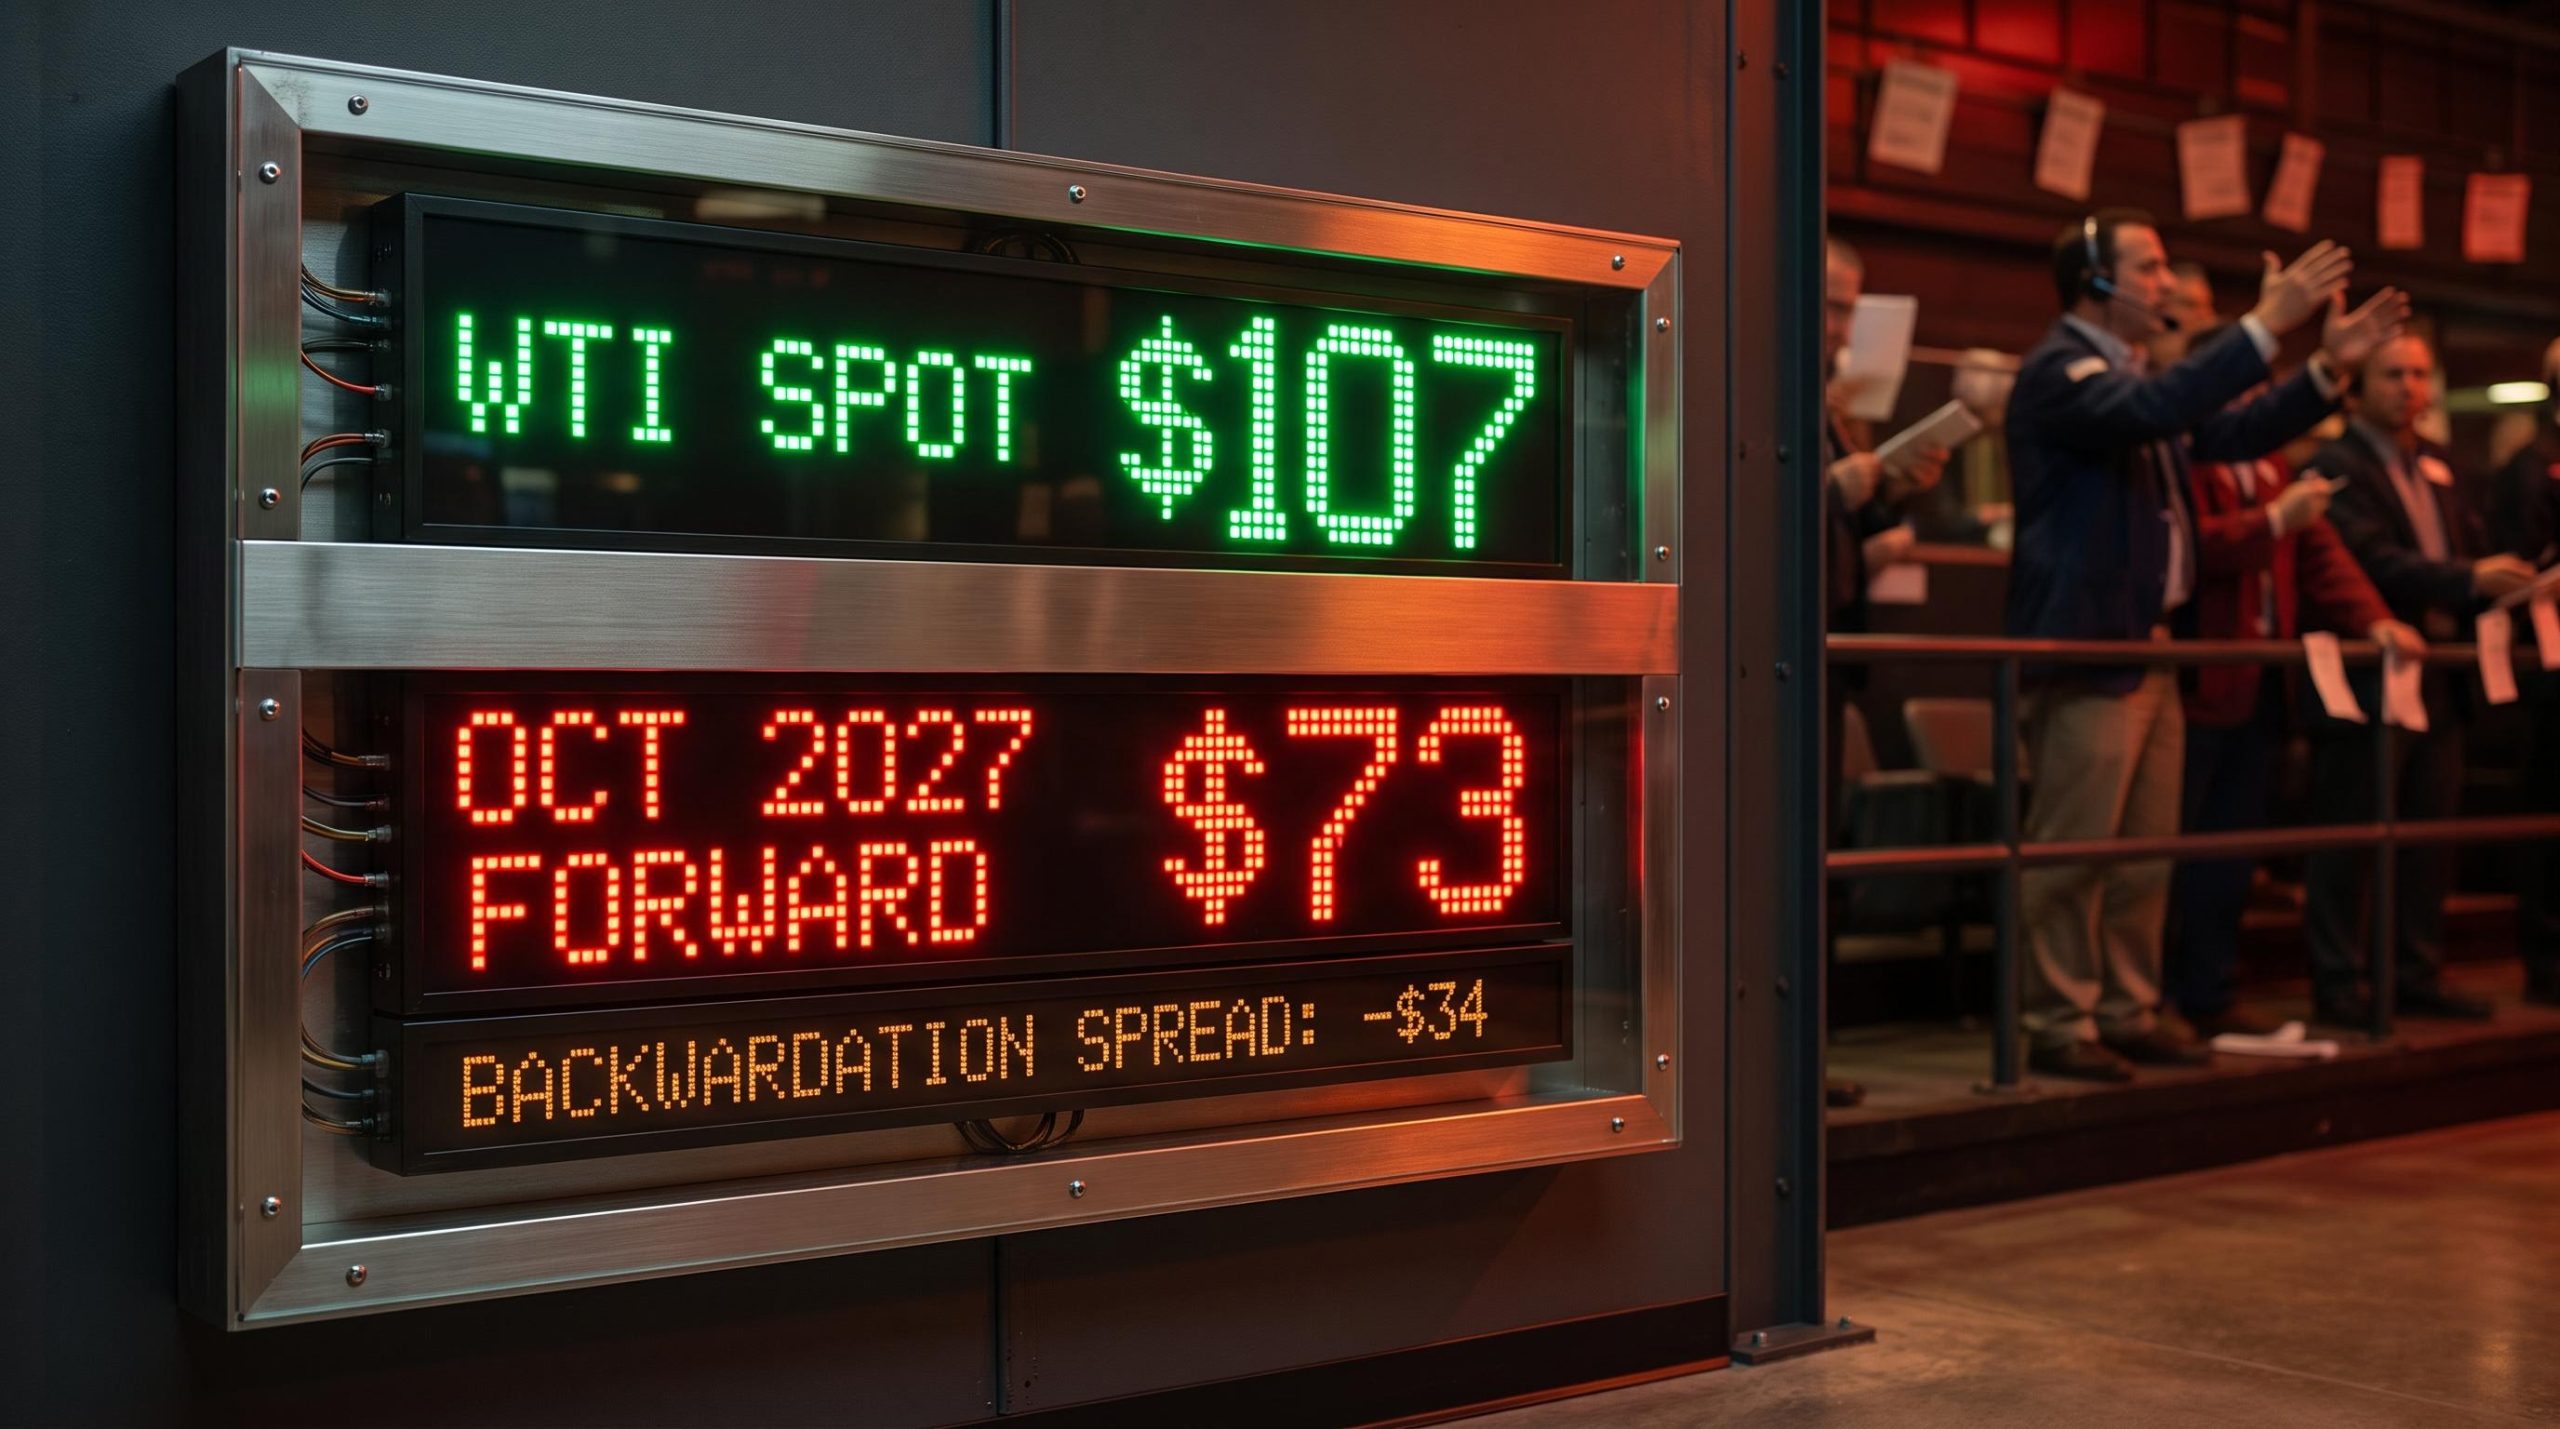
WTI crude is trading above $107 a barrel right now. The one-year forward contract, the price traders are willing to lock in for delivery in October 2027, sits near $73. That is a $34 gap between what oil costs today and what the market expects it to cost a year from now.
That gap is not noise. It is the forward market issuing a structural verdict that contradicts almost everything the spot price is telling you.
The bearish case here is analytically serious, and it does not rest on one contrarian voice. The World Bank projects Brent averaging $60 a barrel in 2026. The U.S. Energy Information Administration (EIA) sees Brent at $66. TD Economics trimmed its WTI forecast to $62. Three major institutions converging on the low $60s is not a fringe call; it is a consensus about where fundamentals, stripped of fear, actually place the price.
The distinction that runs through all of it is the difference between a fear premium and a fundamentals-driven price. Learn to read the forward curve, the crack spread, and the geopolitical headlines correctly, and you can separate the signals that carry analytical weight from the ones that are just noise dressed as urgency.
Why the spot price is lying to you right now
The oil market is in a condition called backwardation, where near-term prices sit above longer-dated ones. It is the mirror image of a normal supply glut. Right now, prompt scarcity and geopolitical fear are pushing the spot price up to $107, while the October 2027 forward contract trades at just $73.
That structure tells you something specific. The market is willing to pay a steep premium for a barrel today, but it is unwilling to pay anywhere near that for a barrel in a year. Traders are not betting on sustained tightness; they are pricing in an unwind.
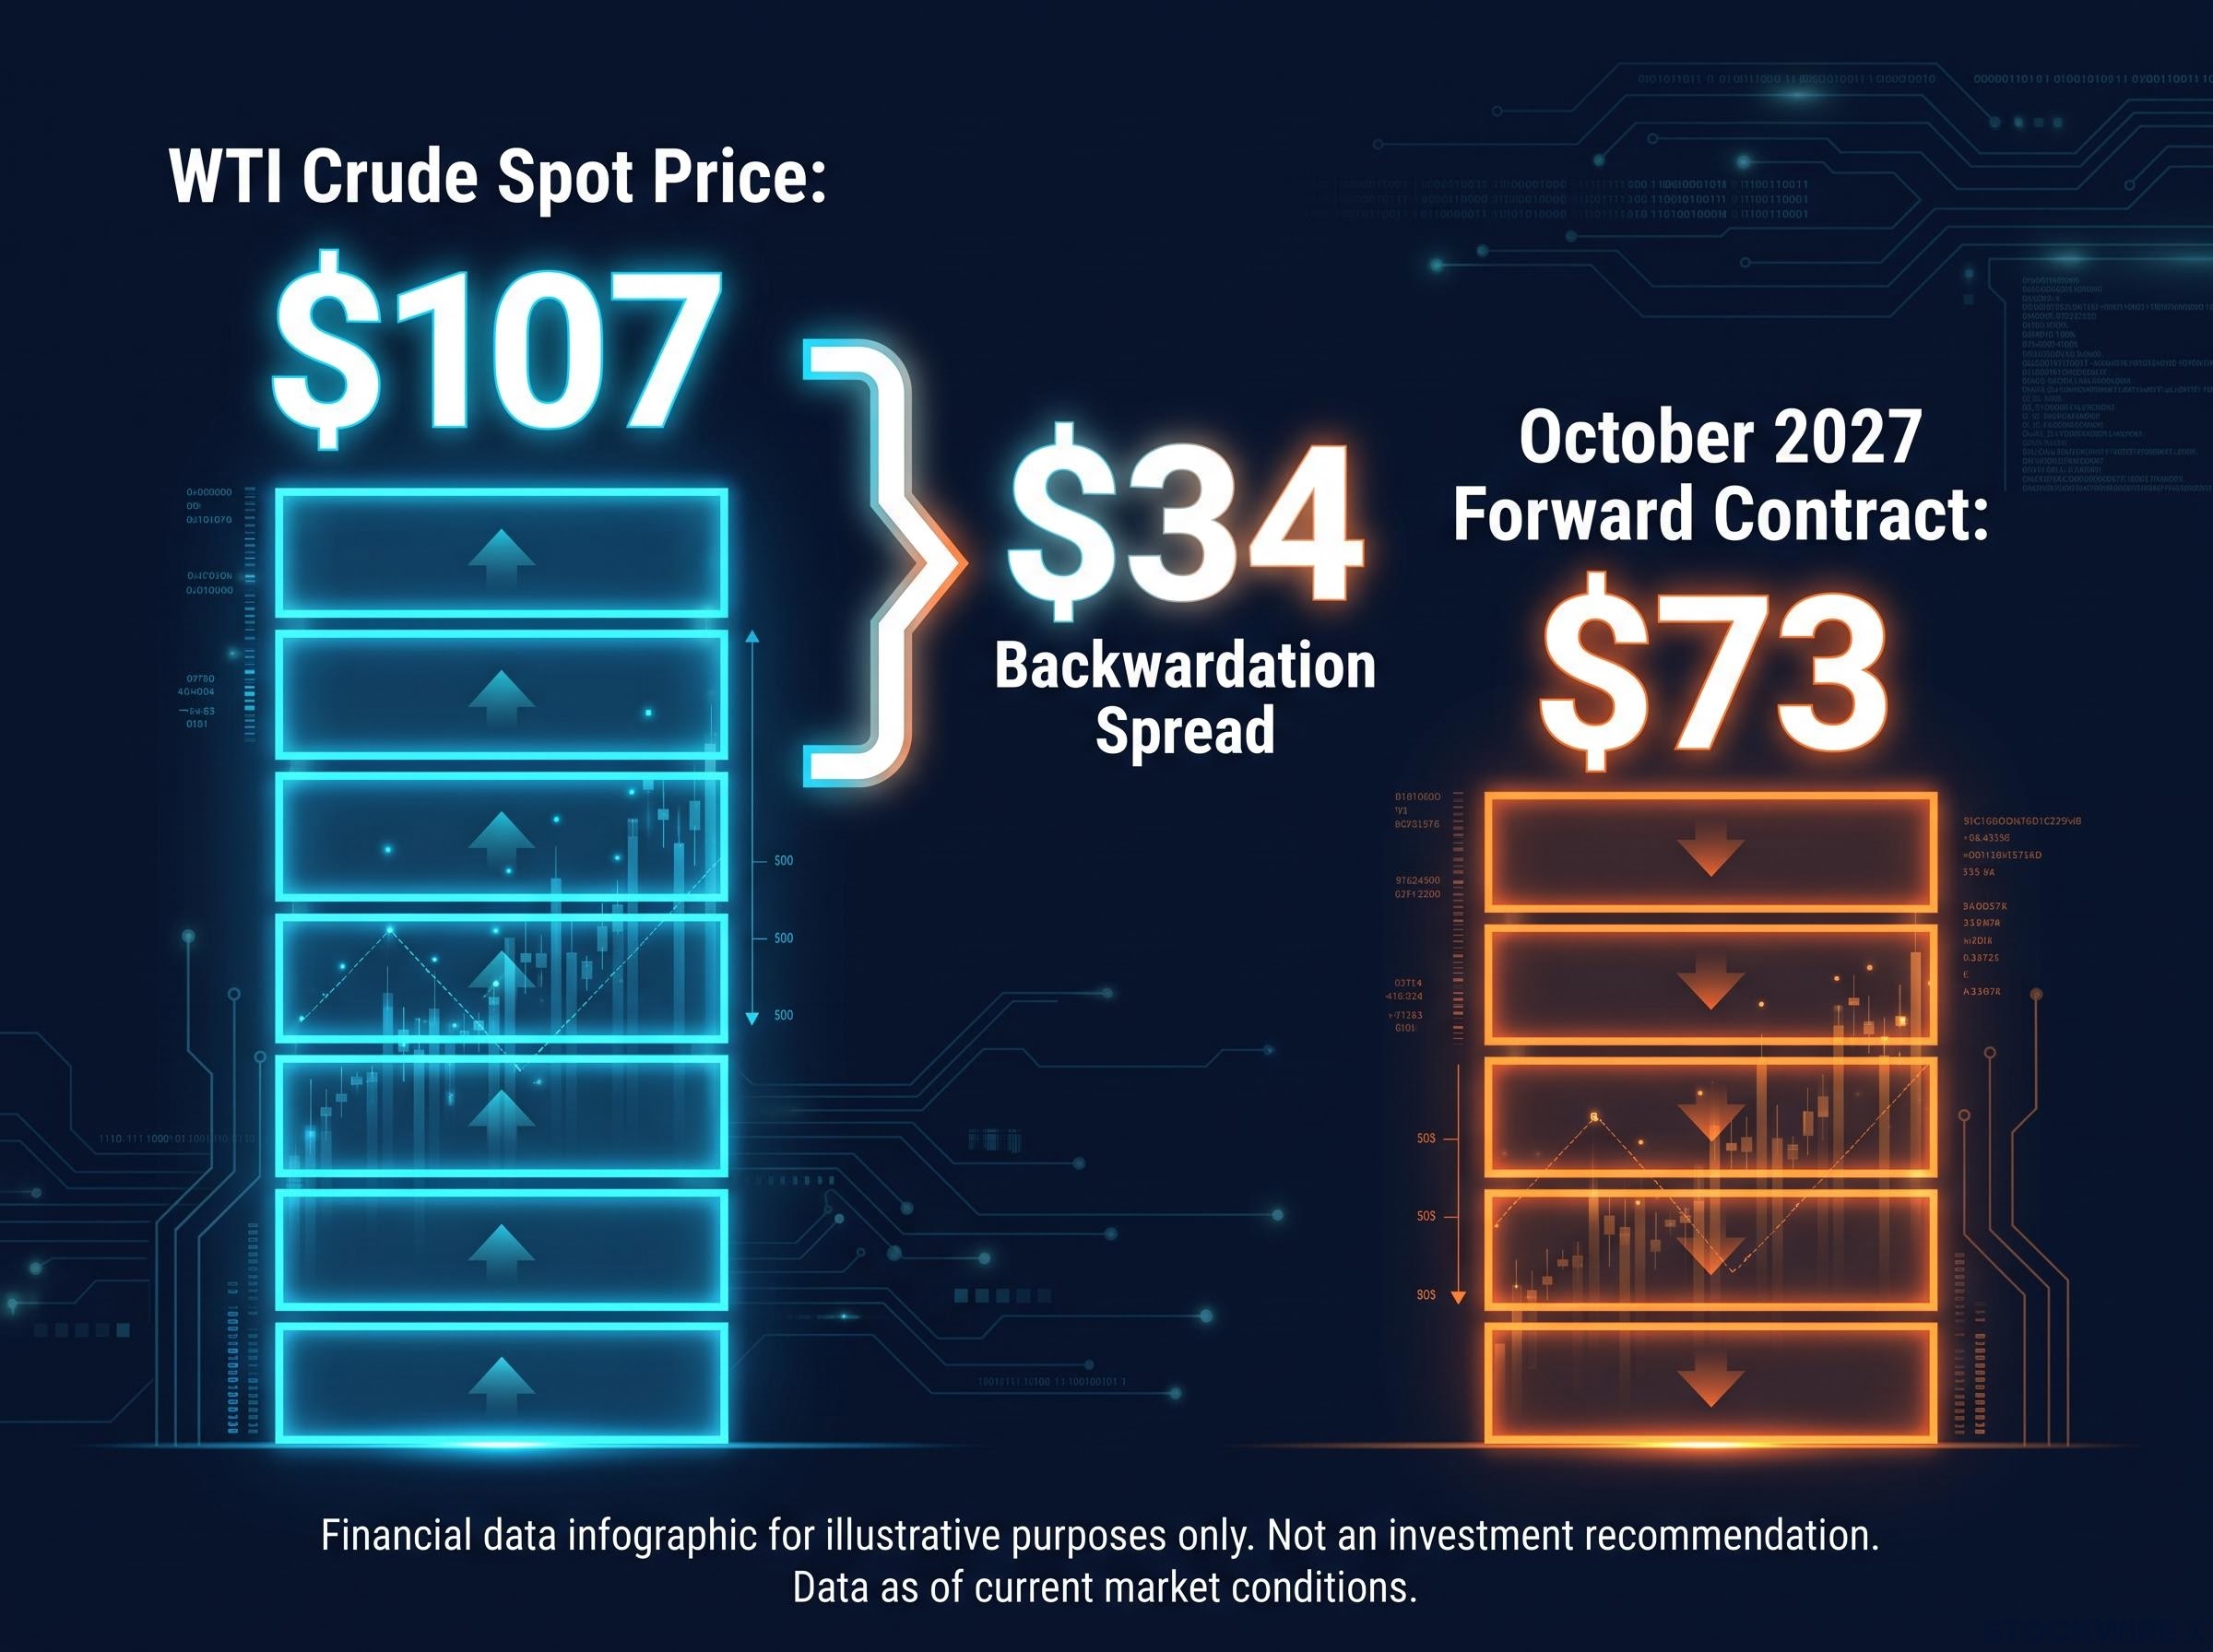
The $34 per barrel backwardation spread is the market’s own internal estimate of how much of the current price is fear rather than demand.
This is the core of the argument made by analyst Todd Horowitz, who has held a short position on crude since early in the year. His framing is blunt: current crude pricing is a fear-driven trade, not a physical supply-demand trade. The distinction matters because a fear premium evaporates the moment the fear resolves, while a genuine demand signal does not.
Horowitz is targeting a bottom in the low $60s before year-end. That target is not arbitrary. The one-year forward curve is at $73.08, well above that target, meaning the structural surplus math would need to close the remaining gap.
Here is what that $34 spread means for you as an observer. The forward market has already priced in a substantial reversal of the current premium. Betting on the $107 handle to persist is a bet against the collective positioning of institutional futures traders who have put real money behind the view that this price does not hold.
What backwardation looked like before the last major crash
The 2008 to 2009 collapse offers a precedent for how fast a curve can normalise. Crude fell from the $100 to $145 range down to $35 to $50 as demand cratered and storage filled.
The curve flipped from backwardation into contango, the condition where future prices exceed spot. By 12 February 2009, the 12-month contango had widened to a striking $22 a barrel, with front-month WTI at $33.98 and the one-year forward at $55.95.
That is not a forecast for a repeat. It is a reminder that when a curve normalises, it can do so at speed, and the direction of travel is visible in the structure long before the headlines confirm it.
When big ASX news breaks, our subscribers know first
The structural bear case: supply math that OPEC+ cannot offset
The reason the forward curve is so heavily discounted comes down to supply the market cannot easily reabsorb. The International Energy Agency (IEA) projects supply growth of 2.7 million b/d in 2025, with global supply potentially reaching 106.1 million b/d. Much of that growth comes from producers outside OPEC+, and decisions already made are difficult to reverse.
OPEC+ is not holding the line either. The group agreed to an overall production level of 39.7 mb/d through the end of 2026, and its voluntary cuts are being unwound on a schedule, not held indefinitely.
OPEC+ production discipline is less robust than headline quota figures suggest: the UAE’s formal exit on 1 May 2026 permanently removed roughly 14% of the cartel’s coordinated capacity, and the group now controls only about 27-28% of global crude supply, well below the majority share that once gave it genuine pricing authority.
- Voluntary cuts of 1.65 mb/d extended through 2026
- Extra cuts of 2.2 mb/d phased out gradually from April 2025 to September 2026
That phase-out means incremental barrels are arriving whether demand supports them or not. The result is a projected surplus, with estimates for 2026 ranging from 2.1 million b/d to 4.09 million b/d. A surplus of that size translates directly into inventory builds, and rising inventories are the physical mechanism that drags prices down.
This is where the independent forecasts matter. When the World Bank, the EIA, and TD Economics land on a price range that matches Horowitz’s bearish target, the alignment tells you this is a supply-math problem with a calculable answer, not a matter of one analyst’s opinion.
| Institution | 2025 forecast | 2026 forecast | Primary driver |
|---|---|---|---|
| World Bank (Brent) | $68/bbl | $60/bbl | Sluggish demand, excess supply |
| EIA (Brent) | $74/bbl | $66/bbl | Production growth outpacing demand |
| TD Economics (WTI) | $62/bbl | Not stated | Softer demand, fading fear premium |
Understanding why the surplus is structural rather than cyclical puts you in a better position to judge whether any given headline is a genuine supply threat or a temporary deviation from a trend already set in motion.
What crack spreads reveal about refiner behaviour and the consumer price squeeze
There is a second signal running underneath the crude price, and it explains why the pump has not tracked the barrel. It is called the crack spread: the margin a refiner captures between the cost of crude going in and the price of refined products like diesel and petrol going out.
The benchmark U.S. 3-2-1 crack spread has historically moved between $10 and $20 a barrel. That is the normal range. What has happened in 2026 is not a move within that range; it is a departure from it.
In early September 2026, the U.S. diesel crack spread hit a record intraday high of $108.02 per barrel, roughly five to ten times its historical norm.
The diesel crack spread crossed $100 per barrel for the first time on record, driven by three compounding supply shocks: Ukrainian drone strikes on Russian refining capacity, Middle Eastern refinery damage, and a confirmed drawdown in US distillate stocks that pushed the benchmark reading to four to six times its historical norm.
The rest of the data confirms this is structural, not a blip. By mid-September, NY Harbor diesel was paying refiners $117.18 over WTI. The broader 3-2-1 crack stood at $66.69 on 15 September, only about 12% below its all-time record of $75.89 set in May 2022. The market has not returned to normal; it has merely stepped back from the extreme edge.
The EIA expects average U.S. diesel crack spreads to exceed $84/bbl, roughly $2 per gallon, through the autumn of 2026 before easing.
Horowitz alleges that refiners are deliberately withholding capacity to sustain these margins. Framed less as a conspiracy and more as an incentive structure, the logic holds: when spreads are this wide, the rational move is to maximise margin per barrel rather than throughput. The IEA adds that the global refining system is stretched to its limit, which keeps product markets tight even as crude drifts toward surplus.
Here is what a crack spread six to twelve times its historical norm tells you. Relief at the pump is not primarily a function of the crude price. It requires a separate, slower normalisation of refiner margins, which is why pump prices can stay high even as the barrel falls.
From refinery gate to grocery shelf: how diesel costs move through the economy
Diesel is the vector through which crude prices enter the wider economy. Roughly 86% of commercial trucks in the U.S. run on diesel, so elevated diesel costs flow straight into the price of nearly everything that moves by road.
The transmission runs in a fairly direct sequence:
- Crude and refining costs set the wholesale diesel price
- Wholesale prices feed the on-highway retail diesel price, which reached a national average of $6.285 per gallon on 14 September 2026
- Trucking costs rise across the supply chain
- Higher freight costs lift retail prices for food and consumer goods
The scale is meaningful. Energy, transport, and storage contribute over 7% of total food costs, and the Independent Grocers Alliance estimates a sustained 10-15% fuel price increase can lift retail food prices by 2-4%.
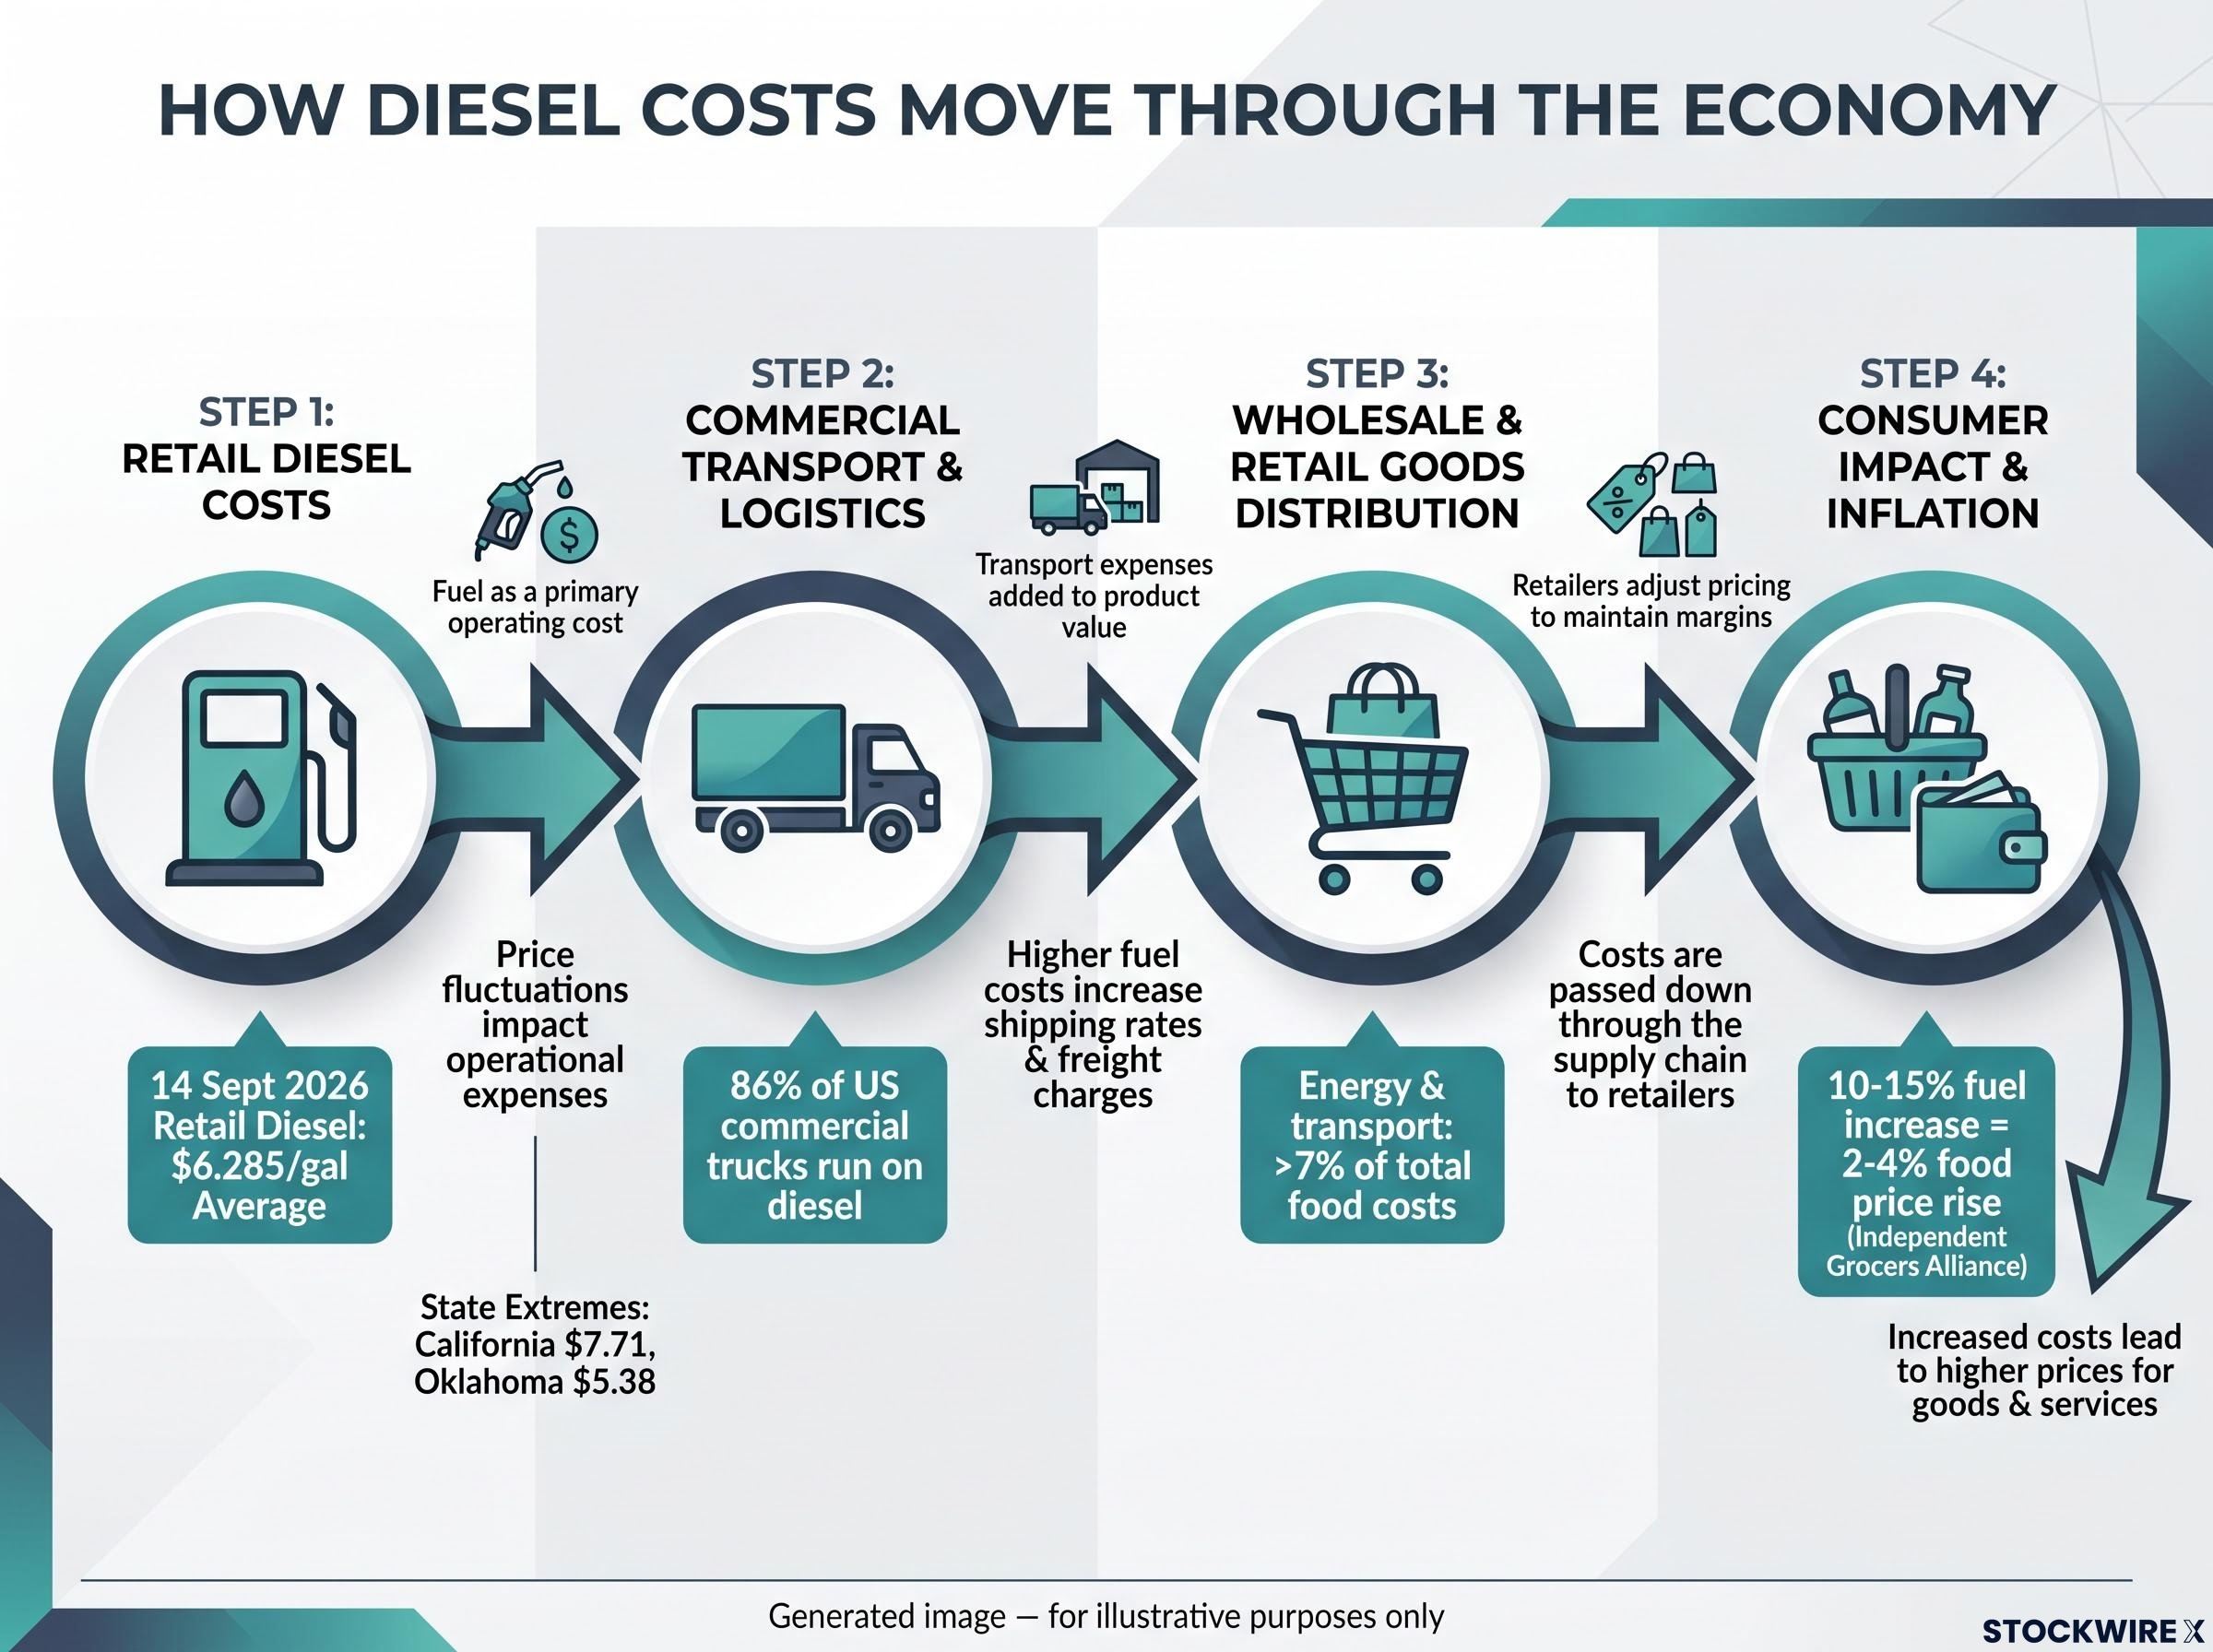
State-level disparities show how uneven the burden is: California’s average reached $7.71 per gallon while Oklahoma, the national low, sat at $5.38. For anyone who is not an oil investor, this is the reason a crude correction matters. It is not an energy sector story in isolation.
The geopolitical risk premium: what it is worth and when it expires
The bear case has one serious counterforce, and it is the reason the low-$60s call has no fixed date attached. Ongoing conflict in the Middle East and the war in Ukraine represent some of the largest supply disruptions in oil-market history, and roughly 400 million barrels of emergency stocks are currently cushioning the impact.
The specific pressure points are the maritime chokepoints. Disruption to the Strait of Hormuz or Bab el-Mandeb would override the supply math in the short term and send prices sharply higher. These risks are real, but they are not a permanent price support; they are a temporary premium sitting on top of a bearish structure.
The geopolitical risk premium sitting on top of crude has historically been difficult to size with precision; J.P. Morgan assessed the global oil market as oversupplied in September 2026 yet professional traders were pricing only around $2 per barrel of that premium despite active US-Iran tensions.
Horowitz frames a resolution to these conflicts as the anticipated catalyst for the price decline, the event that removes the fear premium and lets the forward curve’s $73 price become the new spot anchor.
That is the conditional worth holding onto. Once the premium comes off, the structural surplus is what takes over, and from there prices drift toward where the curve already sits.
The other upside risk is demand. The IEA projects global oil demand to rebound by roughly 2.5 to 2.6 million b/d in 2027. The EIA sees demand falling about 1.1 million b/d in 2026 before rising around 2.5 million b/d in 2027 toward 105-106 million b/d.
The factors that could delay or reverse the decline are worth watching directly:
- Geopolitical escalation at a major chokepoint
- A faster-than-expected demand recovery
- OPEC+ production discipline holding firmer than scheduled
The premium is not a reason to abandon the thesis. It is the variable that sets the timeline. Watching ceasefire developments and chokepoint security news is effectively watching the clock on when oversupply reasserts control of the price. Escalation extends the timeline; resolution compresses it.
Reading the market’s own signals before the headlines catch up
Put the three layers together and the bear case stops being a thesis to accept on faith and becomes a set of observable signals you can monitor yourself. All three are publicly available, and most retail observers never look at them.
- Forward curve structure. Watch whether the $34 backwardation narrows toward contango. The $73 one-year forward is the market’s current structural price estimate; a flattening curve signals the fear premium is deflating.
- Crack spread trend. Watch whether the 3-2-1 spread moves back from $66.69 toward its $10-20 historical range. This is the variable that governs pump prices, not the crude price itself.
- Geopolitical premium indicators. Watch ceasefire progress and chokepoint security. These developments determine the timing of any premium removal.
The distinction between crude relief and consumer relief is the one to keep front of mind. A crude drop to the low $60s would transmit to the pump only partially and with a lag, because crack spread normalisation is a separate and slower process. The two are connected but not equivalent.
There is genuine asymmetry here. The structural bear case is well supported by institutional forecasts, forward curve structure, and record crack spreads, but geopolitical tail risk makes the timing genuinely uncertain. Treat the low-$60s target as a conditional, not a scheduled event.
This article is for informational purposes only and should not be considered financial advice. Investors should conduct their own research and consult with financial professionals before making investment decisions. Past performance does not guarantee future results. Financial projections are subject to market conditions and various risk factors.
What comes next if the bear case plays out on schedule
If crude does settle into the low $60s on the back of surplus normalisation and geopolitical stabilisation, the immediate beneficiary is not the equity market. It is the American household currently paying $6.285 a gallon for diesel that moves nearly every good they buy.
The sequence matters. Crude relief comes first, then diesel crack spreads have to normalise from their extreme levels, and only then does the pump price begin to follow. The lag is the reason consumers may feel the barrel has fallen long before their fuel bill does.
That relief also carries its own expiry. The IEA expects demand to rebound by 2.5 to 2.6 million b/d in 2027, toward the 105-106 million b/d range the EIA projects.
A demand rebound of 2.5 to 2.6 million b/d in 2027 is the structural counterbalance that caps how far and how long the bear case can run.
The forward curve has already signalled the repricing. The question is not really whether prices fall, but which catalyst completes the move, and that gives you a concrete benchmark against which to judge how the story develops through 2026 and into 2027.
Structural supply lags mean that even a confirmed ceasefire does not immediately restore physical barrel flows: mine-clearing, port repairs, tanker rescheduling, and war-risk insurance reset timescales run weeks to months behind the diplomatic headline, which is why ING analysts place the near-term floor at $75-$85 per barrel even in a resolution scenario.