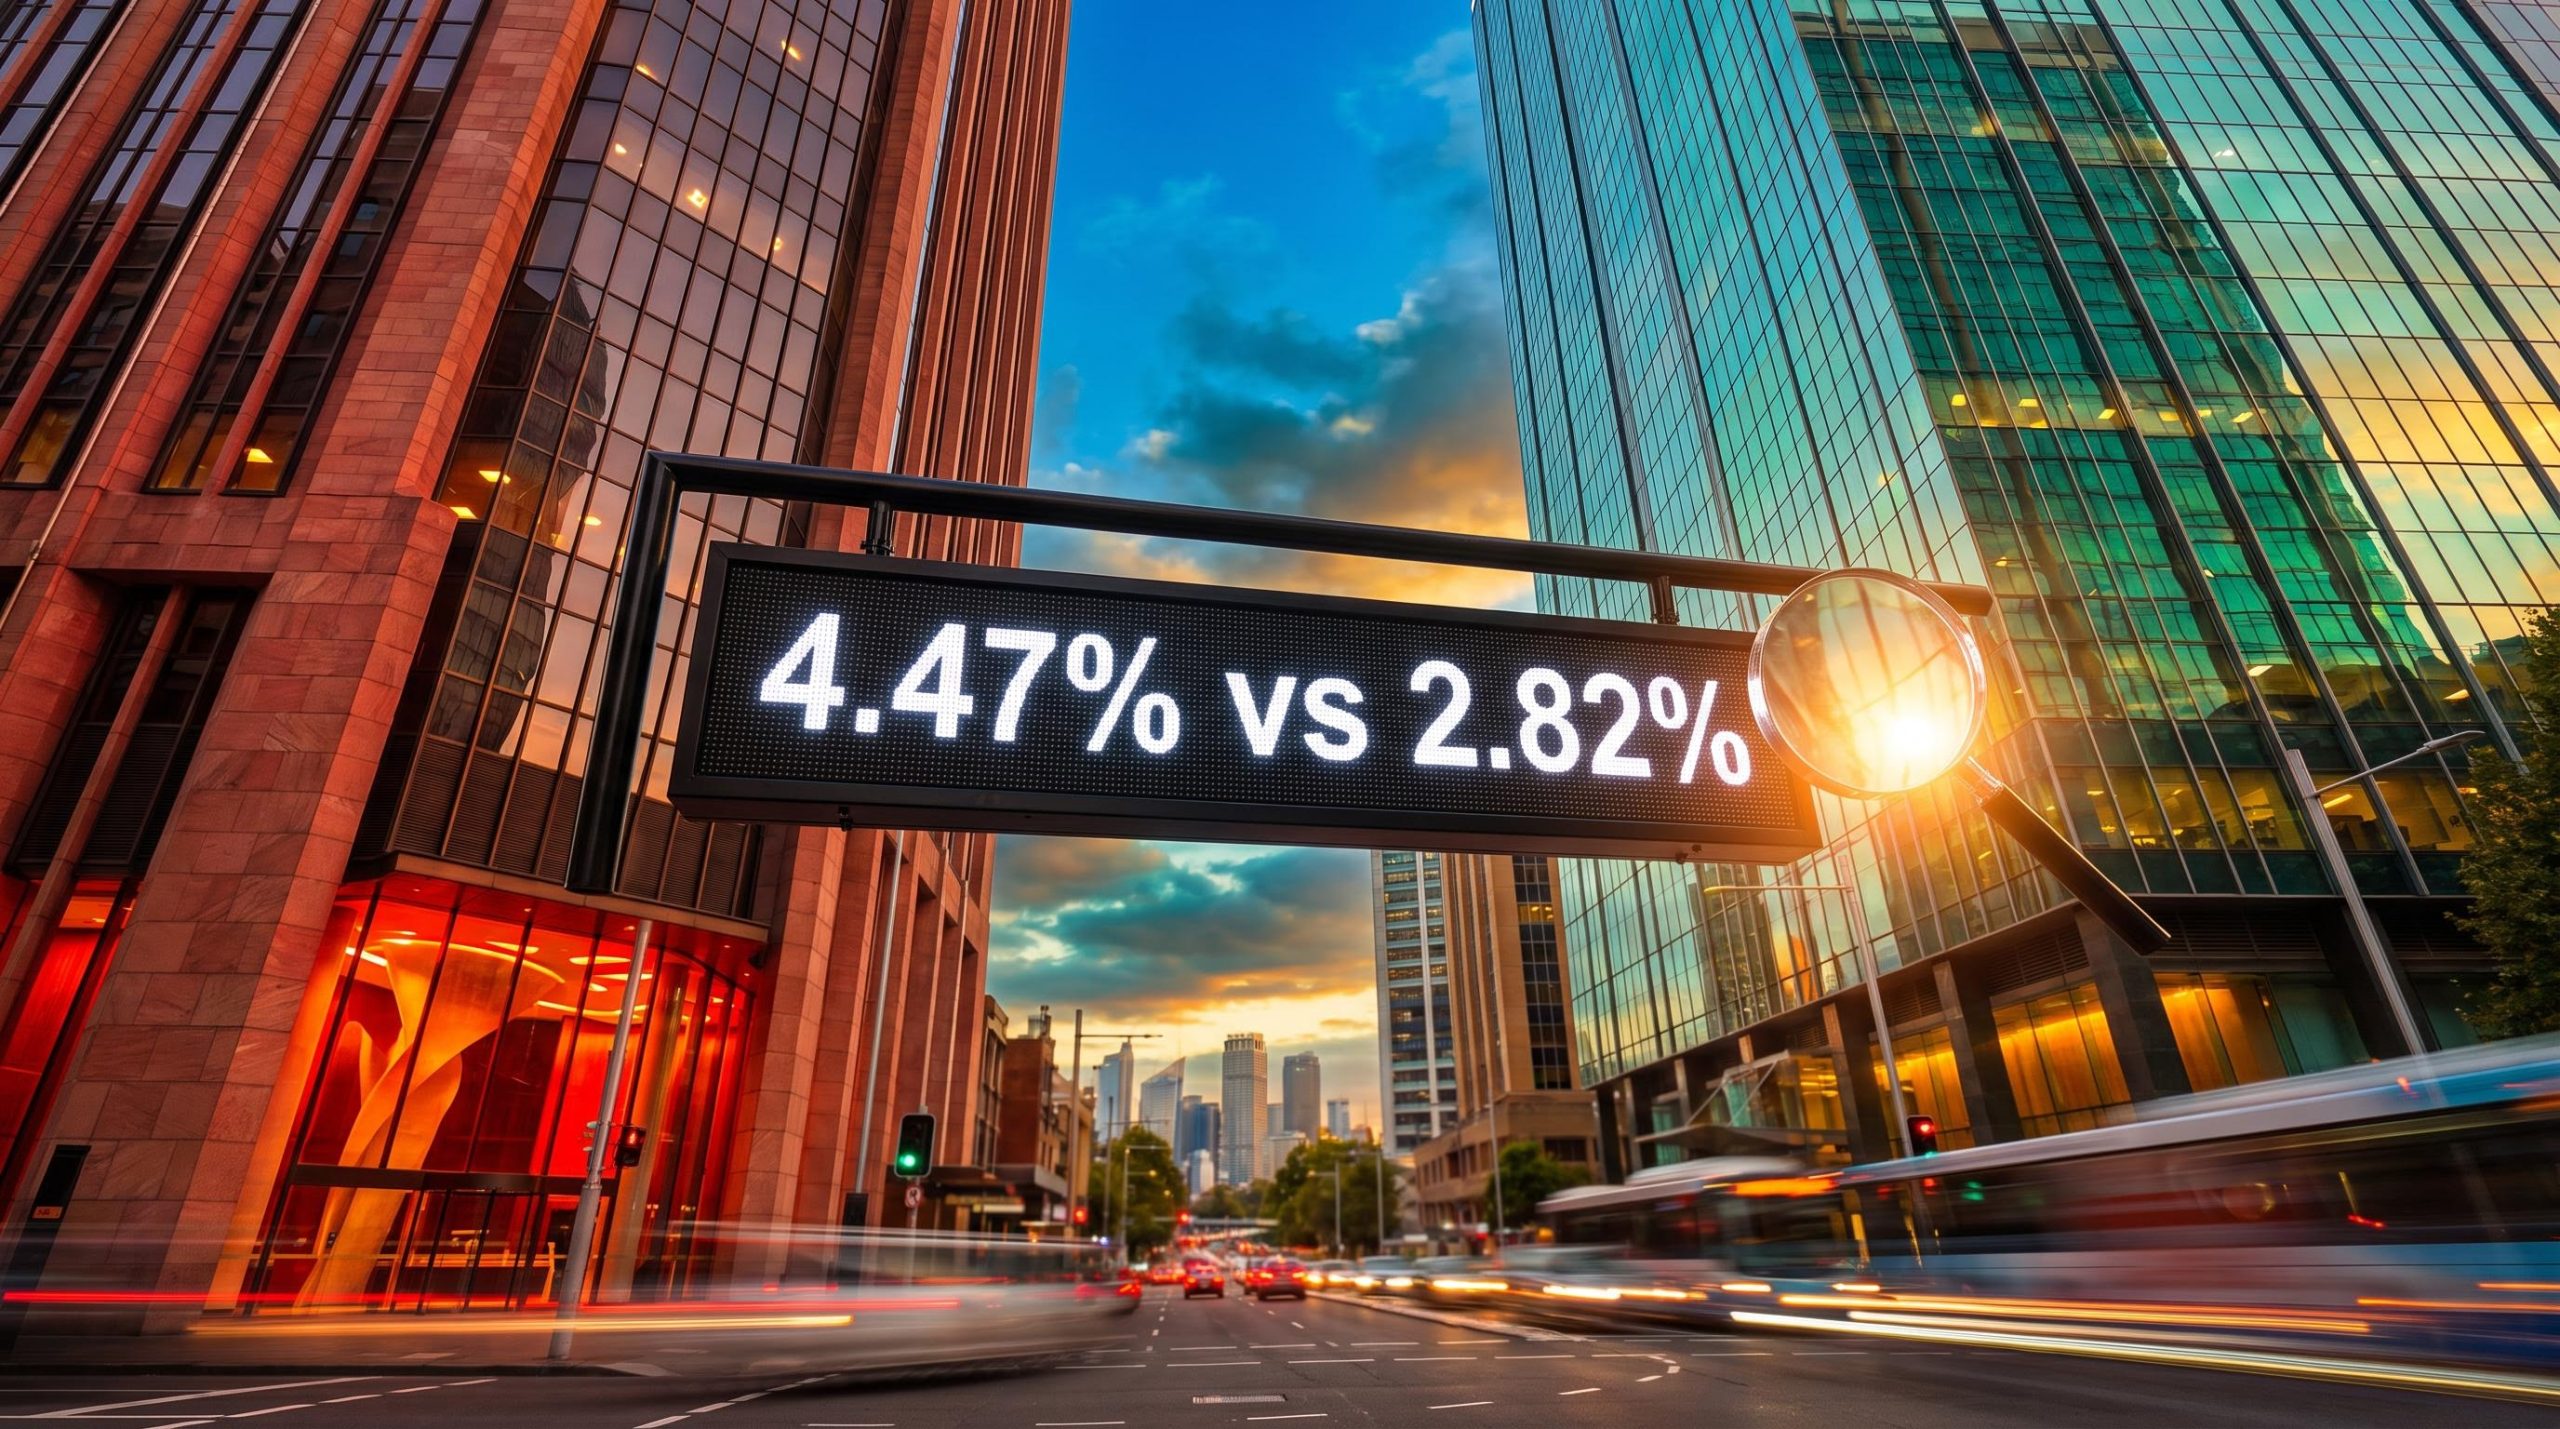
Most income investors assume the higher yield is the safer bet. This year, that assumption has been expensive. Westpac is down about 8.8% year to date, while Macquarie Group has climbed about 24%, even though Westpac pays a 4.47% fully franked yield against Macquarie’s 2.82% at 35% franking.
That gap is the centre of the Westpac vs Macquarie debate in October 2026. One stock is a domestic lender built for steady dividends. The other is a diversified global investment group whose share price has rewarded growth over income.
The timing matters. Westpac reports its full-year result and final dividend on 2 November 2026, so the next piece of hard evidence is less than four weeks away.
Here is how each stock tends to suit a different kind of investor, and the trade-offs hiding behind the headline numbers. The lean discussed below belongs to one market commentator and is opinion only, not a recommendation or personal financial advice.
Westpac vs Macquarie: how do the numbers stack up in October 2026?
Start with the scoreboard, before any explanation gets in the way.
| Metric | Westpac (WBC) | Macquarie (MQG) |
|---|---|---|
| Share price | $34.66 | $250.02 |
| Market capitalisation | $118.55bn | $95.92bn |
| P/E ratio | 16.97 | 19.58 |
| Earnings per share | $2.029 | $12.669 |
| Dividend yield and franking | 4.47%, fully franked | 2.82%, 35% franked |
| Year-to-date return | -8.78% | +24.12% |
Figures are as at 7-8 October 2026 and will move. Other sources from the same dates show the same pattern, with Westpac down roughly 8-12% and Macquarie up roughly 24-25% year to date, so small differences reflect data source and timing.
The split is clean. Westpac is the bigger company by market capitalisation, yet it is the cheaper one on earnings. Macquarie is smaller, pricier and moving faster.
The price-to-earnings (P/E) ratio is the share price divided by a company’s annual earnings per share. It tells you how many dollars investors pay for each dollar of profit. Westpac trades on about 17x; Macquarie on about 19.6x.
That gap is the market’s price tag on growth versus income.
When you pay the higher multiple for Macquarie, you are betting its earnings keep expanding fast enough to justify it. Westpac’s lower multiple and higher yield work the other way: they are your compensation for accepting slower earnings. Neither stock is simply cheap or expensive without that context, which raises the obvious question of what is driving the divergence.
When big ASX news breaks, our subscribers know first
What explains Macquarie’s 30% profit surge and Westpac’s slower grind?
The answer sits in the profit numbers. Read them in order, and the share price gap stops looking like a surprise.
Macquarie: growth with a cyclical tailwind
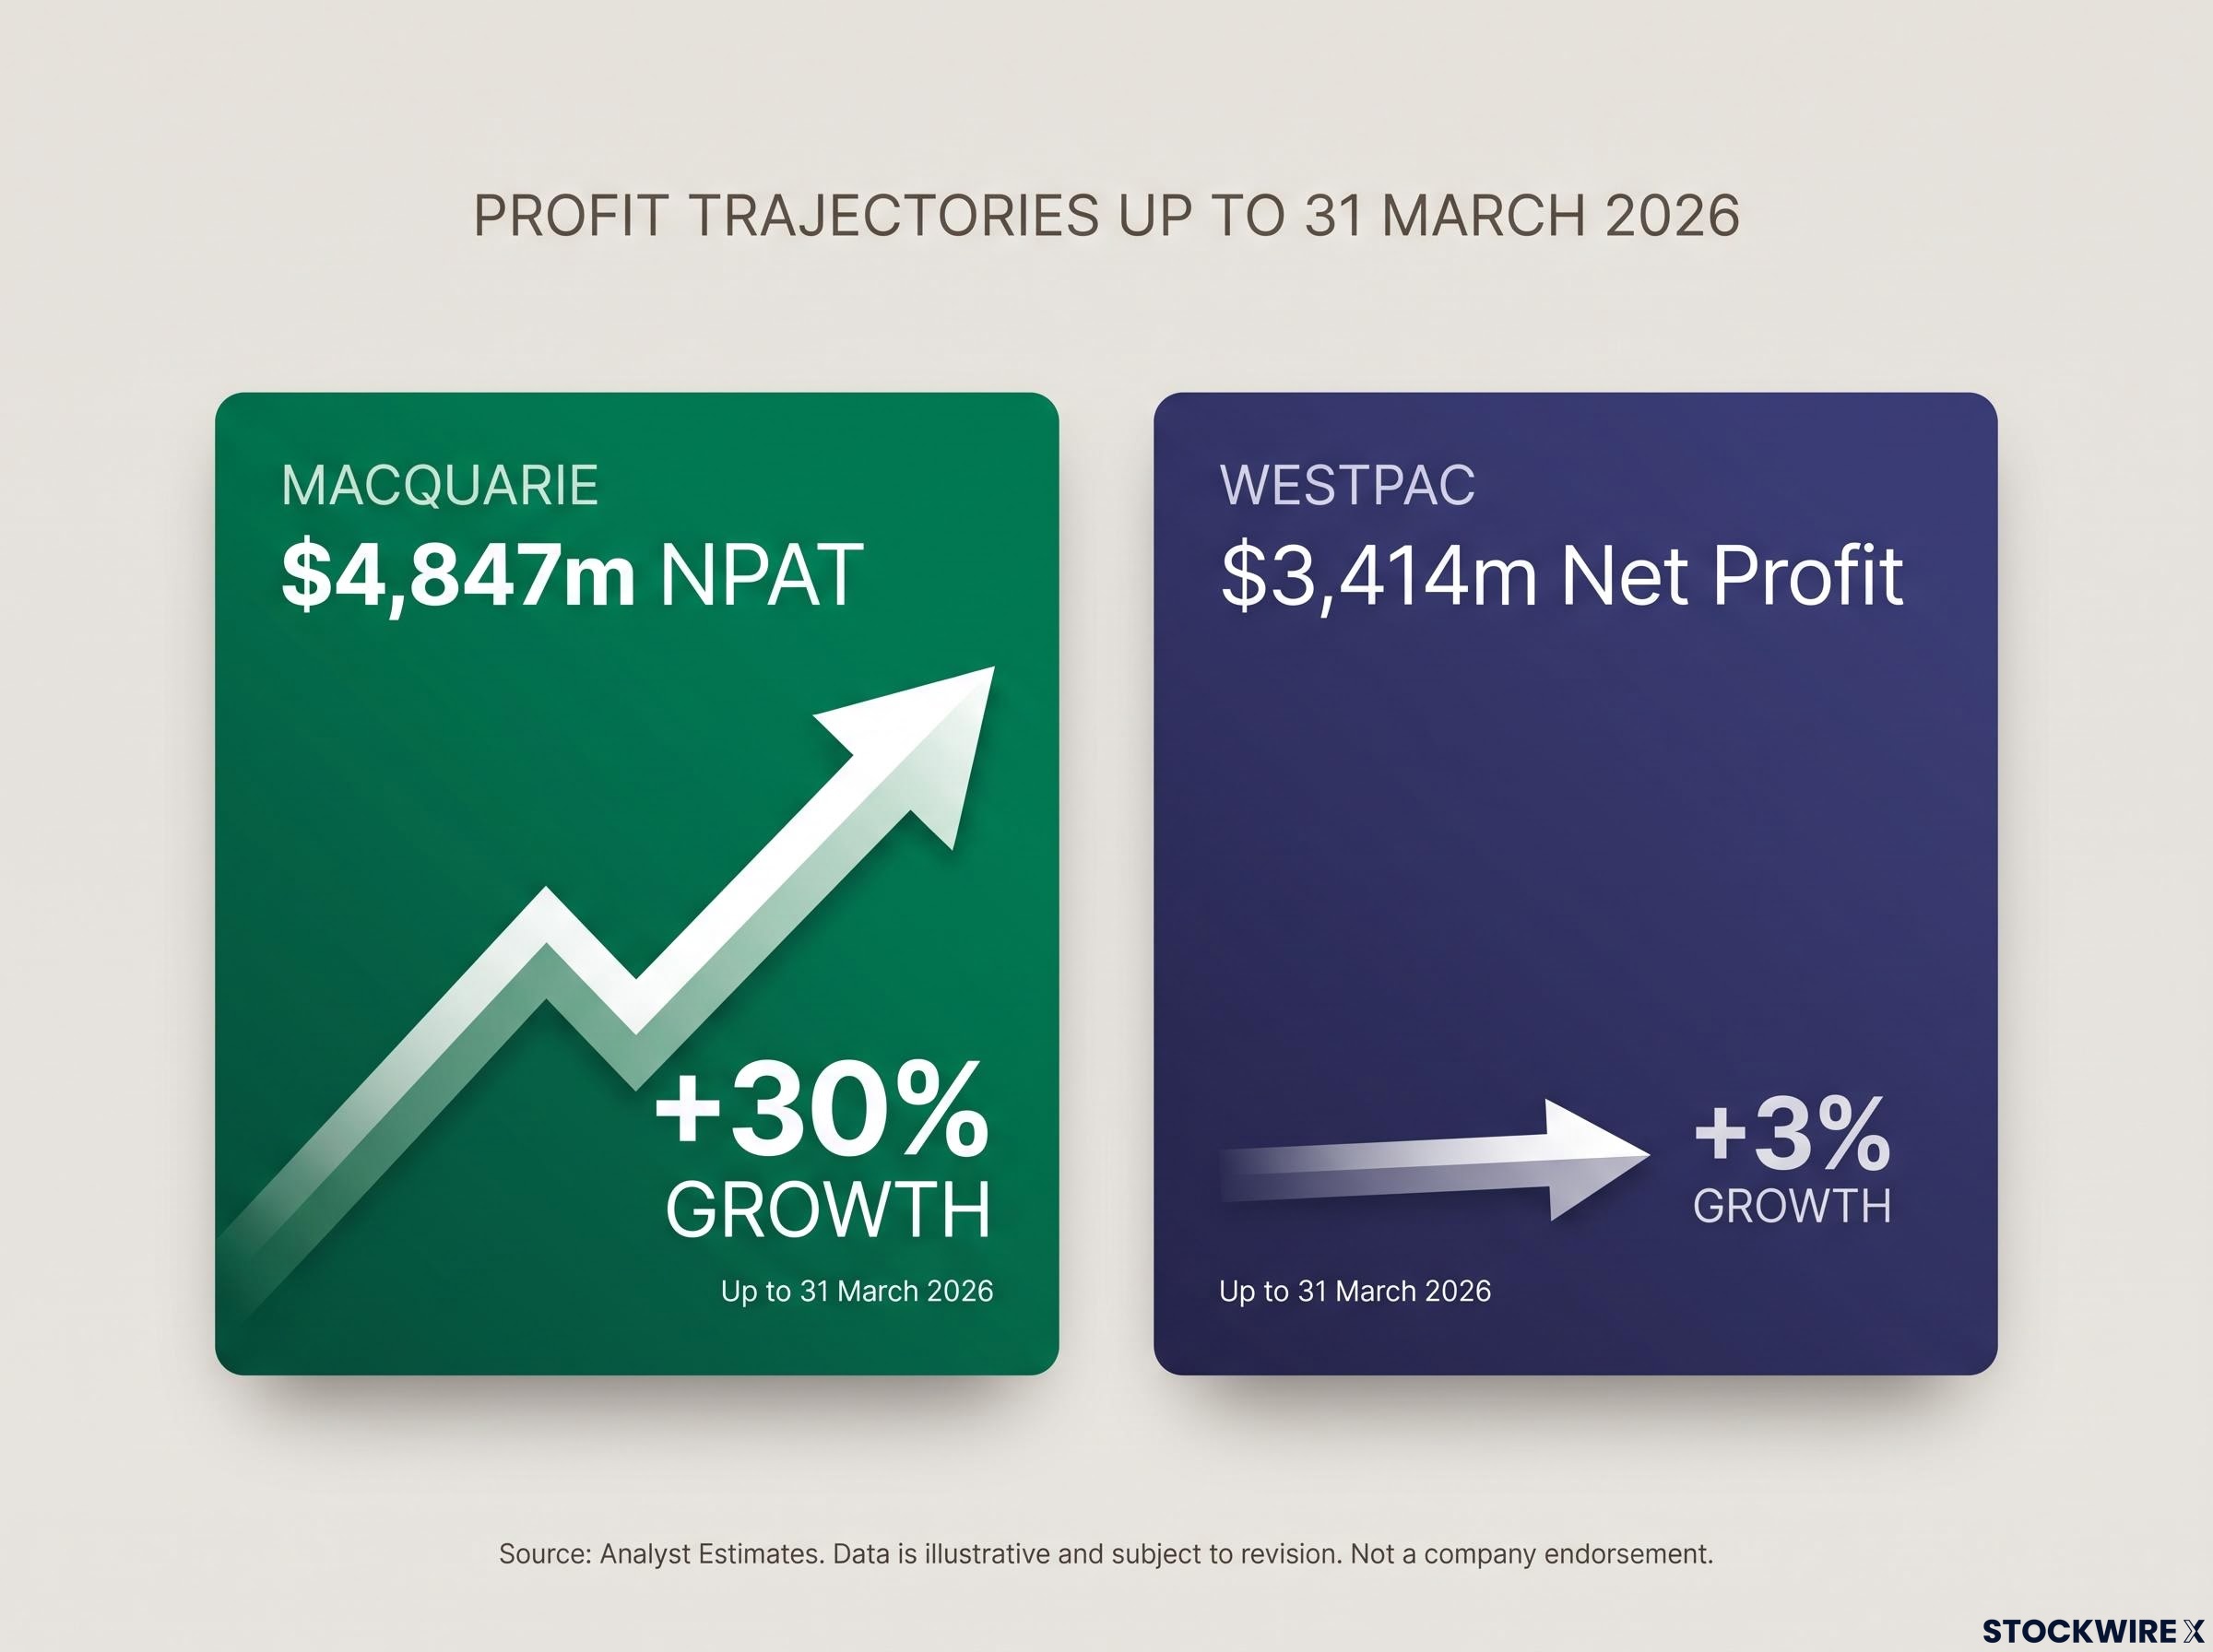
Macquarie’s full-year result for FY26, covering the year to 31 March 2026 and announced on 8 May 2026, was its strongest in years:
- Net profit after tax of $4,847m, up 30%
- Operating group contribution of $9,924m, up 36%
- Net operating income of about $19.48bn, up 13%, with earnings per share of $12.77
- A record second-half profit of $3,192m
Dividends followed, rising to $7.00 for the year (35% franked) from $6.50 in FY25 on a 55% payout. At its 23 July 2026 update, the group reported a common equity tier 1 (CET1) ratio of 12.8%. CET1 measures a bank’s highest-quality capital against its risk-weighted assets, so a higher figure means a thicker safety buffer.
The diversified mix of asset management, infrastructure, commodities and markets explains the premium multiple. Yet not all of this growth is structural: Investing.com’s summary of the results presentation attributes the surge partly to strategic asset divestments, and buoyant markets helped too. Asset sales and strong trading conditions do not arrive on schedule every year.
Macquarie’s record FY26 profit was broad-based, with all four operating groups posting double-digit growth and Commodities and Global Markets surging 49%, though the 93% second-half jump shows how back-ended the result was.
Westpac: steady income, squeezed margins
Westpac’s first half of FY26, also to 31 March 2026, told a quieter story:
- Net profit of $3,414m, up 3% year on year but down 5% on the $3,599m earned in the previous half
- Net interest margin (NIM) of 1.89%, down 6 basis points
- A 77c fully franked interim dividend
- A third-quarter profit of about $1.8bn excluding notable items
NIM is the gap between what a bank earns on loans and pays on deposits, expressed as a percentage of its lending assets. When it narrows, each dollar lent generates less profit.
The earnings gap in one line Macquarie grew full-year profit 30%. Westpac grew half-year profit 3% on the prior year, and went backwards on the previous half.
Westpac’s profit is stable rather than shrinking. It is simply not growing fast enough to excite the market. For you, the share price gap tracks earnings momentum closely, and the real question is whether Macquarie’s record half is repeatable.
Franking, business models and what 4.47% versus 2.82% really means
Here is the puzzle. A 4.47% yield against 2.82% looks like a clear gap, but after tax it can be wider or narrower depending on who you are.
The reason is franking. A franking credit is a tax credit attached to a dividend, representing company tax of 30% already paid on that profit. Australian investors can use these credits to reduce their own tax bill, and some receive any excess as a cash refund.
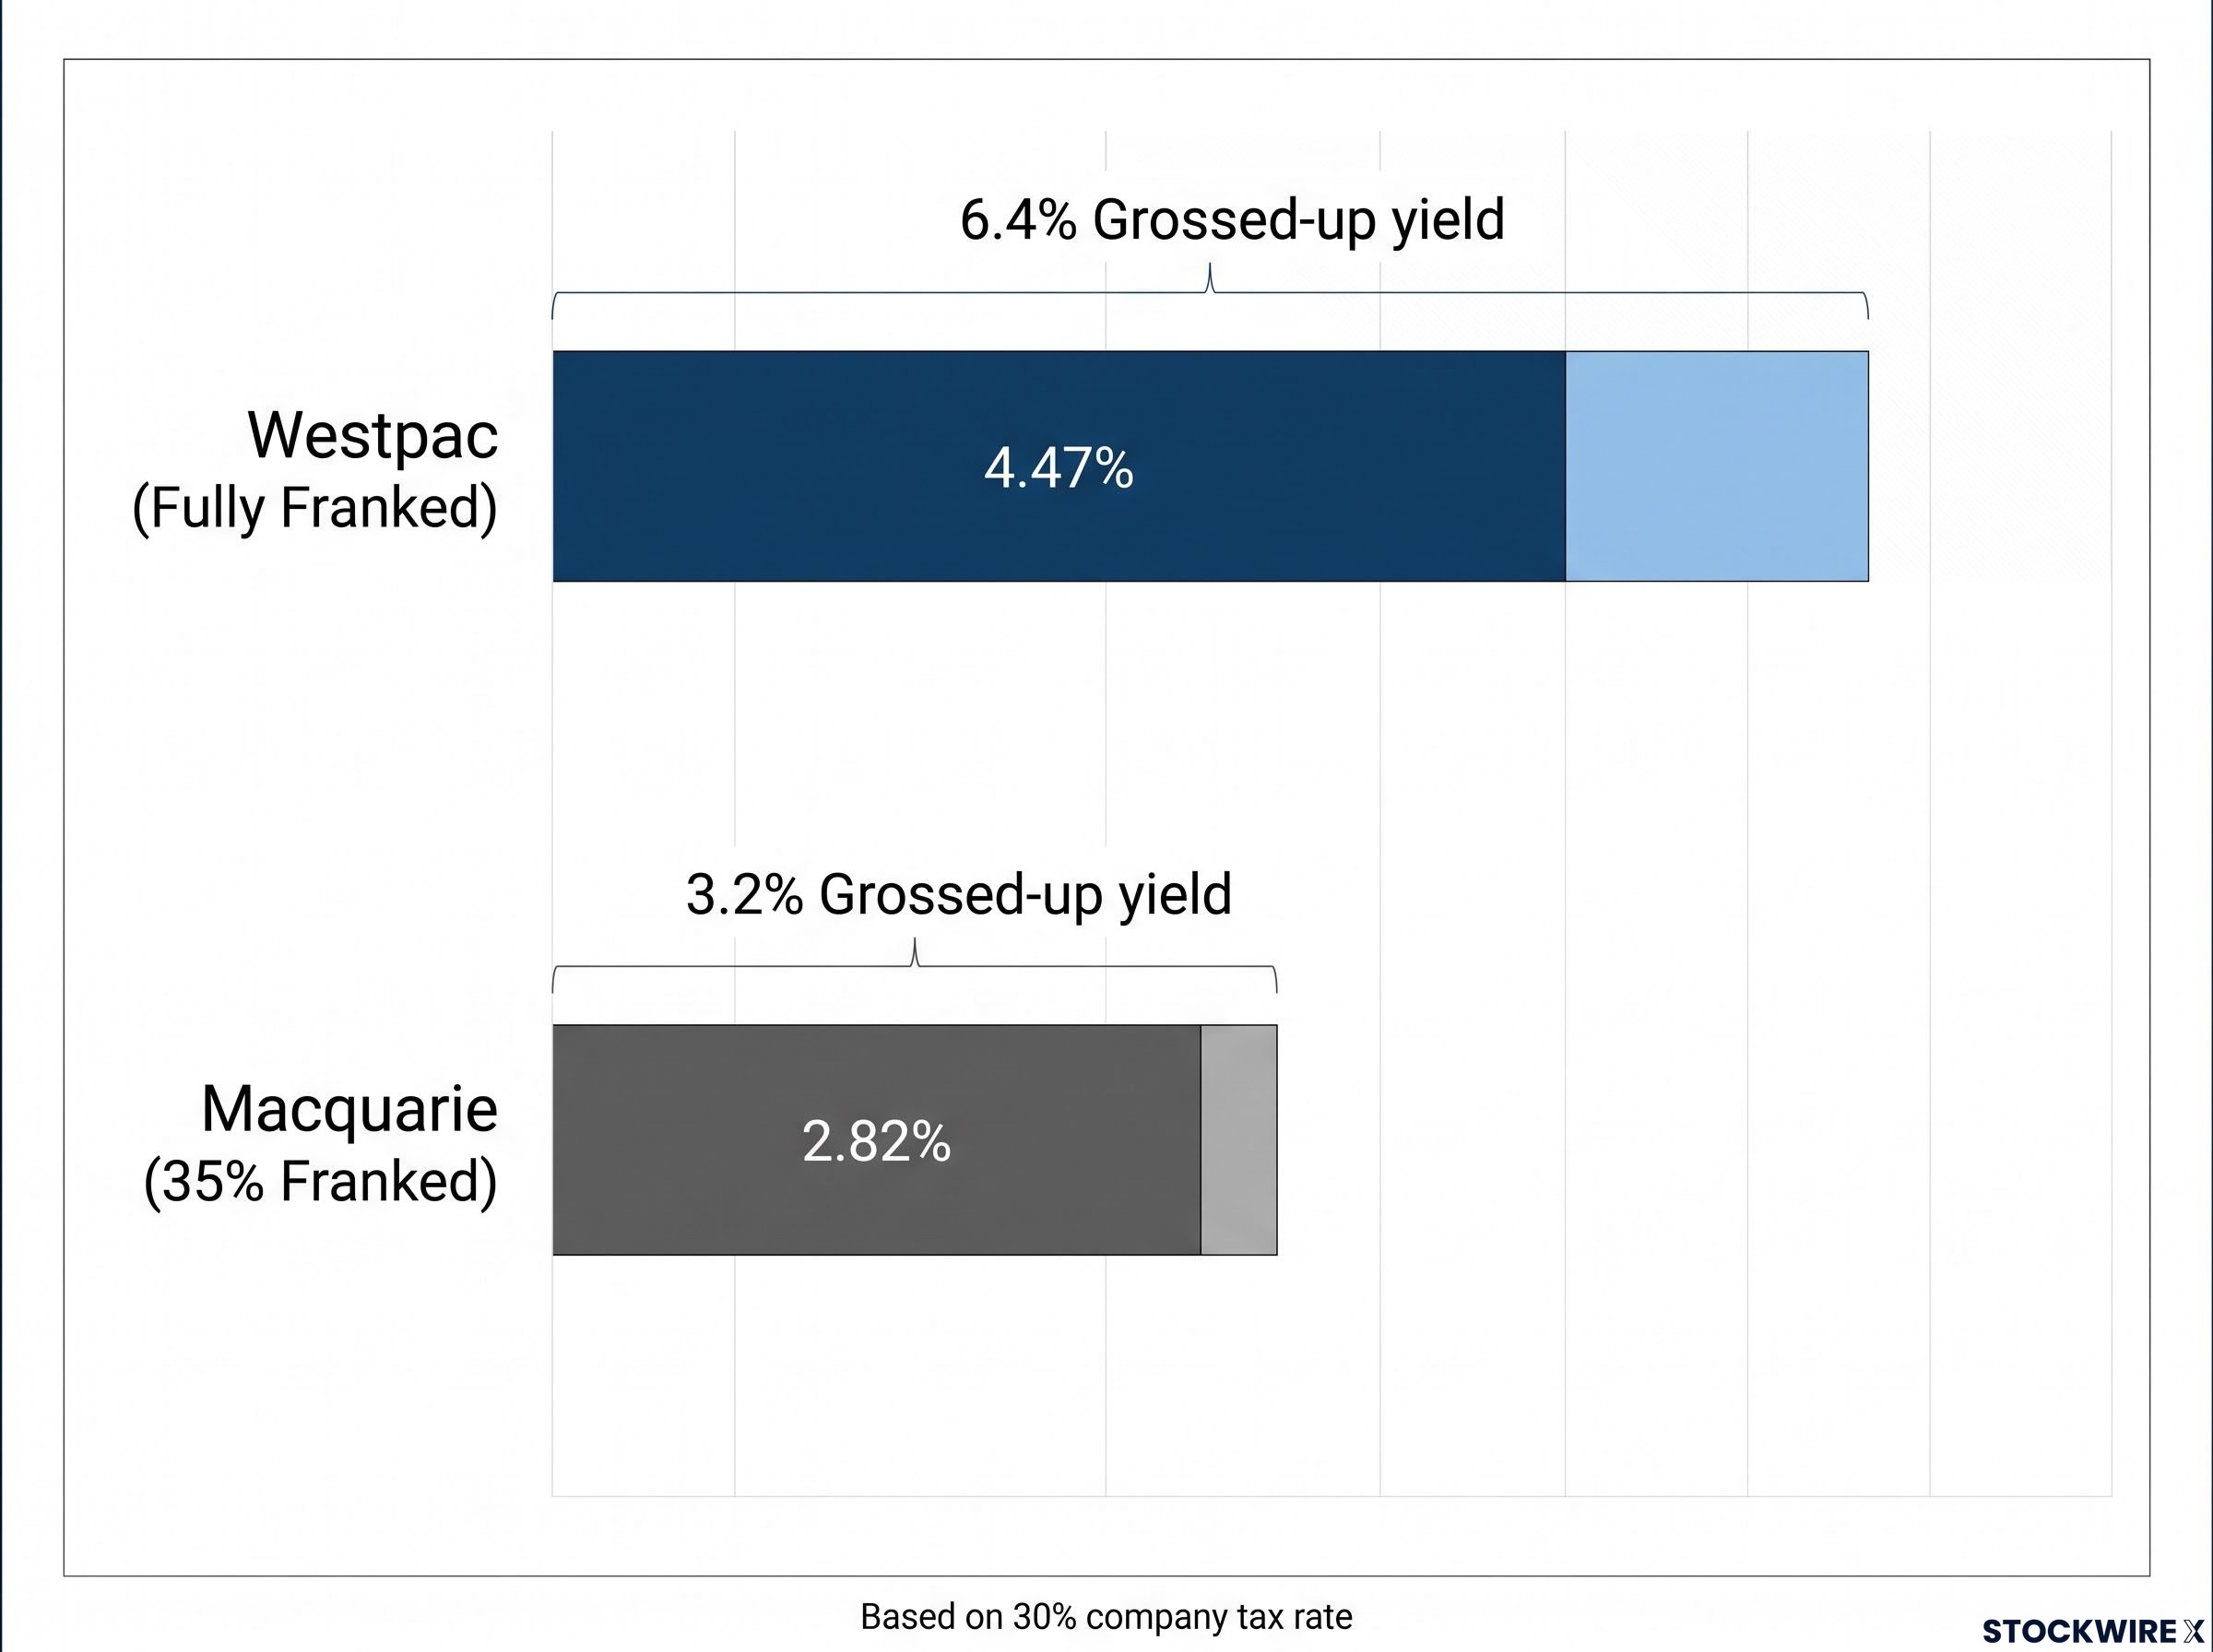
Westpac’s dividends are fully franked, including the 77c interim paid on 26 June 2026. Macquarie’s $7.00 carries franking on only 35% of its value.
Working from the stated yields and the 30% company tax rate, Westpac’s grossed-up yield (the dividend plus its franking credit) comes to about 6.4%. Macquarie’s works out to about 3.2%. Those figures are approximate and only matter fully if you can use the credits.
The 30/70 formula behind a grossed-up dividend entitlement explains why a fully franked payout is worth materially more to a pension-phase SMSF than its cash amount suggests, since the ATO refunds the credit in full.
Who benefits most from franking:
- Pension-phase SMSFs, which pay no tax and receive credits as refunds
- Retirees on low or zero tax rates
- Other low-tax-rate Australian investors
Who benefits less:
- Higher-tax individuals and accumulation-phase funds, where credits offset tax but are less potent
- Some foreign investors and certain institutions that cannot use the credits
The key takeaway Franking value depends on the investor, not the stock. Your tax position matters as much as the headline yield.
If you sit in pension phase, Westpac’s income lead is at its widest. If you cannot use franking, the gap shrinks towards the raw yields, and total return starts to tilt the comparison towards Macquarie.
Westpac’s next dates are its result on 2 November 2026, an ex-dividend date of 5 November 2026, and payment on 21 December 2026.
How the two business models differ
Westpac, founded in 1817 as the Bank of New South Wales, runs brands including St.George, BankSA and BT. Its earnings come from mortgages, deposits and business lending, which makes it sensitive to domestic competition and margin pressure.
Macquarie operates in 34 markets across infrastructure, asset management, commodities and investment banking. Fee and markets income can offset weakness elsewhere, though it brings more volatile results.
Which investor profile suits which stock, and what could go wrong?
With the mechanics in place, the matching becomes clearer. Many investors hold both, using each for a different job.
| Investor profile | Westpac fit | Macquarie fit |
|---|---|---|
| Retiree or pension-phase SMSF | Strong: fully franked income core | Supplementary income and growth, not a yield anchor |
| Growth-oriented investor | Defensive ballast, slower capital growth | Strong: global growth exposure, higher volatility |
| Balanced portfolio | Income anchor | Growth and diversification engine |
Each case still has to survive a stress test.
Risks to the Westpac case
- Margin and competition: earnings lean heavily on NIM, and the slip against the prior half suggests pressure that could limit dividend growth.
- Credit exposure: housing and small business lending tie returns to the domestic credit cycle.
- Limited reinvestment: a high payout leaves less to fund growth, and at about 17x earnings the stock is not priced as distressed.
Risks to the Macquarie case
- Cyclical earnings: divestments and markets income drove part of FY26, and the record second half may not repeat.
- Valuation stretch: the 19.6x multiple could compress if growth slows, and diversified groups have historically suffered larger drawdowns in stress periods.
- Partial franking: only 35% franked, which blunts the appeal for tax-advantaged income investors.
The Motley Fool Australia author who compared the pair on 8 October 2026 leans towards Macquarie for October on momentum and growth, while seeing Westpac as a reasonable watchlist name for pure income. That is one commentator’s opinion, not a recommendation. Which stock suits you depends on your tax position, income needs and tolerance for drawdowns, and Macquarie’s momentum sets a higher bar to keep delivering. Consider your own circumstances or seek licensed advice.
Weighing income against growth before Westpac’s 2 November result
The trade-off is plain. Westpac offers higher, fully franked income with slower earnings growth. Macquarie offers stronger growth and momentum, paid for with a higher multiple and lighter franking.
The lean towards Macquarie for October 2026 remains one author’s opinion. Many investors sidestep the either-or choice by holding both, weighted to suit their tax status and risk tolerance.
The next decision point arrives on 2 November 2026, when Westpac’s full-year result and final dividend will show whether margins have steadied. Macquarie’s next update will test whether its record half was a peak or a platform.
For investors wanting to weigh both stocks against the rest of an income portfolio, our full explainer on building an ASX dividend portfolio shows how payout ratios and sector buckets support a sustainable yield.
This article is for informational purposes only and should not be considered financial advice. Investors should conduct their own research and consult with financial professionals before making investment decisions. Past performance does not guarantee future results.