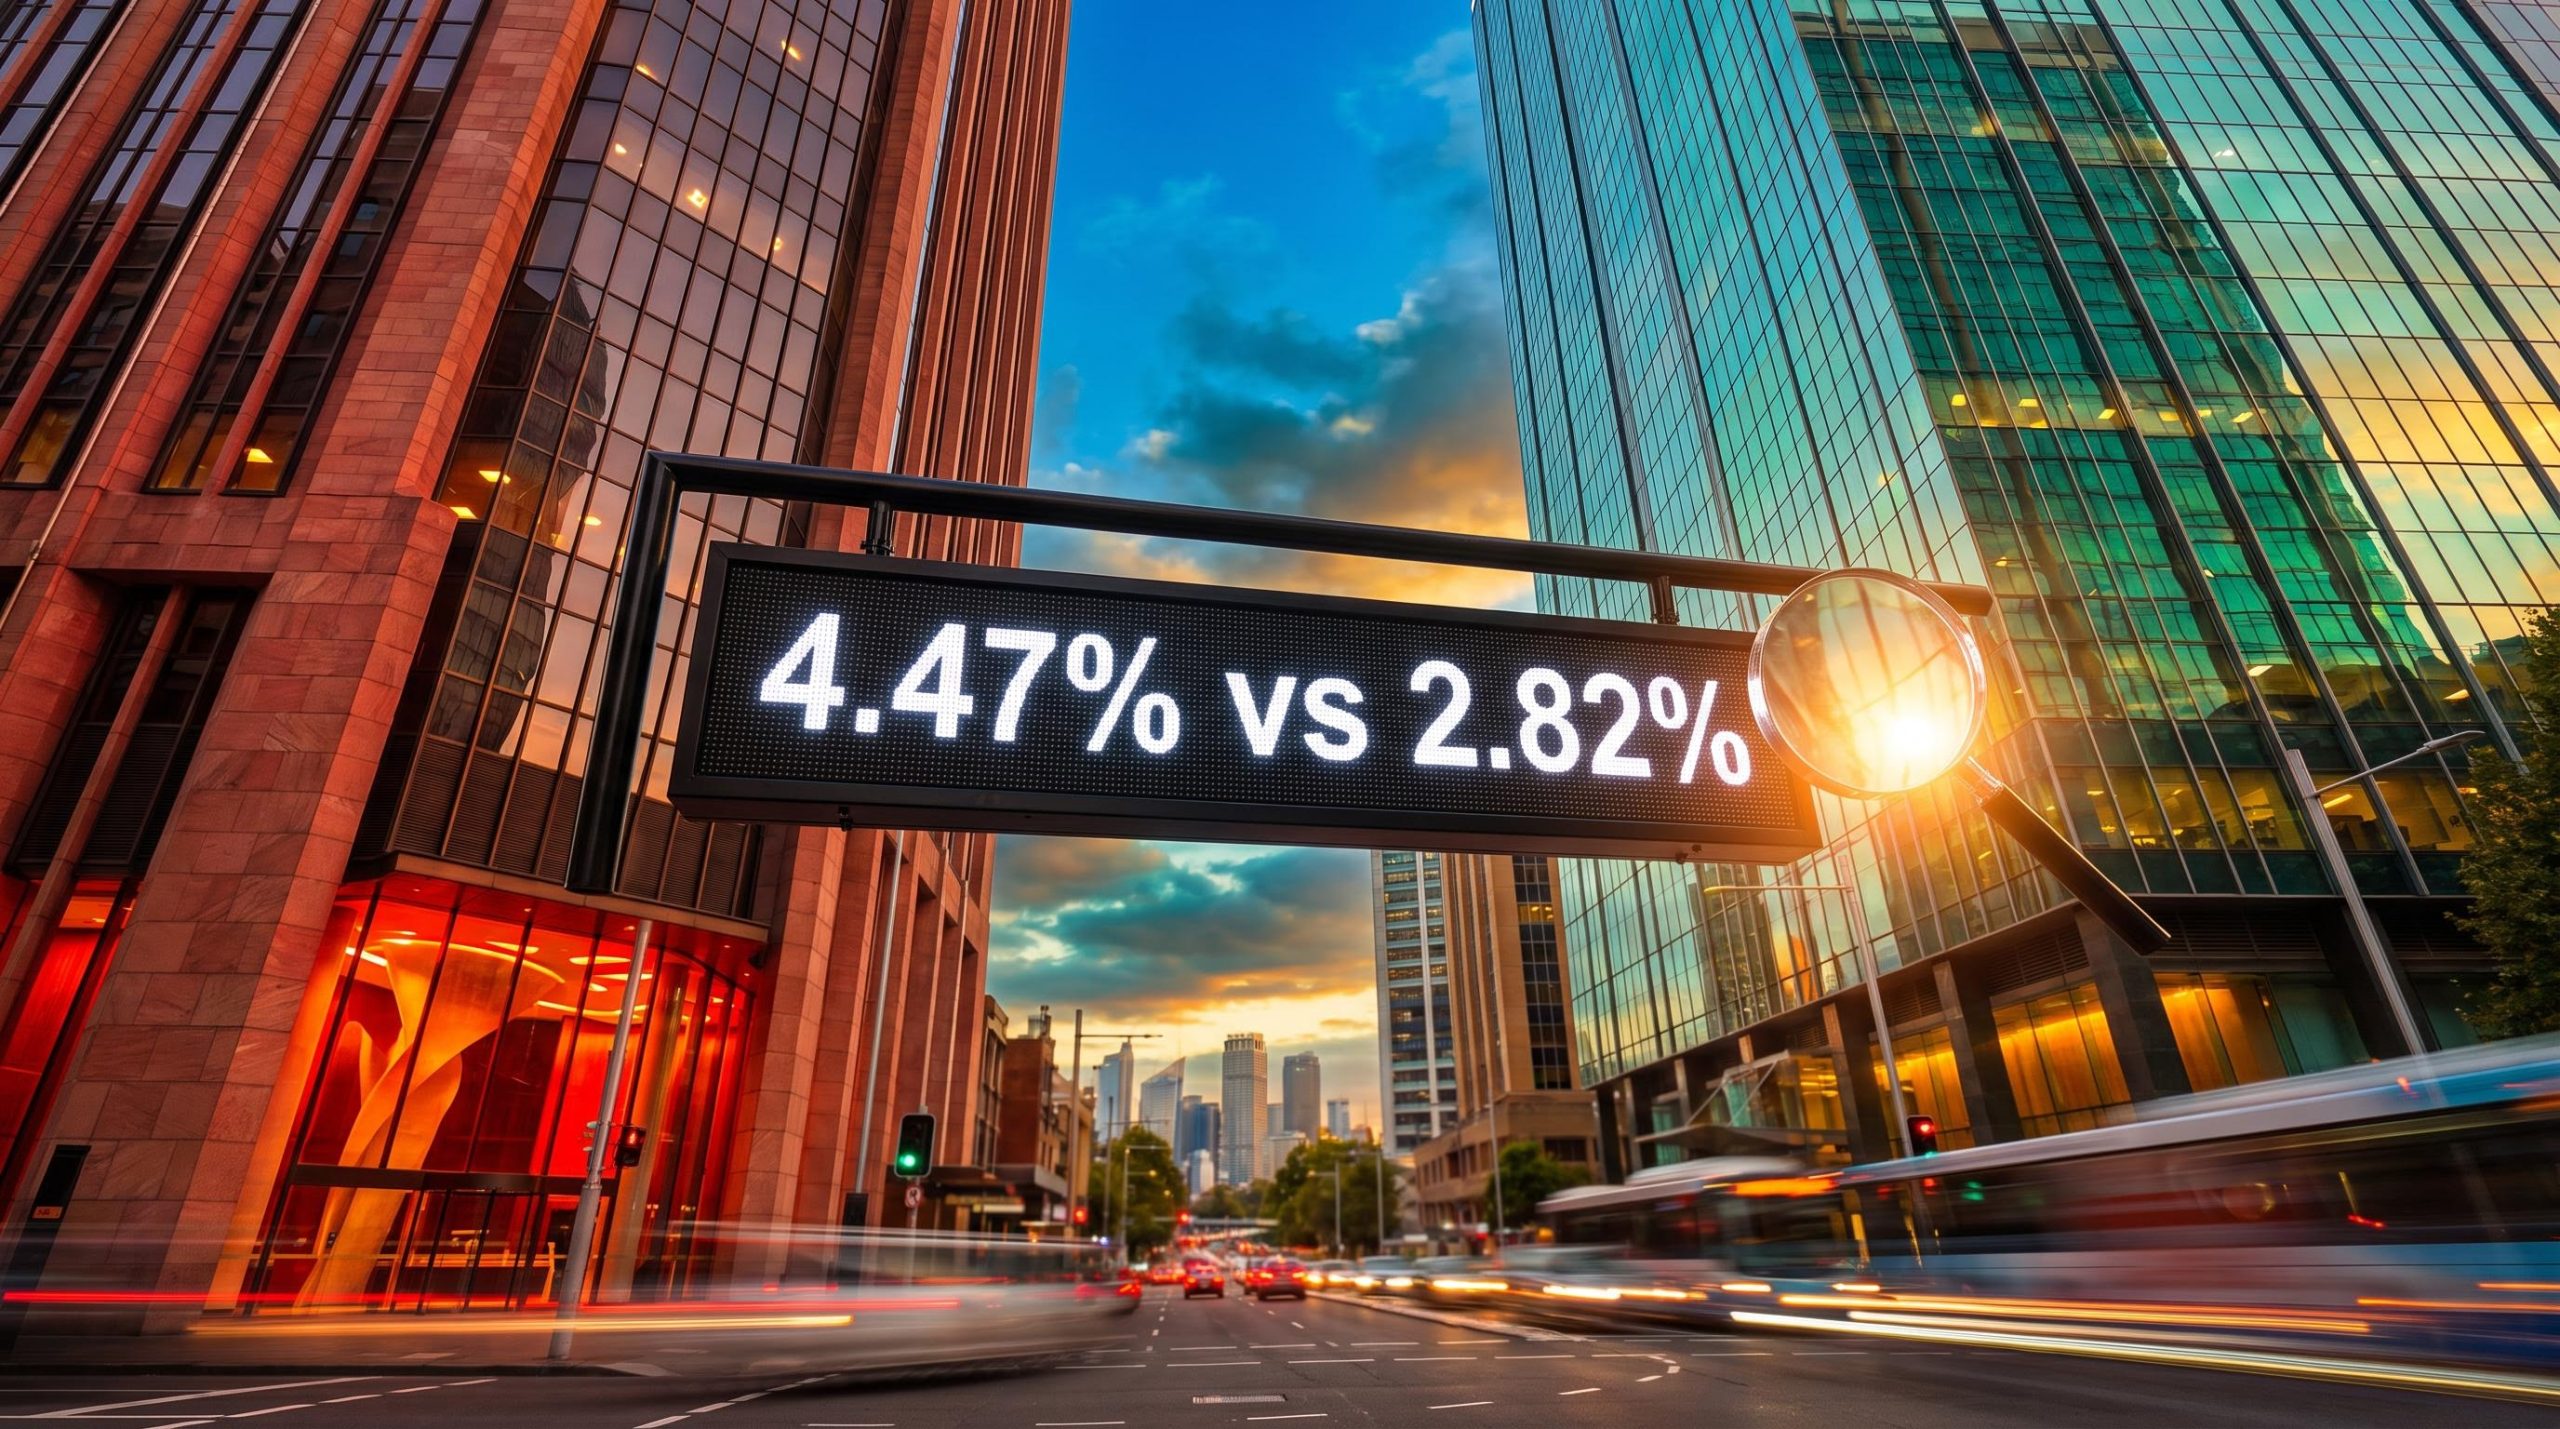
The US Dollar Index (DXY) eased in Thursday’s Asian session, but the pullback stalled above 102, only a fraction below the 102.54 peak set on 5 October 2026, its highest level since April 2025. That is the detail worth noticing: a dip happened, yet nothing about it looks like the rally ending.
Several forces are pushing in the same direction. The Federal Reserve is leaning hawkish, energy prices remain elevated, and geopolitical risk is drawing money toward safe-haven assets. Each one would support the currency on its own. Together, they make US Dollar Index strength harder to dislodge than a single headline might suggest.
That matters even if you never trade currencies. The dollar’s direction shapes what your foreign shares are worth in dollar terms, how commodities are priced and how gold behaves.
Here is a framework for judging whether dips in the dollar are likely to be bought, and the signals that would tell you the picture has changed.
Why is the Fed keeping the dollar bid?
The fresh catalyst arrived on 7 October. Minutes from the September meeting of the Federal Open Market Committee (FOMC), the Fed body that sets interest rates, showed most participants judged another rate increase likely to be appropriate by year-end.
From the September FOMC minutes Most participants saw a further hike as likely appropriate by year-end, with inflation risks skewed to the upside, including from higher energy prices.
That followed a unanimous 12-0 vote on 15-16 September to lift the federal funds target range by 25 basis points to 3.75%-4.00%. A basis point is one hundredth of a percentage point. TradingEconomics said on 5 October that rising oil prices had reinforced expectations that the Fed would need to stay “tighter for longer”.
With inflation risks skewed to the upside, the Fed’s dual mandate points toward price stability as the dominant objective, which is why further tightening is on the table.
Markets now treat a December hike as the base case, although the exact odds depend on the source. The original FXStreet report cited roughly 80%, while later research using CME FedWatch put the cumulative probability at around 68-70.5% in early October. Both numbers point the same way.
| Item | Value | Date |
|---|---|---|
| Fed funds target range | 3.75%-4.00% | After 15-16 September 2026 |
| FOMC vote | 12-0 | September 2026 |
| December hike odds | ~68-80% (source dependent) | Early October 2026 |
| US 10-year yield | ~5.30% | 7 October 2026 |
| US 30-year yield | ~5.69% | 7 October 2026 |
Treasury yields are where Fed expectations reach the currency. With yields near multi-year highs, holding dollar assets pays more than holding many alternatives, so foreign capital keeps flowing in. Watch yields as the mechanism, not as background noise. Weekly jobless claims and comments from FOMC members are the data most likely to shift them in the near term.
When big ASX news breaks, our subscribers know first
How do energy prices, US growth and Iran risk reinforce each other?
The Fed story would carry the dollar some distance on its own. It gets more lift because two other forces are pushing the same way.
Strategists at Brown Brothers Harriman argue that high energy prices and US economic outperformance favour the dollar over the currencies of energy importers. Persistent energy costs keep inflation, policy rate and bond yield risks tilted upward, a mix that hurts importers more than the US.
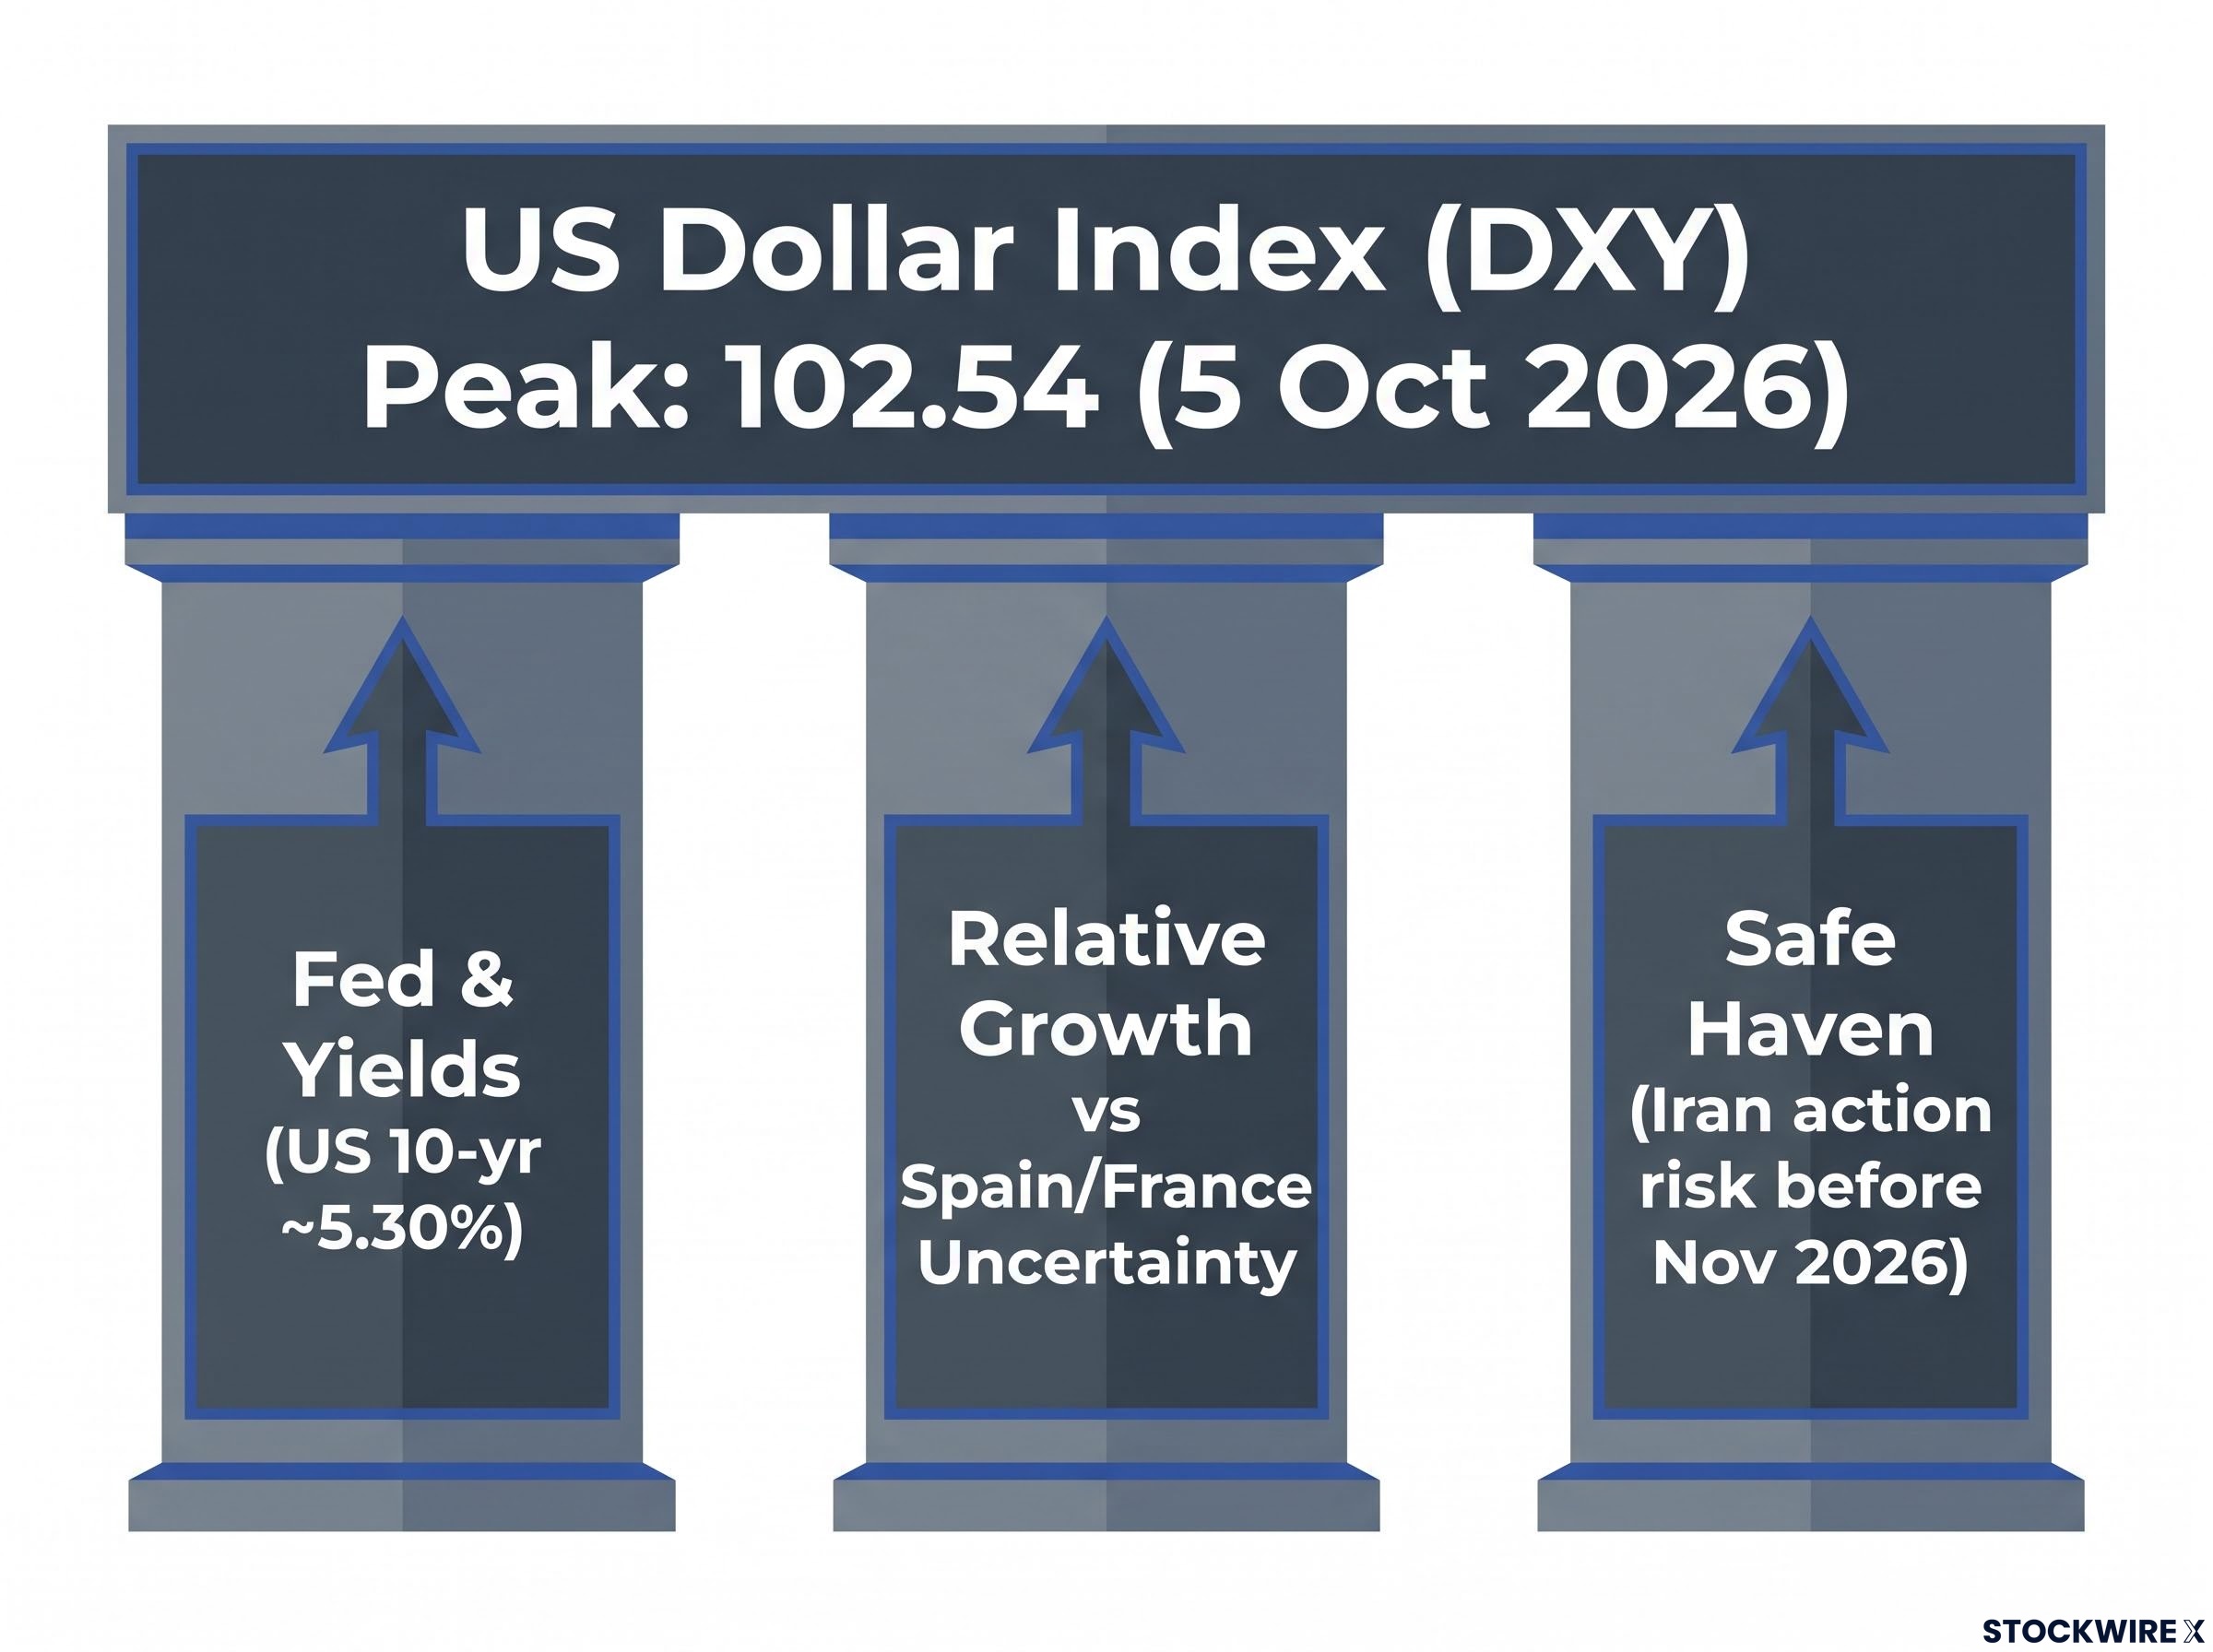
Europe adds a second layer. TradingEconomics links part of the dollar’s climb to euro weakness driven by political uncertainty in Spain and France. MarketWatch, noting the dollar touched 102 for the first time since April 2025, pointed to rising Treasury yields and US resilience.
Then there is Iran. The Pentagon reportedly told Central Command (CENTCOM) to finalise preparations for resuming major combat operations, and US and Israeli sources indicated action could come before the November 2026 midterms. Safe-haven demand tends to favour the dollar when such risks rise.
Global yield pressure confirms this is not only a US story. The UK 30-year gilt yield moved above 6% on 1 October, its first time there since early 1998.
- Fed and yields: weakens if US data softens and December hike odds fall.
- Energy-driven inflation: weakens if oil reverses or Middle East tensions ease.
- Relative growth and safe-haven demand: weakens if European politics stabilise and US growth slows.
Most of this is cyclical, but relative US growth gives the move a semi-structural bias. Because the pillars are partly independent, treat any headline-driven dip with caution. Removing one would not collapse the trade. Removing several might.
What would unwind the trade?
An oil reversal or de-escalation with Iran would hit the inflation pillar directly. Softer US growth data or calmer European politics would erode the others.
Opinion splits on strategy. TMGM and macro commentary from TradingEconomics and MarketWatch favour buying dips while yields, oil and political risk persist. Contrarians may prefer to fade rallies if those conditions start to fade.
What does an overbought dollar index actually look like on the chart?
Two technical ideas explain most of the current debate.
The Relative Strength Index (RSI) is a momentum gauge that measures how fast prices have risen or fallen, on a scale of 0 to 100. The standard version, RSI (14), uses the last 14 sessions. A reading above 70 means the move is stretched. It does not mean a reversal is guaranteed.
The second idea is role reversal. A price level that once capped gains, called resistance, often becomes a floor, called support, once the market breaks above it.
The current reading RSI (14) sits at 70.67, just inside overbought territory. The former breakout zone at 101.75-101.65 now acts as near-term support, below the recent high of 102.54.
Applied together, the chart suggests a pause or shallow pullback rather than a lasting top. History offers some support for that reading. During the hawkish Fed episodes of mid-2014 to early 2015 and 2022, the DXY kept climbing even while technically stretched.
One caveat: the technical section of the FXStreet source was written with AI assistance. Treat these levels as one input, not a forecast.
- Price holds above 101.75-101.65: dip-buyers remain in control.
- RSI cools without a price collapse: momentum resets in a healthy way.
- Strong follow-through selling: the first real sign of a near-term peak.
The useful question is not whether the rally is over. It is whether price holds support. That framing helps you avoid both chasing highs and panic-selling a routine dip.
For readers wanting to apply these chart tools themselves, our dedicated guide to DXY technical analysis with EMA and RSI shows how momentum readings align with Fed policy.
Where does dollar strength spill over: AUD/USD, USD/JPY and gold?
On 8 October the dollar was close to flat against the majors: down 0.09% against the euro, 0.02% against sterling, 0.12% against the New Zealand dollar and 0.11% against the Swiss franc, unchanged against the yen and up 0.03% against the Australian dollar. The quiet day masks three different stories.
| Asset | Level | Transmission channel | Key risk |
|---|---|---|---|
| AUD/USD | Above 0.6950 | Yield-backed dollar pressures commodity-linked currencies | Further risk aversion |
| USD/JPY | Below 158.00 | Wide US-Japan rate gap weakens the yen | Japanese intervention |
| Gold | $4,100-$4,160/oz | Strong dollar and yields weigh; hedging demand supports | Higher yields, renewed dollar strength |
The Australian dollar held above 0.6950 despite risk aversion and the hawkish minutes. USD/JPY slipped below 158.00 on intervention speculation and profit-taking, which shows how a wide rate gap can be capped by the threat of Tokyo stepping in.
Gold is the surprise. A strong dollar and high yields normally weigh on it, yet it rebounded above $4,100 as geopolitical and inflation hedging held firm. Hawkish minutes and possible strikes on Iran limit the recovery from either side. No reliable current Brent or WTI price was available, so oil’s role here rests on the direction of energy costs rather than a specific level.
For a US investor, the dollar’s strength shows up in what imports cost, what overseas holdings are worth in dollar terms and how commodity exposure performs. Each asset needs its own read, not one blanket conclusion.
Are dips in the dollar likely to be bought, and what would change that?
The evidence leans toward dip-buyers, but only conditionally. While the Fed, energy, geopolitical and technical pillars hold, pullbacks toward 101.75-101.65 are more likely to attract buying than to start a reversal.
- Bull case holds if: December hike odds stay in the 68-80% range, yields stay elevated, oil stays high and price holds support.
- Bull case weakens if: overextension near 102.54 triggers selling, Japan intervenes, oil reverses or US growth slows.
Past performance does not guarantee future results, and these conditions may change quickly with market developments.
Rate and growth drivers may sustain the move, but valuation concerns linger: Morningstar’s model flags the index as roughly 15% overvalued, a reminder that cyclical dollar strength carries a premium.
What the pullback changes, and what it does not
Thursday’s dip changes little. The index remains above 102, the RSI reading of 70.67 argues for a pause rather than a top, and the Fed, energy and safe-haven drivers are still in place.
What will matter is the next run of catalysts: weekly jobless claims, remarks from FOMC speakers, developments on Iran and shifting pricing for the December meeting. If those confirm the current backdrop, support near 101.75-101.65 becomes your measuring stick. If several pillars crack at once, the case for fading rallies grows stronger.
Your edge comes from watching the conditions rather than betting on any single price target.
This article is for informational purposes only and should not be considered financial advice. Investors should conduct their own research and consult with financial professionals before making investment decisions.