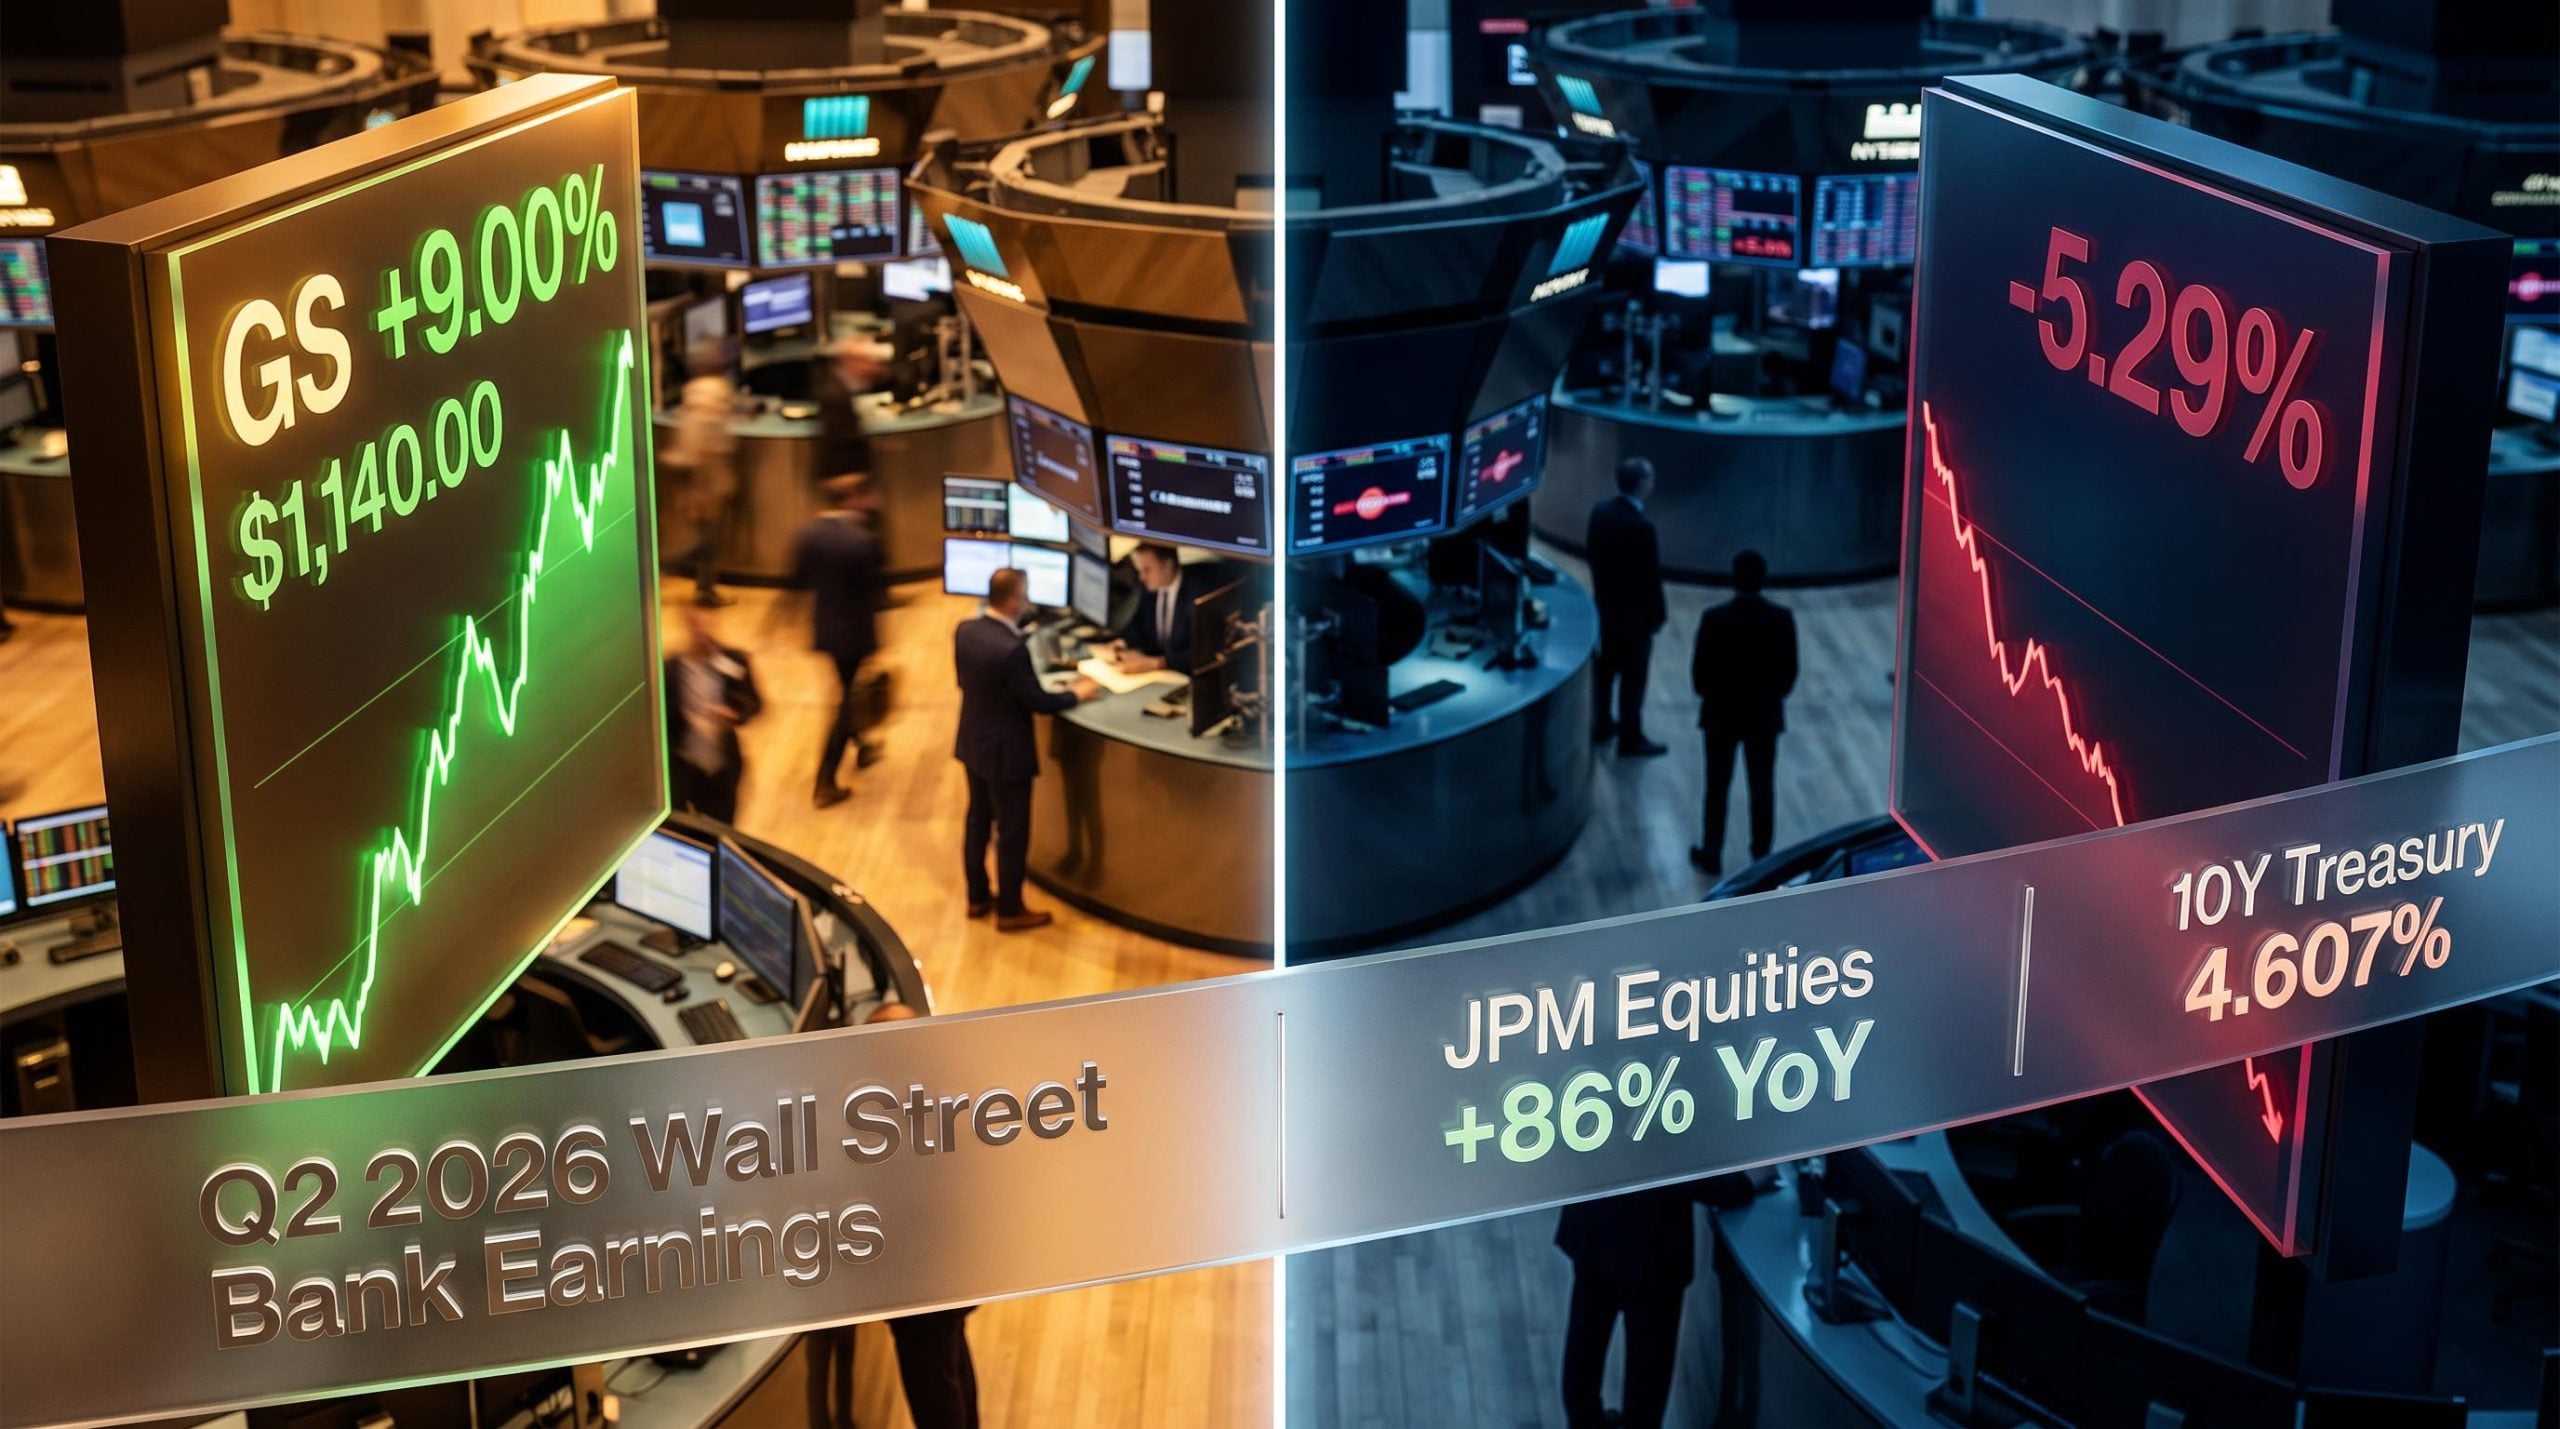
Goldman Sachs and Citigroup both reported Q2 earnings on the same day, in the same sector, into the same macro environment. One rose 9%. The other fell more than 5%.
That is not a quirk of market sentiment. It is a signal about what actually matters in banking right now.
The headline from Q2 2026 Wall Street bank earnings is a broad beat. JPMorgan, Goldman Sachs, Bank of America, Wells Fargo, and others all cleared consensus estimates on both EPS and revenue. But the stock market’s reaction underneath that headline tells a more instructive story: capital-markets-heavy franchises were rewarded with outsized moves, while consumer-tilted lenders and restructuring stories faced scepticism or outright selling despite solid reported numbers.
The sector-wide beat was anticipated in broad strokes by the bank earnings preview published before results landed, which flagged net interest income guidance for H2 2026 as the single most consequential signal to watch, precisely because headline beats were already being discounted by consensus models.
The divergence is structural, not situational. Here is what drove the numbers, what the split in stock reactions reveals about how the market prices different banking business models, and what it means for investors deciding how to position financial-sector exposure in a persistently high-rate environment.
The capital markets engine that powered the sector-wide beat
The Q2 beat was not a consumer banking story. It was not a rate story. It was a trading and deal-making story, and the institutions with the most direct exposure to those revenue streams captured the upside.
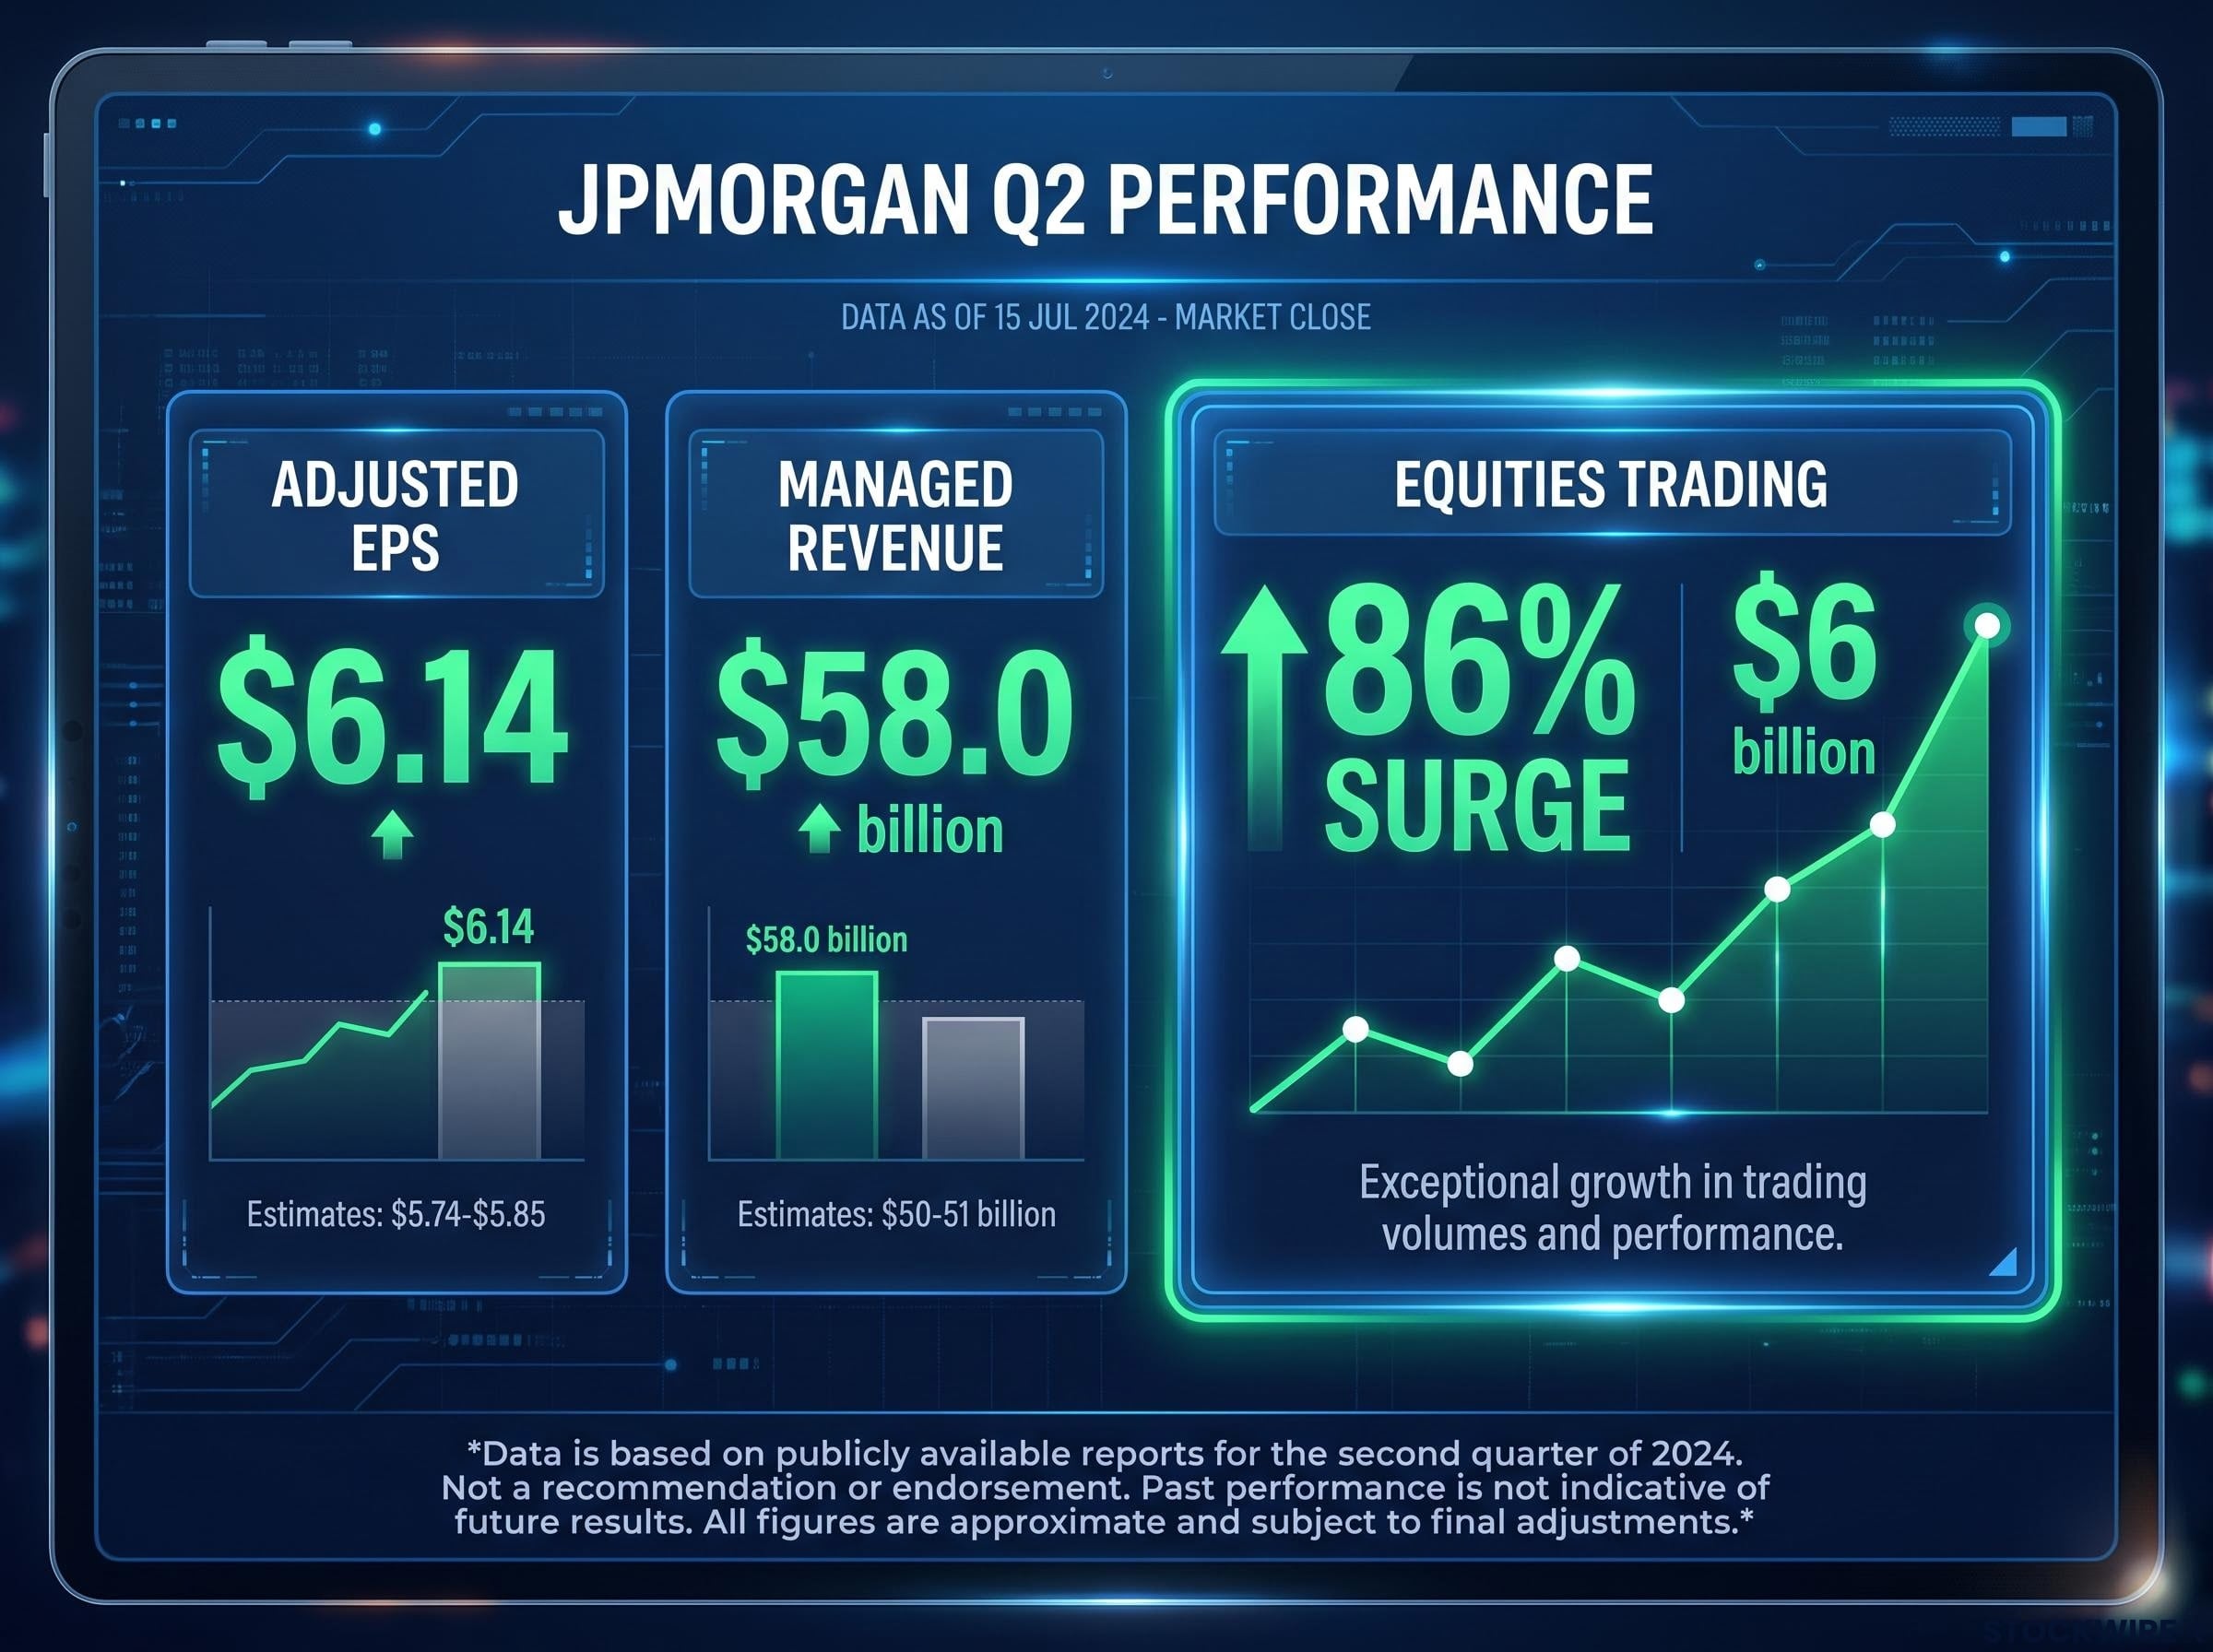
JPMorgan reported managed revenue of $58.0 billion against expectations of roughly $50-51 billion, with adjusted EPS of $6.14 versus estimates of $5.74-$5.85. The standout figure: equities trading revenue surged 86% year-over-year to approximately $6 billion. That single line item explains more about Q2 than any other data point in the sector.
Bank of America corroborated the pattern. Investment banking fees hit approximately $2.1 billion, up roughly 50% year-over-year, on total revenue of approximately $31.6 billion (up roughly 15% year-over-year) and EPS growth of approximately 34% year-over-year. This was not one institution’s idiosyncratic result. It was a sector-wide capital markets phenomenon.
How the headline numbers played out across institutions
| Institution | EPS (Actual vs. Est.) | Revenue (Actual vs. Est.) | Stock Reaction |
|---|---|---|---|
| JPMorgan Chase | $6.14 vs. ~$5.74-$5.85 | $58.0B vs. ~$50-51B | +2.50% |
| Goldman Sachs | Beat (core divisions) | Beat (core divisions) | +9.00% |
| Bank of America | ~+34% YoY | ~$31.6B, +15% YoY | +1.88% |
| Morgan Stanley | Beat | Beat | +2.98% |
| Wells Fargo | $2.00 vs. $1.72 | $22.62B vs. $21.84B | -2.71%* |
| Citigroup | ~+38-40% YoY (est.) | ~+8% YoY (est.) | -5.29% |
*Wells Fargo’s decline was reported as -2.71% on the close; some sources characterise the intraday move as steeper, though this is not independently confirmed.
The 86% surge in JPMorgan’s equities trading revenue tells you that Q2 was a gift specifically to institutions built around capital markets. Banks without that machinery had a structurally different quarter, regardless of their headline EPS.
When big ASX news breaks, our subscribers know first
What Goldman’s 9% surge and Citigroup’s 5% drop reveal about how the market reads banks
Goldman Sachs is the clearest expression of what the market rewards right now: a concentrated, high-leverage capital-markets franchise that beat in its most cyclical divisions. Options markets had been pricing an implied move of approximately 6% ahead of the print, reflecting both upside potential and real scepticism about whether deal-making and trading strength would hold. When Goldman delivered a clean beat in those exact businesses, the stock closed at $1,140.00, up 9.00% on the day, blowing past the implied move.
Goldman Sachs closed at $1,140.00, up 9.00%, the largest single-day move among major bank earnings reactions in Q2 2026.
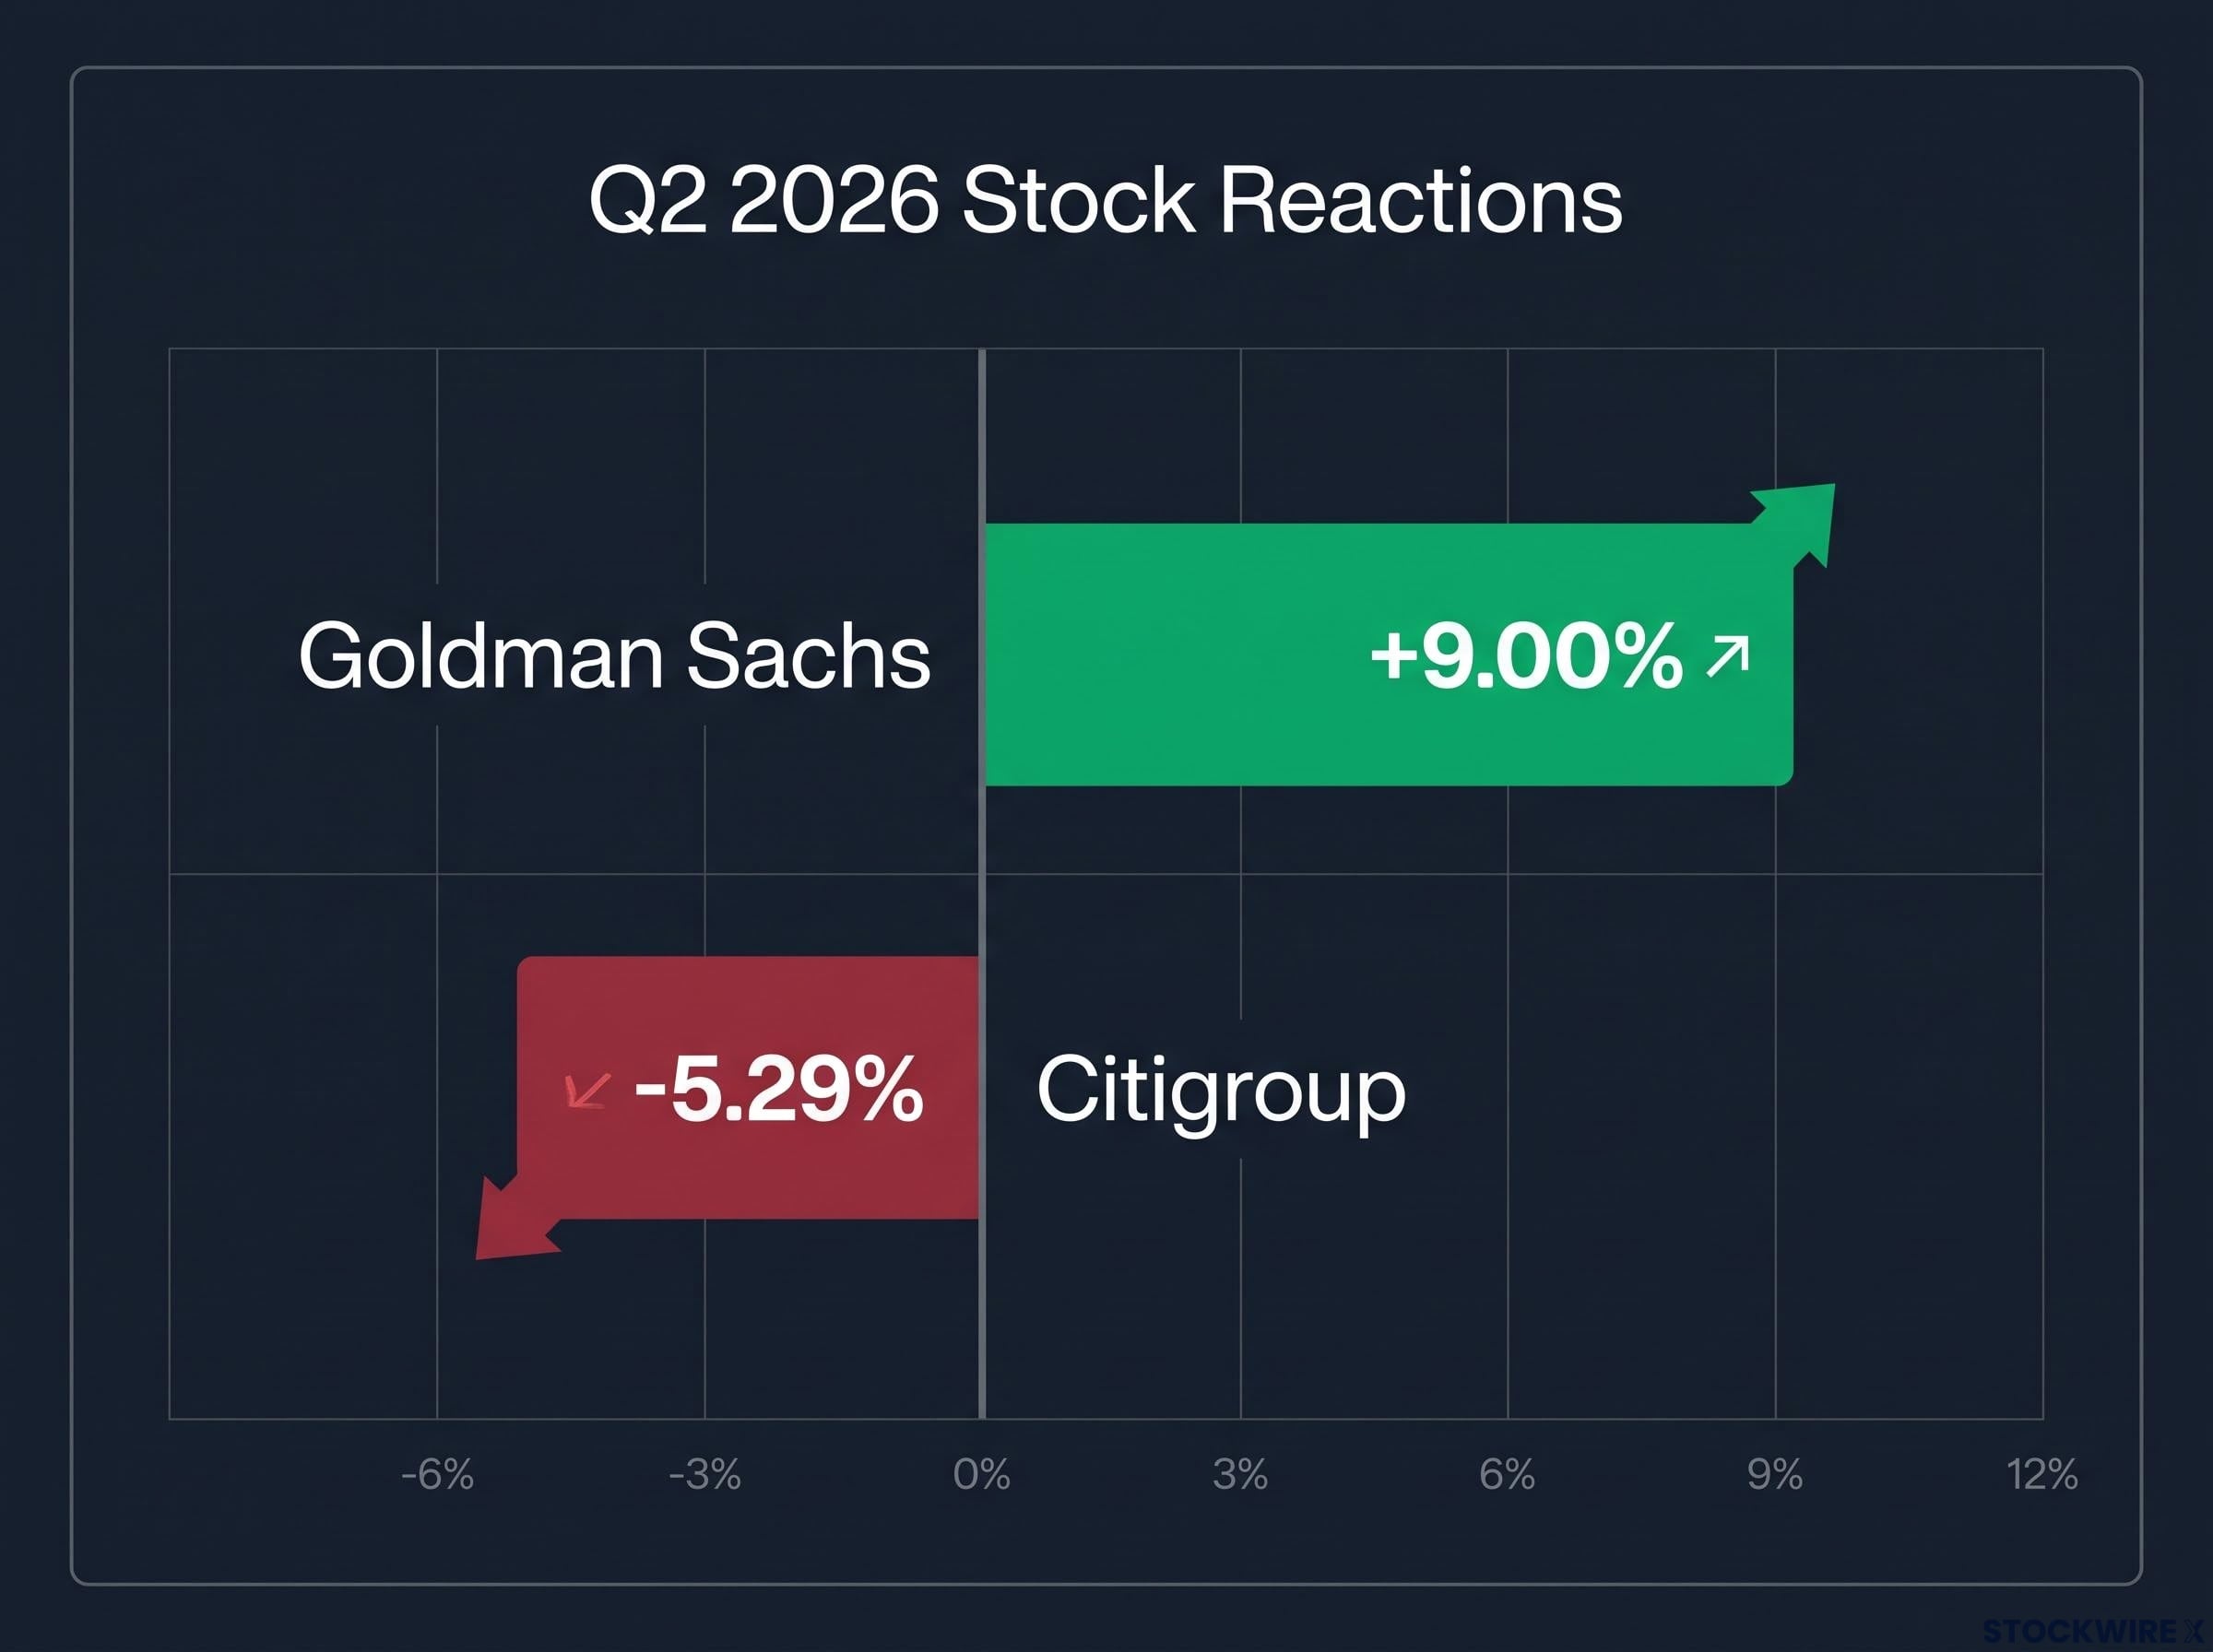
Now contrast that with Citigroup. Analysts had projected approximately 38-40% year-over-year EPS growth on roughly 8% revenue growth. Those are strong numbers. But they came from a low base, tied to a multi-year restructuring that includes international consumer business divestitures and a long effort to lift returns on equity. The market was not watching for a beat; it was watching for evidence that the transformation trajectory was credible. Citigroup fell 5.29%.
The two outcomes are not about one bank performing well and one performing poorly in an absolute sense. They reflect the market applying different valuation frameworks to different business model types:
The earnings expectations gap is the mechanism behind Citigroup’s decline on a strong growth quarter: stock prices respond to the distance between actual results and prior consensus, not to whether the absolute number is good, which is why a 38-40% EPS growth print can still produce a sharp sell-off when the market had already priced in execution progress.
- Capital-markets-concentrated (Goldman model): Revenue driven by trading and advisory fees; market judging durability of deal-making cycle; rewarded when cyclical strength is confirmed
- Restructuring/transformation (Citigroup model): Revenue mix shifting through divestitures and cost restructuring; market judging ROE trajectory and strategic execution; single-quarter beats discounted if trajectory evidence is unclear
- What investors are actually judging: For Goldman, it is “Is the cycle real?” For Citigroup, it is “Is the turnaround on track?”
Citigroup’s decline on a strong growth quarter tells you that turnaround stories are judged not on whether they grew but on whether the market trusts the trajectory. That distinction matters enormously when you evaluate similar situations in a portfolio.
Understanding capital markets versus traditional banking (and why the difference is decisive right now)
Everything the reader has seen so far, the beats, the divergent stock reactions, the Goldman-Citigroup split, traces back to a single structural distinction in how banks make money.
Capital markets revenue comes from investment banking fees (advising on mergers, underwriting IPOs and bond issuances), equities and fixed income trading (buying and selling securities for clients and the firm), and advisory fees. This revenue is transaction-driven. When deal activity picks up and volatility creates trading opportunities, it surges.
Net interest income comes from the spread between what a bank earns on its loans and what it pays on deposits. This is the revenue engine of traditional consumer and commercial banking. It is steadier, but it faces pressure in a high-rate environment because deposit costs rise alongside loan yields, compressing margins.
- Capital markets revenue: Transaction-driven; benefits from deal-making cycles and market volatility; can surge or contract rapidly; concentrated at Goldman Sachs, Morgan Stanley, and the investment banking arms of JPMorgan and Bank of America
- Net interest income: Spread-driven; benefits from loan growth and rate environment; more stable but margin-sensitive in sustained high-rate periods; dominant at Wells Fargo and in consumer/commercial divisions broadly
Why Q2 2026 specifically favoured capital markets
Three conditions converged. IPO and M&A activity revived after quarters of constraint driven by rate uncertainty and geopolitical caution. Elevated equity volatility created trading opportunities that desks at Goldman, JPMorgan, and Morgan Stanley captured directly. Cross-border deal flow added a further layer of advisory fee generation.
The KBW Bank Index was up approximately 12% year-to-date through mid-July, and regional banks had gained approximately 19%, as capital rotated toward financials and away from some technology names. The S&P 500 aggregate Q2 earnings growth expectation sat at approximately +24% year-over-year on roughly +12% revenue growth.
The Q2 2026 sector divergence running through bank results is mirrored at the index level: the S&P 500’s blended 23.6% earnings growth headline masks a three-sector surge in Energy, Information Technology, and Materials that follows the same structural logic as the Goldman-Citigroup split, where business mix and cyclical positioning determine who captures the quarter’s upside.
When you hear “bank earnings beat,” the mechanism of that beat, whether it came from the trading desk or the loan book, determines whether the result is durable or tied to conditions that may not persist. That distinction is the framework for everything that follows.
Wells Fargo’s awkward quarter and what “beating the numbers” actually means
Wells Fargo reported $2.00 EPS versus $1.72 estimated, and $22.62 billion in revenue versus $21.84 billion expected. The stock fell 2.71% on the day.
That is not a misprint. Wells Fargo beat on both lines and the market sold it.
The explanation sits in three forward-looking concerns the market was weighing against the backward-looking beat:
- Net interest margin trajectory: Wells Fargo relies more heavily on consumer and commercial lending than its capital-markets-heavy peers. In a high-rate environment, deposit cost pressure and cautious loan growth create margin headwinds that a single strong quarter does not resolve.
- Capital markets exposure gap: Without the scale of trading and advisory operations that powered JPMorgan’s and Goldman’s results, Wells Fargo could not capture the same Q2 tailwinds. Its business mix left it structurally less exposed to the quarter’s strongest revenue driver.
- Transformation overhang: Wells Fargo is still operating under the weight of its post-scandal regulatory and strategic transformation. Investors scrutinise every quarter for evidence of sustainable improvement in cost discipline, credit quality, and operational credibility. A headline beat does not override doubts about the pace of that multi-year process.
The data conflict on the day’s decline is worth noting: the pre-verified close-to-close figure is -2.71%, while some sources characterise the intraday move as nearly -8%. The discrepancy may reflect measurement windows, but either way, it underscores that reading daily stock moves requires precision about what you are actually measuring.
Wells Fargo’s day tells you that in bank earnings, the market is often less interested in what a bank earned last quarter than in what its business mix and strategic position imply about the next four to eight quarters.
The macro ceiling: what elevated rates and a hawkish Fed mean for the sector’s next chapter
The Q2 capital markets surge did not happen in a vacuum. It happened against a macro backdrop that remains structurally constraining for the sector as a whole.
As of 15 July 2026, the U.S. 10-year Treasury yield stood at 4.607% (up 0.48%) and the 30-year at 5.122% (up 0.55%). The June 2026 CPI print arrived below forecasts, taking the immediate pressure off a July rate rise at the Federal Reserve’s next policy meeting. Core inflation, however, remains stubbornly above the Fed’s 2% annualised target.
| Indicator | Level | Date | Implication for Banks |
|---|---|---|---|
| 10-year Treasury yield | 4.607% (+0.48%) | 15 July 2026 | Supports NII but raises capital costs |
| 30-year Treasury yield | 5.122% (+0.55%) | 15 July 2026 | Pressures long-duration asset valuations |
| June 2026 CPI | Above 2% target | Released 15 July 2026 | Keeps Fed in restrictive stance |
| Fed rate-cut outlook | Distant | Current guidance | No imminent monetary tailwind for re-rating |
In congressional testimony, Fed Chair Kevin Warsh signalled the central bank’s firm resolve to bring structural price pressures under control. His remarks made clear that any move toward easier monetary policy is still a long way off, and that the bar for corporate performance stays elevated while rates remain restrictive.
Fed Chair Warsh’s congressional testimony, delivered on 14 July 2026, made explicit that the Fed’s commitment to its 2% inflation target remains the governing constraint on policy, and that structural price pressures must be durably resolved before any easing cycle becomes viable.
The tension is real: higher rates helped net interest income in Q2, but elevated long rates also increase capital costs, pressure asset valuations, and, most importantly for investors, mean the “Fed pivot” that has historically re-rated financial stocks is not an available catalyst. Analysts have warned that the hawkish tilt could pressure bank profits later in the year, even as Q2 benefited from strong IPO and M&A activity.
The combination of 4.6% ten-year yields and a Fed committed to holding rates higher for longer means you should not expect the macro environment itself to re-rate bank stocks. Outperformance will have to come from business mix and execution, and any financial-sector positioning needs to account for that reality.
What the dispersion in Q2 results means for how you own financials going forward
The Q2 data builds a clear framework for evaluating bank stocks in this environment, and it has three components:
- Capital markets versus consumer mix. Institutions with large trading and advisory operations (Goldman, JPMorgan’s CIB division) captured Q2’s strongest revenue driver. Consumer-heavy banks (Wells Fargo) could not. When you evaluate a financial holding, identify which revenue engine is dominant, because the macro conditions that power each one are different.
- Transformation story versus steady compounder. Citigroup and Wells Fargo are multi-year restructuring stories where single-quarter beats do not override execution risk. JPMorgan and Bank of America are viewed as resilient, diversified franchises where strong quarters produce orderly re-rating. Your tolerance for transformation risk should be explicit, not accidental.
- Fee diversification versus rate dependency. In a world where the Fed pivot is not coming soon, banks that generate revenue from fees (investment banking, trading, advisory, wealth management) have a structural advantage over banks whose profitability depends primarily on the shape of the yield curve. Evaluate each holding’s revenue mix against that filter.
The KBW Bank Index gained approximately 12% year-to-date through mid-July, with regional banks up approximately 19% and a financials-focused ETF climbing roughly 3.2% on the day of the major earnings announcements. Financials have acted as a genuine counterweight to technology-sector volatility in 2026. That diversification value is real, but it does not mean the sector trades as a single unit.
Exchange and market infrastructure stocks like CME Group and ICE sit at an adjacent point in the same capital markets ecosystem: they collect transaction fees every time the trading volumes that powered Goldman’s and JPMorgan’s Q2 results flow through their platforms, making their valuation dynamics a useful cross-check on whether the deal-making and trading cycle is priced as durable or temporary.
Owning “banks” as a macro trade without distinguishing business models is the structural error Q2 2026 results expose. Goldman’s +9.00% and Citigroup’s -5.29% on the same day, on the same macro backdrop, make that clear.
The reader who started this piece thinking about bank earnings as a unified story should finish it thinking about financial-sector exposure as a set of distinct positioning decisions. The data does not support a blanket call. It supports selectivity based on business model quality, strategic credibility, and rate sensitivity.
This article is for informational purposes only and should not be considered financial advice. Investors should conduct their own research and consult with financial professionals before making investment decisions. Past performance does not guarantee future results. Financial projections are subject to market conditions and various risk factors.