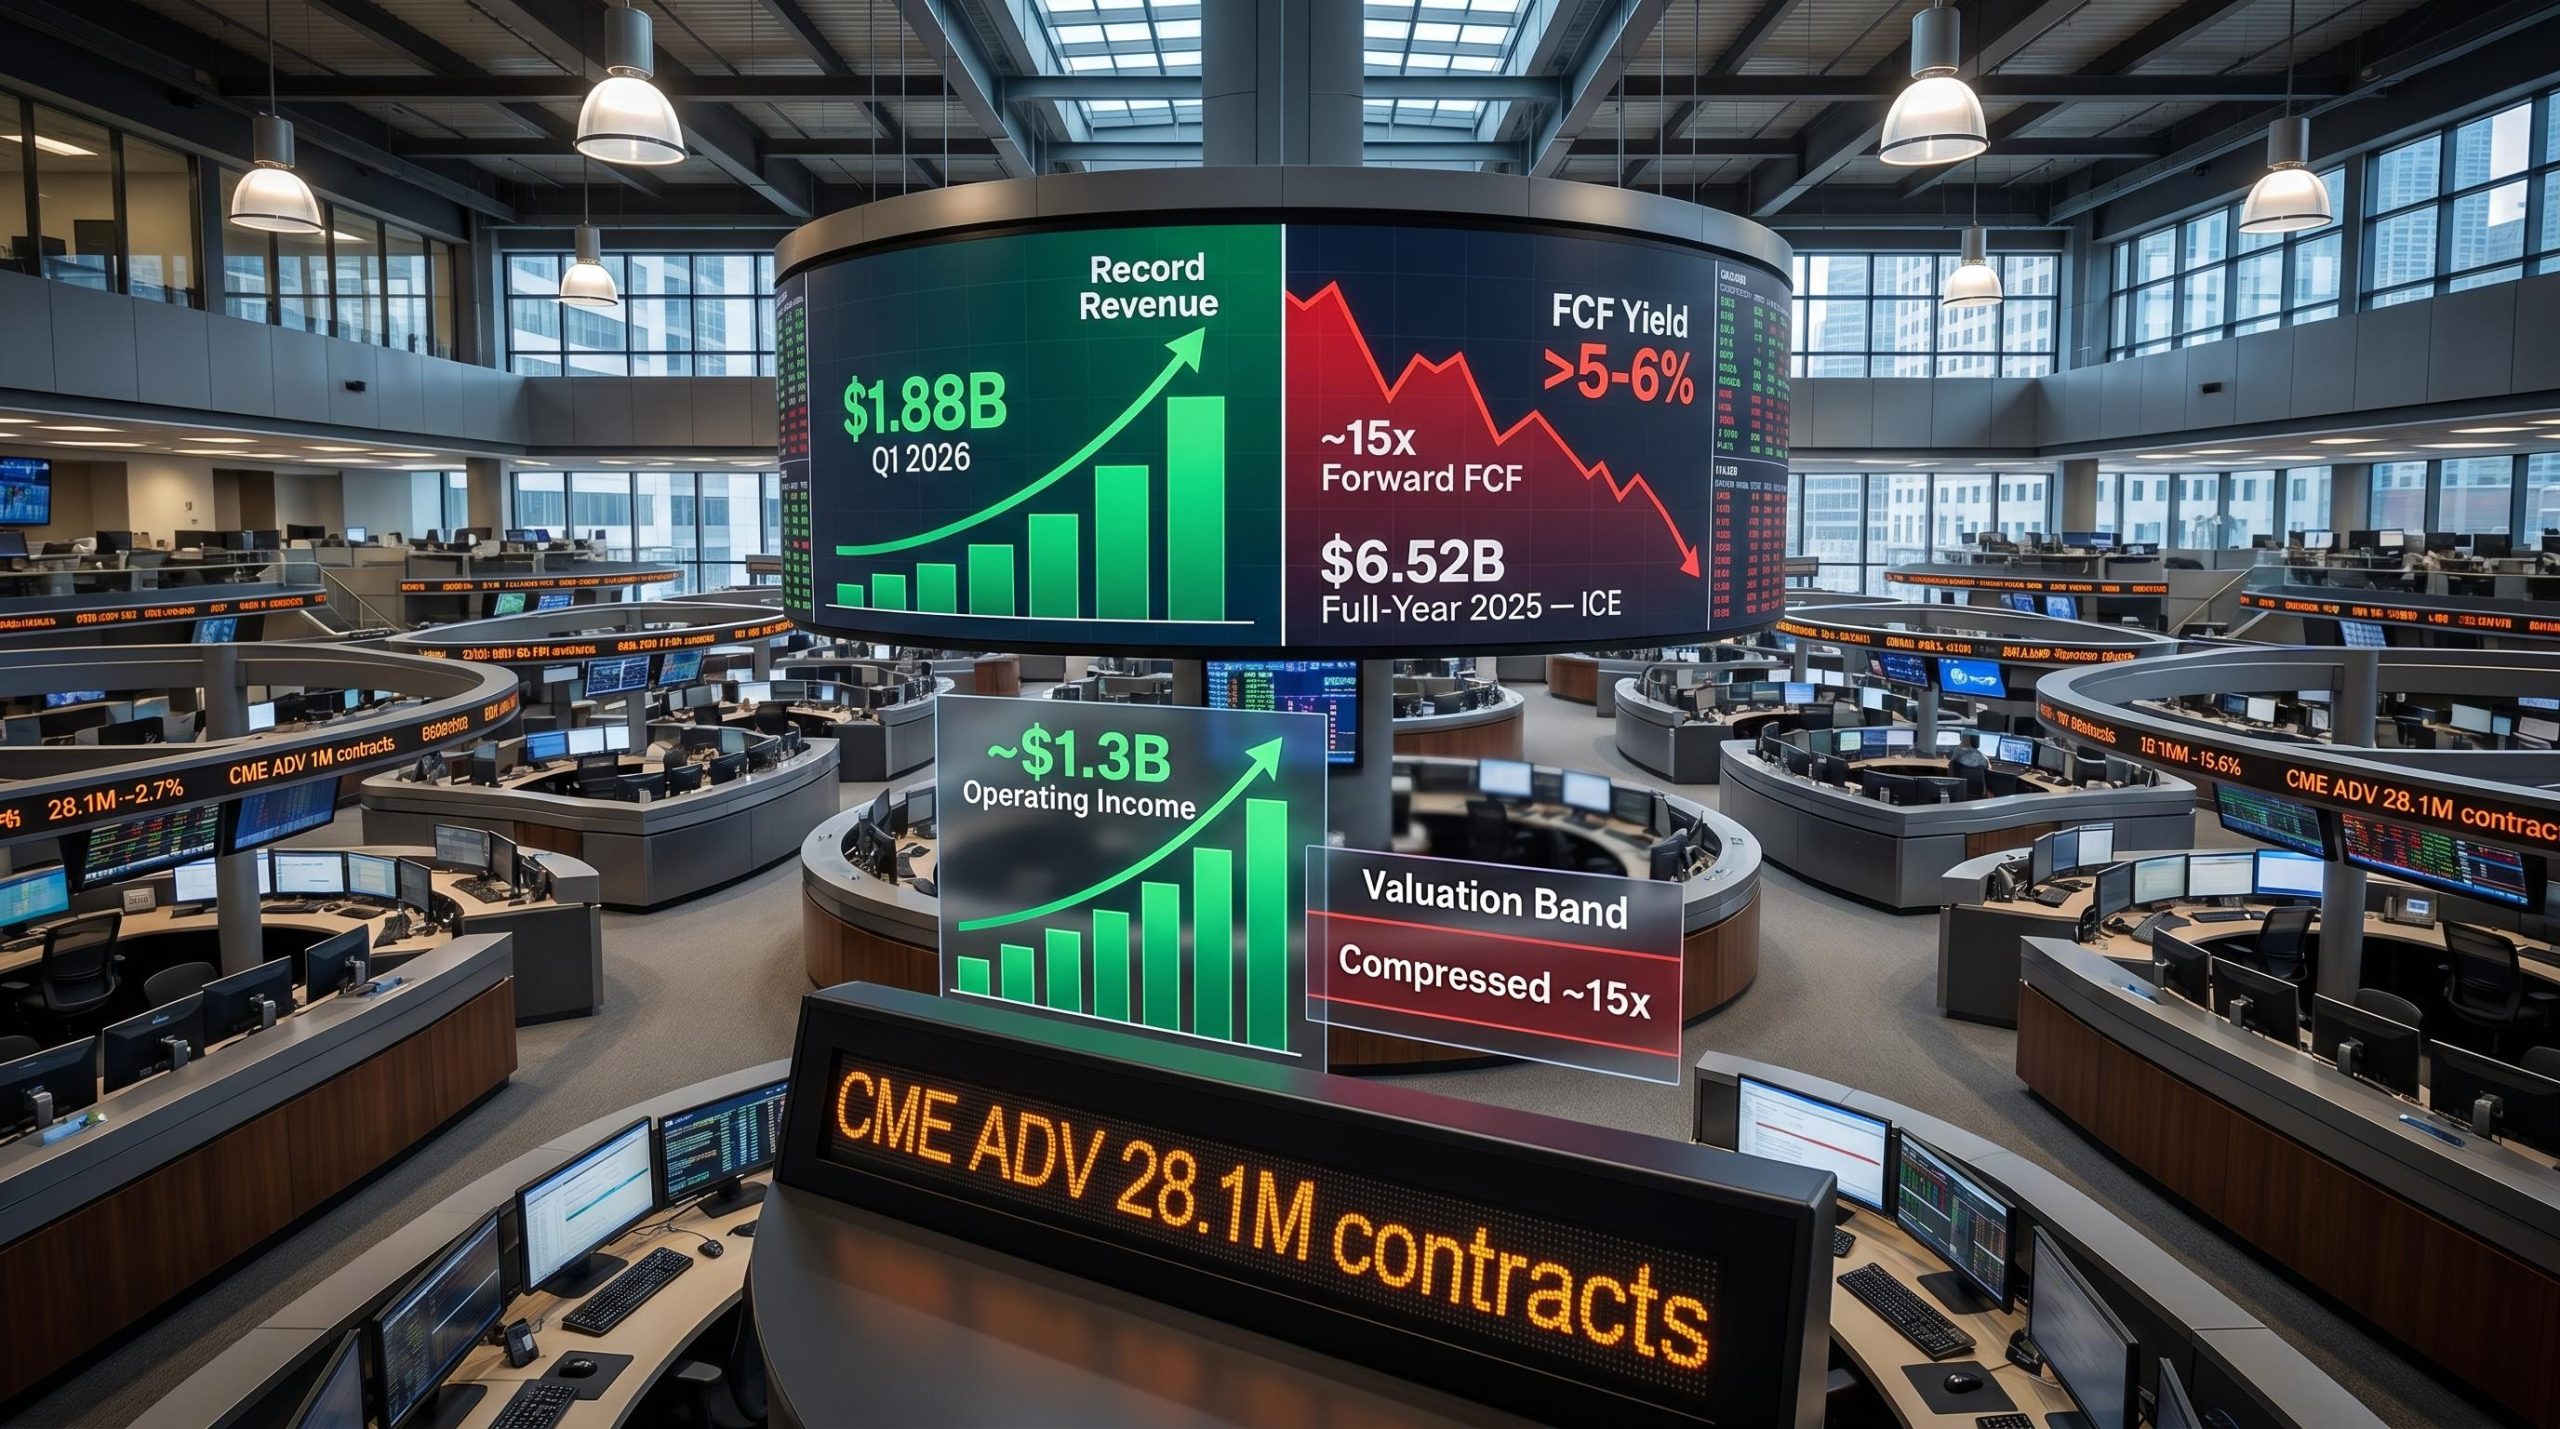
CME Group just posted $1.88 billion in quarterly revenue, the strongest quarter in its history. Adjusted net income grew roughly 20% year-over-year. And yet the share price implies a forward free cash flow yield north of 5-6%, a multiple you would expect on a business with structural problems, not one setting records.
This is not a CME-specific story. Intercontinental Exchange (ICE), Hong Kong Exchanges and Clearing (HKEX), and MIAX have all sold off sharply on a year-to-date basis. CBOE Global Markets has outperformed, but the sector as a whole has declined in a way that demands interrogation. When an entire category of structurally advantaged businesses falls simultaneously, the cause is usually sentiment and flows rather than deteriorating economics.
Here is the framework for assessing whether the three bearish narratives circulating about global exchange stocks, liquidity rotation, rate sensitivity, and perpetual contract disruption, hold up under scrutiny, and what the historical valuation context tells you about current prices.
Record earnings, falling prices: what the numbers actually show
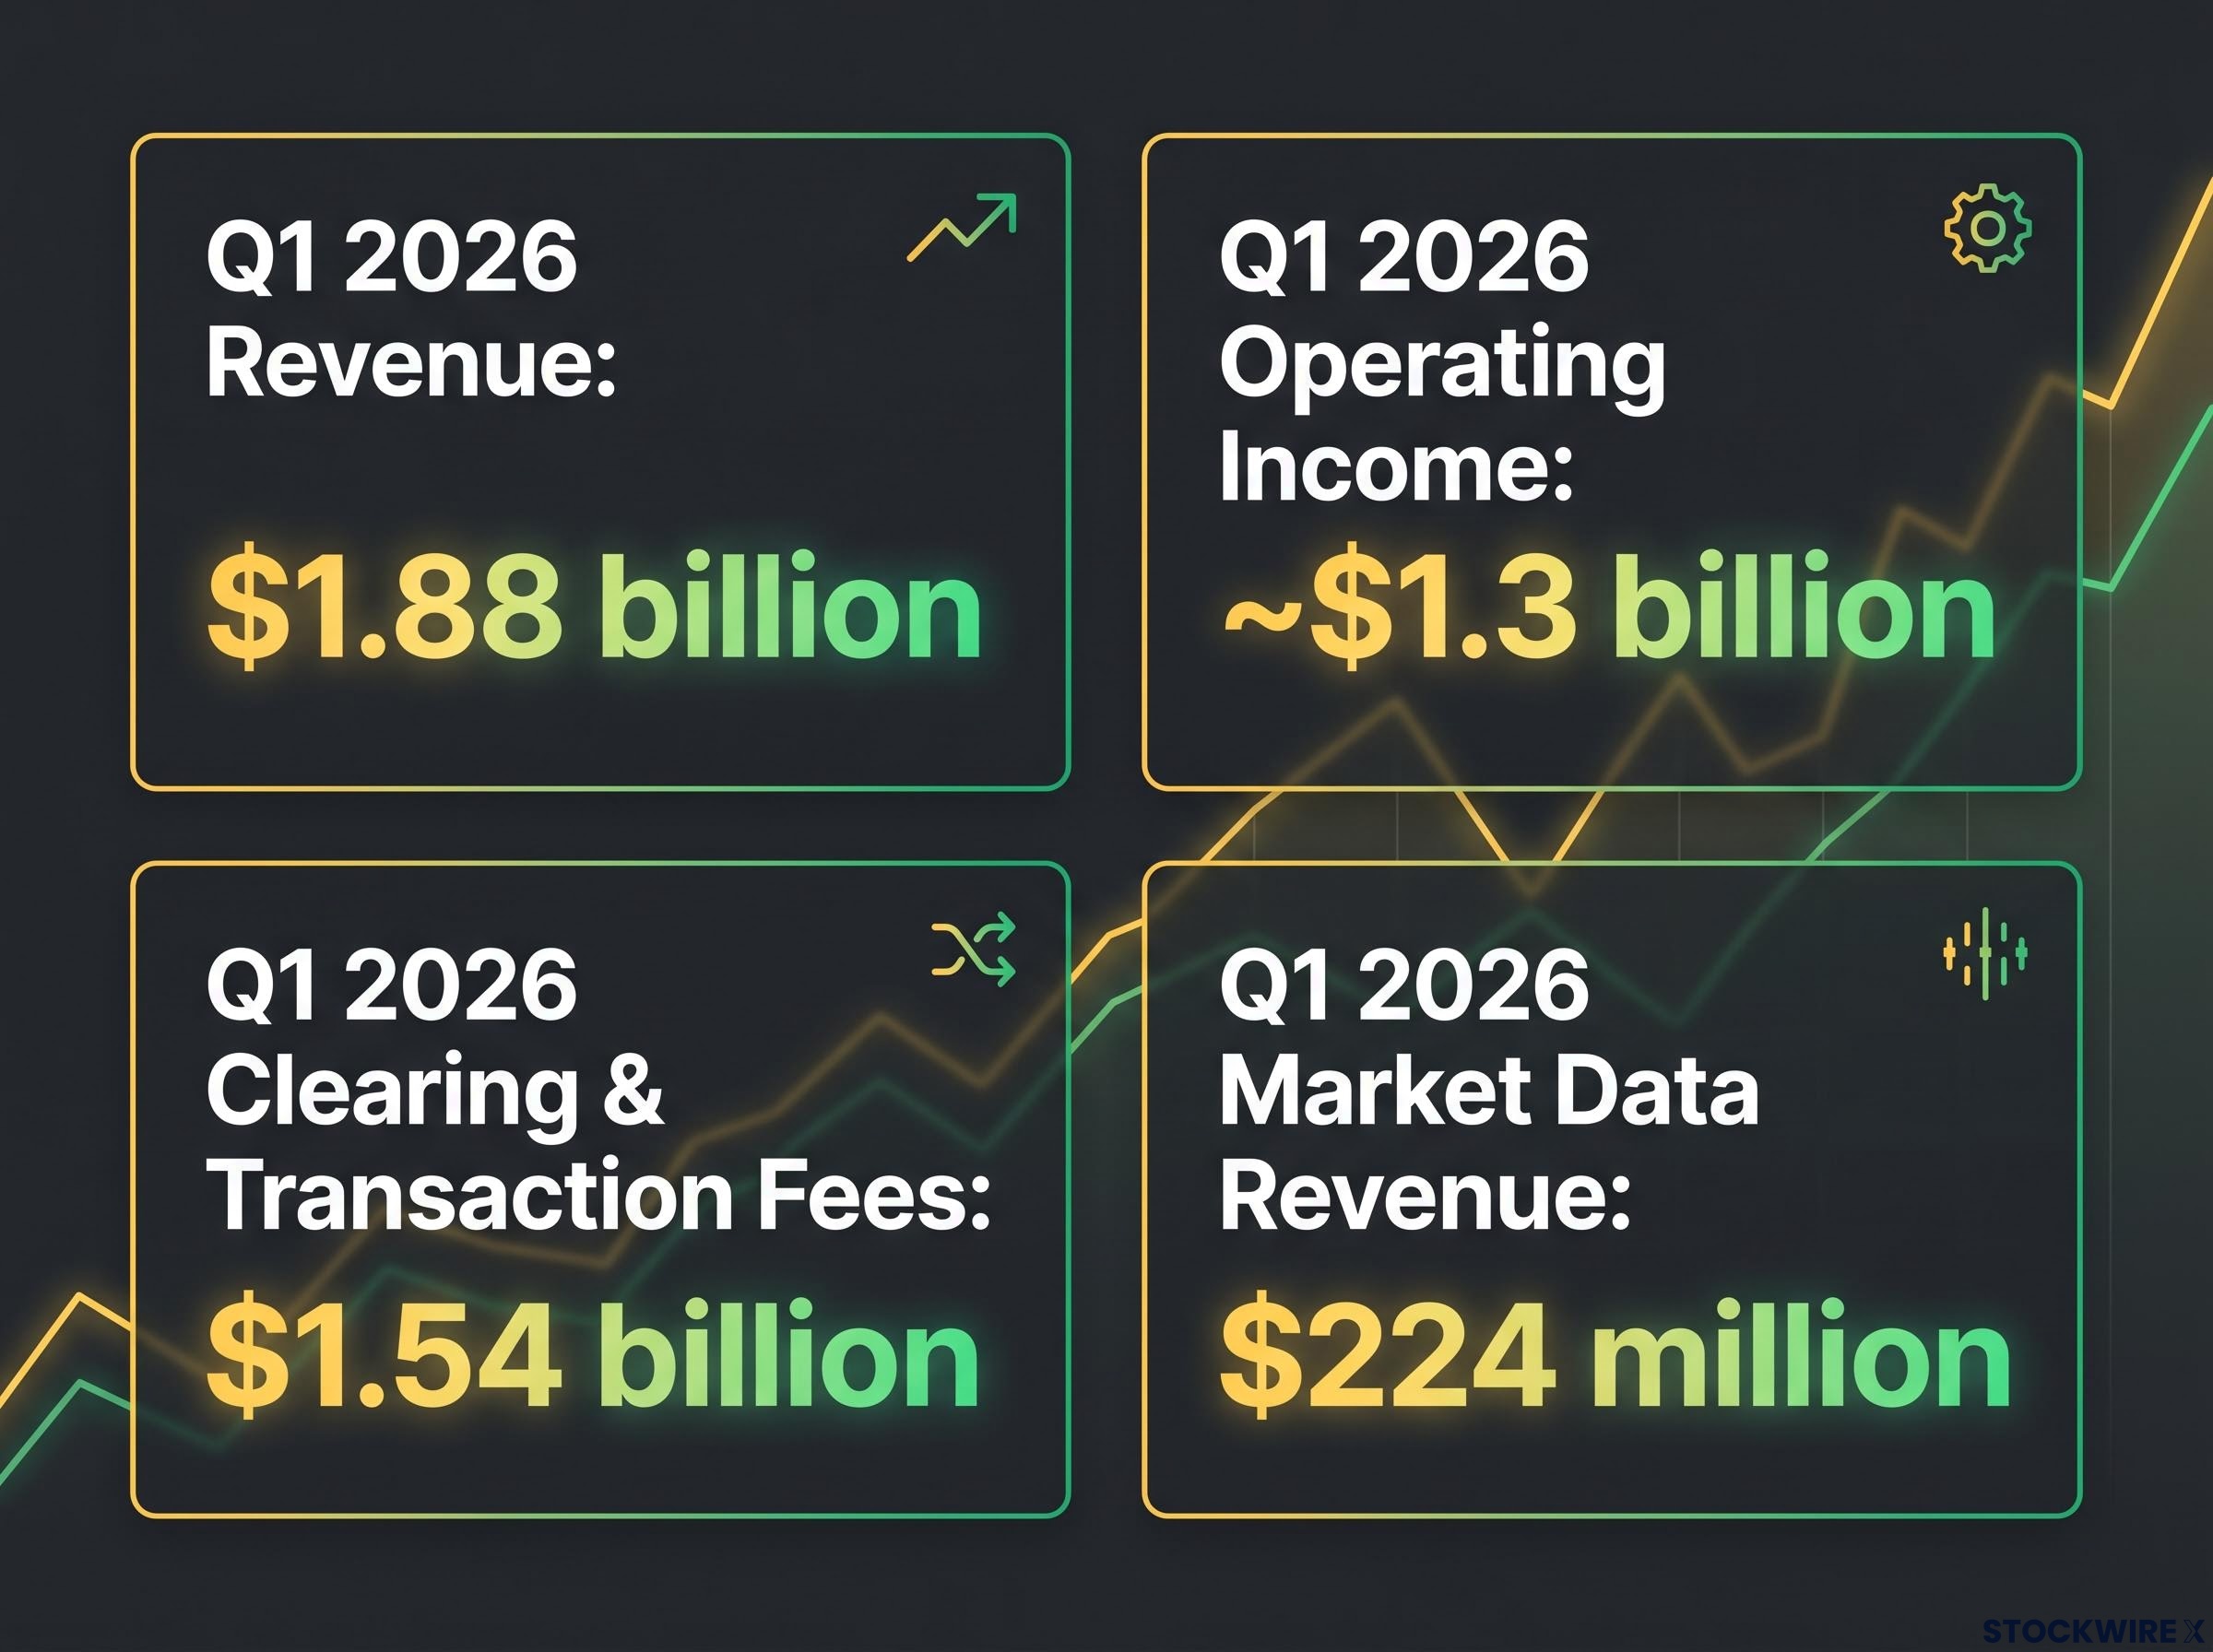
Start with what CME Group reported. Q1 2026 revenue came in at $1.88 billion, up approximately 14-15% year-over-year. That was a record. Operating income hit roughly $1.3 billion. Also a record. Adjusted net income and earnings per share grew approximately 20%. Full-year 2025 revenue reached $6.52 billion, marking a fourth consecutive year of record annual revenue.
CME Group’s Q1 2026 revenue of $1.88 billion represents the strongest quarterly result in the company’s history, achieved during a period of pronounced macro turbulence.
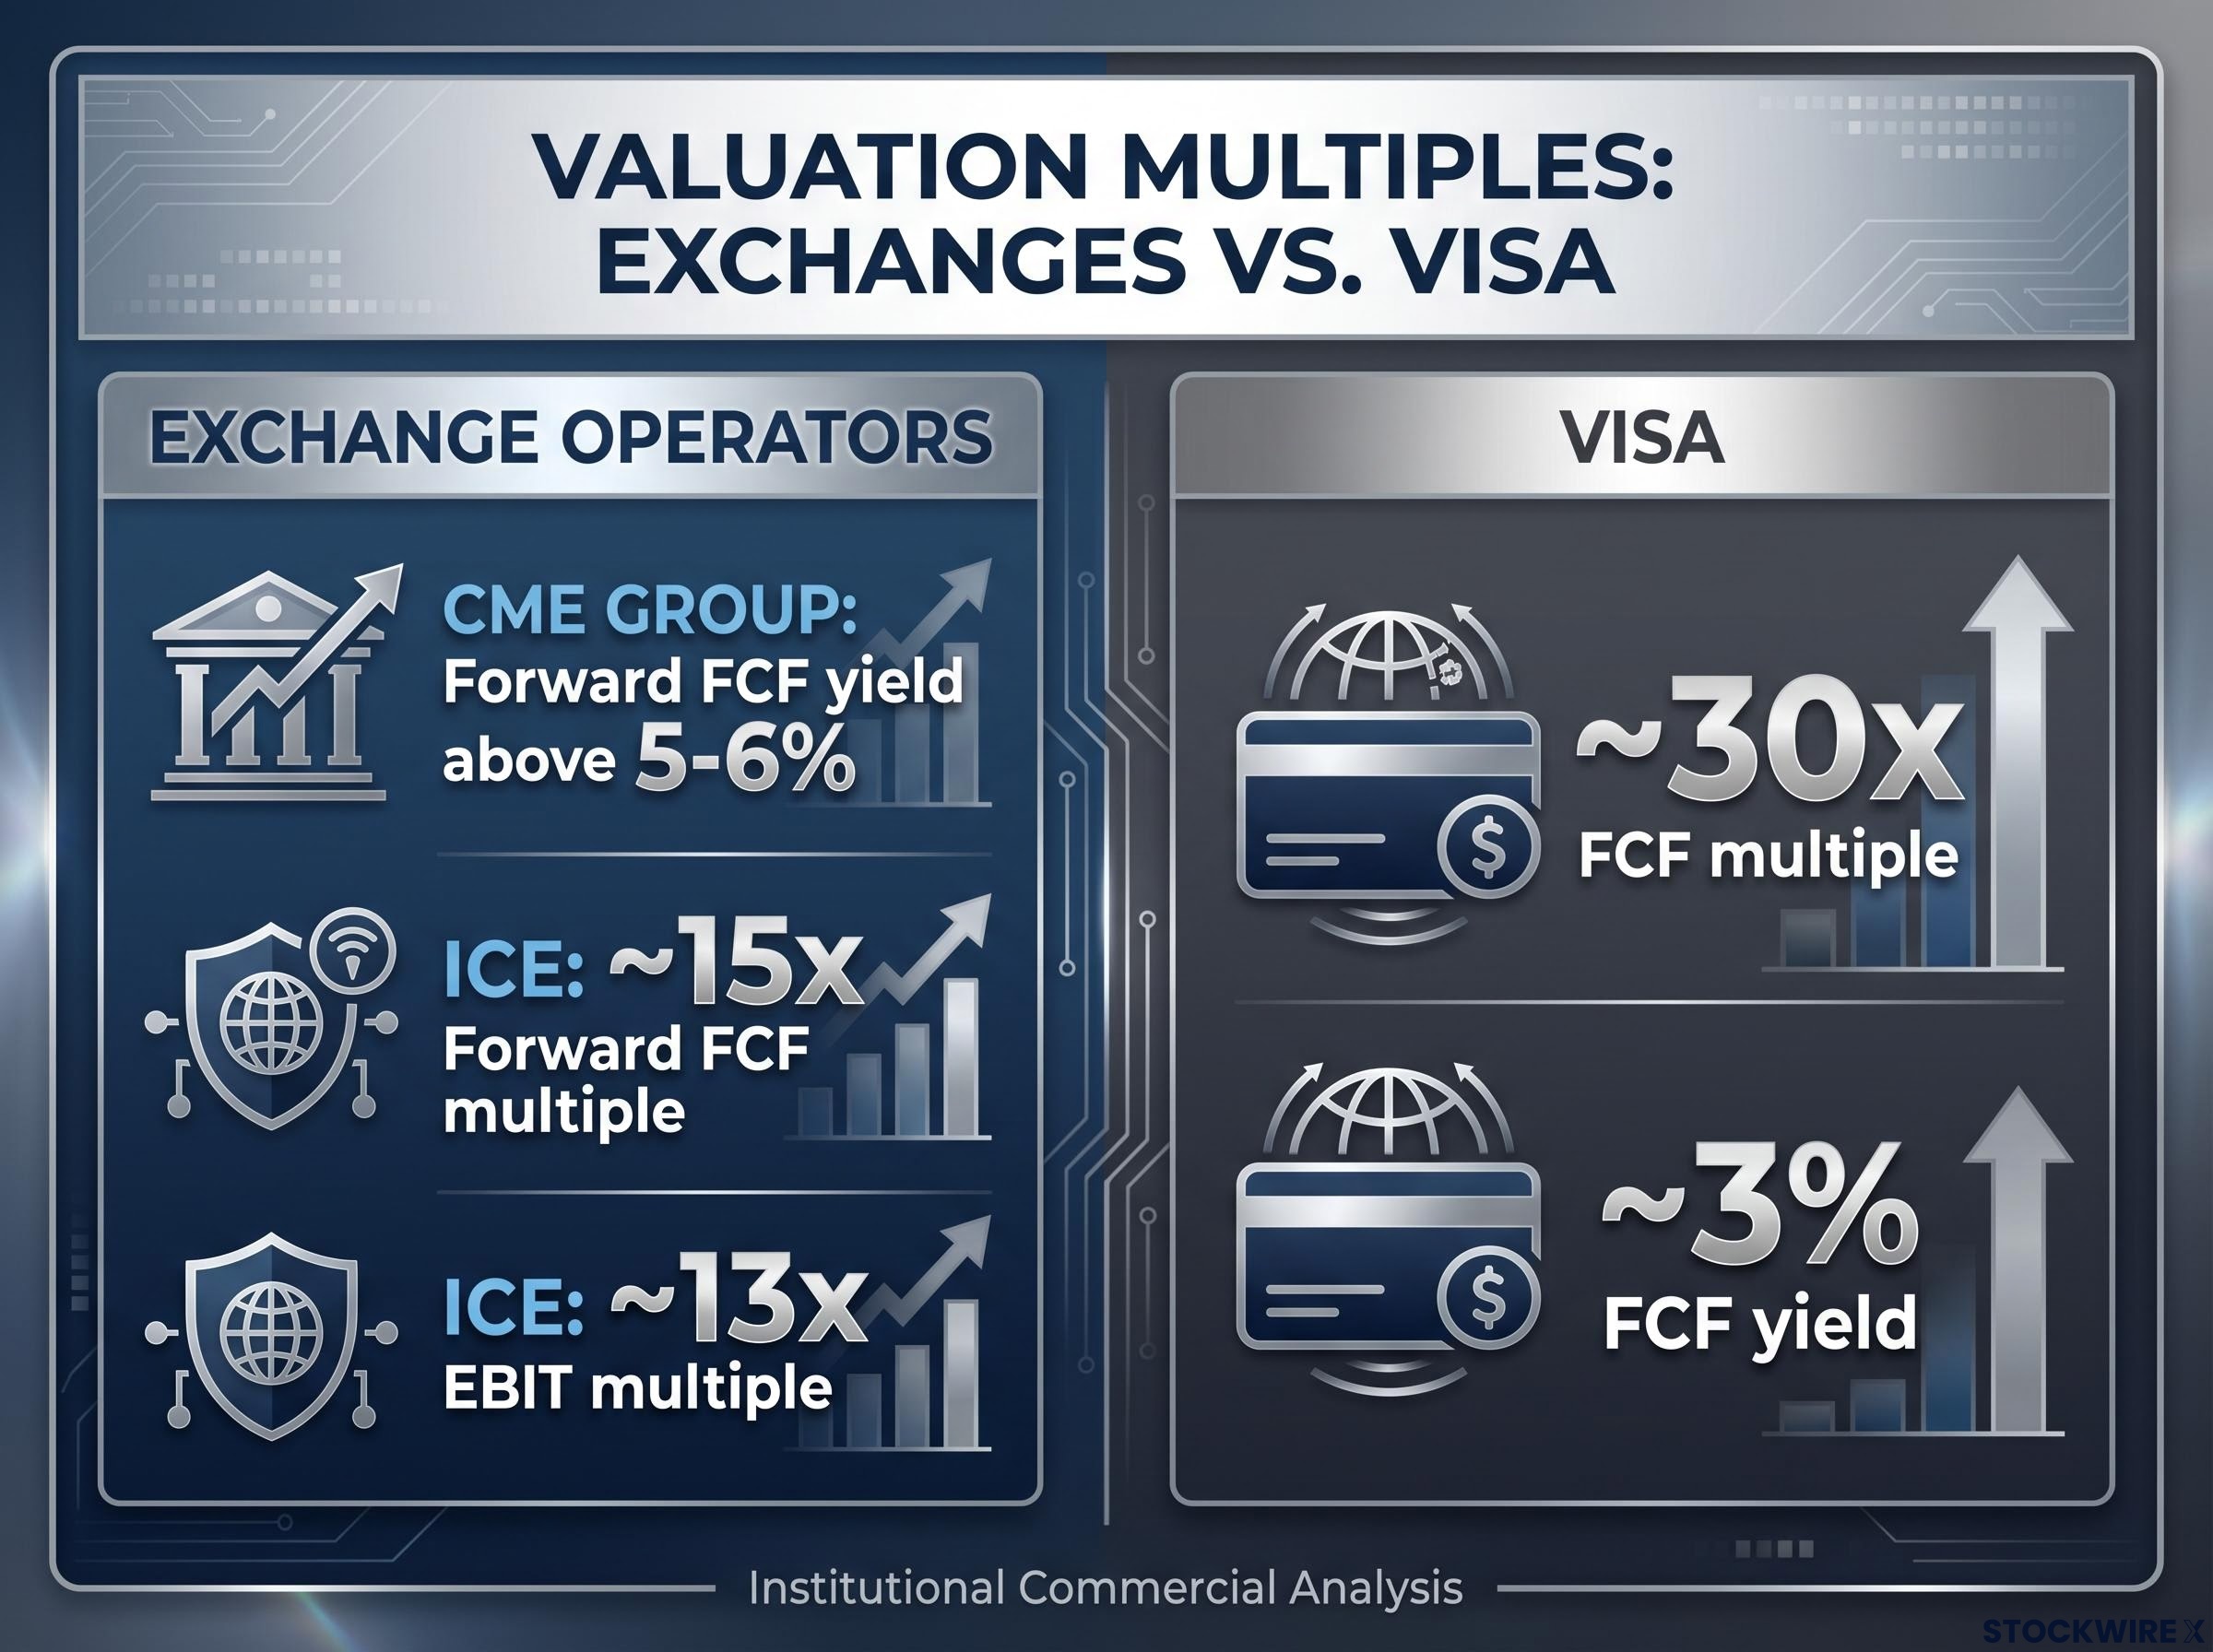
Now set that against the price. CME’s forward free cash flow yield exceeds 5-6%, implying a historically compressed price-to-free-cash-flow multiple. ICE is priced at around 15 times forward free cash flow, with an EBIT multiple of roughly 13 times. For context, Visa, another toll-collector on a network with no balance-sheet risk on the transactions it processes, carries a free cash flow multiple of around 30 times, putting its yield at approximately 3%.
The question the market is implicitly answering is: what would have to be structurally broken about exchange economics to justify paying less than half of Visa’s multiple for a business with comparable toll-road characteristics? The operational data does not suggest a broken business. It suggests the opposite.
In 2026, CBOE has held up better than the broader exchange sector, and the reason is worth examining. Its options franchise represents one of the most deeply entrenched regulatory moats in financial markets, and where that protection is strongest, investors have been least willing to price in disruption risk.
| Operator | Key metric | Latest reported figure | Year-over-year change |
|---|---|---|---|
| CME Group | Q1 2026 revenue | $1.88 billion | Up ~14-15% |
| CME Group | Forward FCF yield | Above 5-6% | Historically compressed |
| ICE | Forward FCF multiple | ~15x | Below historical average |
| ICE | EBIT multiple | ~13x | Below historical average |
Note: exact 2026 valuation multiples are sourced from original market analysis and have not been independently verified from market data; they are presented as directionally consistent with confirmed operational results.
When big ASX news breaks, our subscribers know first
How exchanges actually make money (and why most investors misread them)
The core mechanic is simple. Exchanges collect a fee on every contract traded and every unit of data consumed. They take no directional exposure to the underlying assets. They do not care whether oil goes up or down; they care that someone traded an oil futures contract, and they collected a fee when it happened.
The fee-per-contract model rests on exchange order book mechanics that match buyers and sellers continuously, with the exchange collecting its toll regardless of which side profits from the transaction.
What makes this model powerful is the cost structure. The infrastructure that runs an exchange, the technology, the clearing systems, the regulatory compliance apparatus, is largely fixed. Once it is built and maintained, the cost of processing one more contract is negligible. That means incremental volume drops through to the income statement at very high margins.
CME’s 2025 results demonstrate this directly. Revenue grew to a record $6.52 billion, but operating income grew faster than revenue, and net income grew faster still. That is operating leverage in action.
The four characteristics that define this toll-road model:
- A fee collected per contract traded, regardless of direction
- No directional risk on the underlying assets
- A largely fixed cost base across technology, clearing, and compliance
- Margin expansion at higher volumes as incremental revenue drops through at near-full margin
The comparison to Visa is instructive. Both businesses monetise transaction flow across an indispensable network. Neither takes balance-sheet risk on what is being transacted. Both derive pricing power from the network’s structural position rather than from capital deployment.
Two decades of compounding and what it tells you
The long-term track records put numbers to the model. Since floating in the early 2000s, CME has generated an annualised total return of around 18%, multiplying the original investment by roughly 53 times. ICE has produced annualised returns of approximately 15% over a comparable timeframe, turning the initial stake into roughly 17 times its starting value.
These returns span multiple rate cycles, geopolitical shocks, and competitive disruption narratives. The compounding occurred precisely because the toll-road mechanic builds on an expanding base of global capital and risk flows over time. Once you understand that the cost base is largely fixed and that volume gains fall through at near-full incremental margin, these long-term records stop looking like luck and start looking like a structural feature the current valuation discount ignores.
Why volatile, uncertain markets are exactly what exchanges want
Most investors instinctively classify financial stocks as vulnerable to volatility. For exchanges, the opposite is true. The causal chain runs in three steps:
- Higher volatility drives more hedging, more speculation, and more portfolio rebalancing across institutional and professional participants
- More activity means more contracts traded across the exchange’s platform
- More contracts traded means more fees collected on a near-fixed cost base, expanding margins
CME’s Q1 2026 operating income reached approximately $1.3 billion, a record, during a period of elevated geopolitical instability and energy market turbulence.
The evidence from 2025 and early 2026 is direct. CME achieved record average daily volume (ADV) of 28.1 million contracts in full-year 2025, with elevated trading days exceeding 30 million contracts becoming more frequent. Broad strength appeared across interest rates, energy, agriculture, metals, and non-US products. Geopolitical instability and energy market turbulence in the first half of 2026 drove increased activity across exchange platforms.
The interest rate concern deserves honest treatment. Net investment income on customer collateral is a visible line item, and it grew as a tailwind when policy rates rose from near-zero levels. Concerns that lower future rates could compress this stream are valid. But they are second-order. CME’s record revenue and operating income are driven primarily by clearing and transaction fees ($1.54 billion in Q1 2026, a record) and market data revenue ($224 million, also a record). The macro environments that generate rate volatility, inflation, fiscal uncertainty, geopolitical shocks, are the same environments that drive derivatives usage. The primary business reinforces itself under the exact conditions that create secondary-line headwinds.
For you as an investor, the practical implication is that the macro environment most investors currently fear is precisely the environment that historically generates the highest exchange volumes and the most durable fee revenue growth.
The perpetual contracts threat: separating retail noise from institutional reality
The surface case is plausible. Crypto perpetual contracts and prediction markets have captured real retail volume and attracted serious media coverage. If you read the commentary at face value, regulated exchanges face an existential competitive threat.
The claim breaks down when you examine who actually drives exchange economics. The major participants whose activity underpins CME’s, ICE’s, and CBOE’s revenue, including sovereign wealth funds, global pension funds, commodity producers, and major banks, operate under structural constraints that perpetual platforms simply cannot accommodate:
FSB central clearing requirements across member jurisdictions mandate that qualifying OTC derivatives transactions be processed through regulated central counterparties, creating the legal and fiduciary framework that prevents institutional participants from substituting unregulated perpetual platforms for core risk management operations.
- Regulatory status and legal enforceability: Large institutions are required by internal policies, regulators, and auditors to use regulated exchanges and central counterparties subject to tested capital, margin, and default waterfall rules
- Central clearing quality and default management: Perpetual platforms lack comparable regulatory recognition, cross-jurisdiction legal frameworks, and tested default processes at the scale required for multi-billion-dollar hedging programmes
- Governance, audit, and fiduciary requirements: Sovereign wealth funds and pensions cannot use unregulated venues for core risk management operations as a matter of legal and fiduciary obligation
- Liquidity depth and scale capacity: Order-book depth and position limits on most perpetual venues are not designed for the size and risk tolerance required by systemically important institutions
Perpetual futures serve retail participants and certain proprietary traders reasonably well, but they are fundamentally mismatched to the requirements of institutional hedgers and large professional market participants whose activity forms the economic backbone of regulated exchanges.
What CBOE’s outperformance tells you about where the moat actually is
CBOE’s relative resilience in 2026 offers an instructive data point. A genuine systemic threat to regulated exchange economics would be expected to hit the most entrenched franchises hardest, yet the opposite has occurred. CBOE, whose protected options business represents the sector’s deepest combination of regulatory and structural barriers to competition, has held up better than its peers. That outcome suggests the market recognises the moat concept in principle but has not applied it consistently across the broader sector.
Three bearish narratives, one common flaw
Each of the three stories behind the exchange selloff, liquidity rotation, rate sensitivity, and perpetual disruption, rests on a similar analytical weakness: a factor that is real but limited in scope gets treated as a fundamental threat to the underlying franchise.
Liquidity rotation is real: capital has moved in the direction of the real economy, reducing flows into certain parts of financial markets. Rate sensitivity is also real: net investment income is a line item that will face pressure if policy rates decline materially. And perpetual platforms have genuinely taken a share of retail activity. All of that is accurate. What none of it establishes is any meaningful erosion of the transaction-fee economics that actually drive exchange earnings.
One additional structural factor: exchanges carry a relatively modest footprint in major passive indices, which means the systematic, mandate-driven buying that supports many large-cap equities does not work in their favour during broad market de-risking. Price weakness can therefore persist beyond what fundamentals alone would justify, producing dislocations driven by flow mechanics rather than any change in business quality. (This dynamic is conceptually plausible per research but has not been independently documented from market data.)
Mechanical selling pressure from CTA unwinds and systematic deleveraging can hold prices below fundamental value for extended periods, a flow dynamic that affects exchange stocks with low passive index representation disproportionately relative to their actual earnings trajectory.
CME and ICE have compounded at approximately 18% and 15% annualised, respectively, through past disruption narratives, rate cycles, and geopolitical shocks. None of those episodes permanently impaired the franchise.
| Bearish narrative | What is real about it | What it misses | Evidence from the record |
|---|---|---|---|
| Liquidity rotation | Capital shifting toward real economy | Exchange volumes hit records during the same period | CME Q1 2026 record revenue; 2025 record ADV |
| Rate sensitivity | Net investment income may compress | Fee-based revenue is the dominant driver; rate volatility drives derivatives usage | Transaction fees and data revenue both hit records in Q1 2026 |
| Perpetual disruption | Retail volume has moved to perpetuals | Institutional clients cannot use unregulated venues for core risk management | CBOE (deepest moat) outperformed sector in 2026 |
The most coherent explanation for the selloff is sentiment, flows, and misperceived risk, not demonstrated impairment to the toll-road economics.
What historically cheap looks like, and what you do with it
A forward free cash flow yield above 5-6% on a business with CME’s operating track record represents a valuation dynamic that has not been common in this sector over the past two decades. ICE at roughly 15 times forward free cash flow against Visa at roughly 30 times sharpens the point: the market is pricing regulated exchange operators at a material discount to a toll-road comparable with a similar risk profile.
Framing the valuation gap through an implied growth rate reveals the precise revenue growth assumption the current price encodes, a more actionable test of whether CME and ICE are genuinely cheap or merely appear so relative to a single comparable.
The residual risks deserve honest acknowledgement. Valuation compression can persist longer than investors expect. The interest rate income tailwind from the early 2020s normalisation cycle may not repeat at the same magnitude. The exact 2026 valuation figures cited in this analysis are sourced from original market commentary rather than independently verified filings, and warrant independent verification before any investment decision.
The structural case, stated plainly, rests on three pillars:
- Operating leverage: a largely fixed cost base that converts volume growth into margin expansion
- Volatility as tailwind: the macro environments investors fear most are the environments that generate the highest exchange volumes
- Institutional moat against perpetuals: regulatory, fiduciary, and infrastructure requirements that structurally protect the core client base
The bearish narratives have not demonstrated franchise impairment at the operational level. The evidence, as presented, points toward a sentiment-driven opportunity rather than a structural problem. Whether you act on that assessment depends on your own due diligence and risk tolerance.
This article is for informational purposes only and should not be considered financial advice. Investors should conduct their own research and consult with financial professionals before making investment decisions. Valuation multiples and share price performance data cited are sourced from original analysis and have not been independently verified from market data sources; past performance does not guarantee future results.