USD/JPY is trading near 156 in early September 2026, and on the surface that looks like the same old story: a wide rate gap, a weak yen, and a currency that refuses to strengthen no matter what Tokyo does.
But something has shifted beneath the price.
Finance Minister Satsuki Katayama has spent recent days warning about conditions in Japan’s bond market, a signal that policymakers are now watching yields as closely as they watch the currency. Those warnings landed just months after Katayama sat across from US Treasury Secretary Scott Bessent in Washington, where the two agreed to tighten their communication on exchange rates and fiscal credibility.
That combination, a nervous bond market at home and active diplomacy abroad, is reshaping how the yen trades.
The pair is no longer moving on Bank of Japan interest rates alone. It is caught between Japan’s ballooning debt, a shrinking yield advantage for the dollar, and the ever-present threat of intervention.
What follows here gives you a clear framework for evaluating your yen exposure against these shifting fiscal, diplomatic, and monetary pressures, so you can judge which forces matter most for the position you actually hold.
The fiscal reality and bond market vigilance
For years, the market treated USD/JPY as a pure interest rate trade. That framing is now incomplete, because Japan’s sovereign debt has become an active constraint on how far the Bank of Japan can go.
The numbers explain why. Japan’s gross public debt sits near 240% of GDP, the highest of any advanced economy, according to the International Monetary Fund’s 2025 Article IV report. Servicing that debt gets more expensive with every basis point that yields climb.
And yields are climbing. On 1 September 2026, the benchmark 10-year JGB yield touched 3% for the first time since 1996, according to Reuters. A Ministry of Finance auction that same day cleared at a weighted average yield of 2.995%.
Meanwhile, the Bank of Japan’s uncollateralised overnight call rate sits at 1.00%, held steady at the July 2026 meeting after a 25 basis point hike in June 2026 lifted it from 0.75%.
Here is the pressure point. Katayama has acknowledged Prime Minister Takaichi’s figure of roughly 40 trillion yen in new government bond issuance as carrying significant weight. Financing that much new debt into a rising yield environment directly threatens the government’s budget.
On preserving credibility: Finance Minister Katayama has emphasised that Japan intends to keep transparently explaining its policy stance to financial markets in order to preserve credibility, a signal that managing fiscal trust is now an active priority.
This is the part you need to internalise. Japan’s debt-to-GDP ratio functions as a physical ceiling on how high the Bank of Japan can raise rates before it breaks the domestic economy.
That matters directly for your yen exposure. If the central bank cannot hike aggressively without blowing up the government’s finances, then the natural support the yen receives from rising Japanese rates is capped. Anyone expecting a wave of aggressive tightening to power a strong yen rally is likely overestimating how much room the Bank of Japan actually has.
When big ASX news breaks, our subscribers know first
Understanding the US-Japan yield gap and carry trade mechanics
To see why a narrowing rate gap threatens the yen-short crowd, you first need to understand what has held the trade together for years.
USD/JPY is the market’s most-used carry trade. The mechanism is straightforward: investors borrow yen at a low interest rate, convert to dollars, and buy higher-yielding dollar assets. As long as the yen does not strengthen enough to cancel out that interest advantage, the trade earns the difference between the two rates.
The carry trade mechanics that keep USD/JPY elevated even after a series of BoJ hikes are rooted in three decades of near-zero yen borrowing costs, which embedded yen funding into the architecture of global capital flows in ways that a 1% policy rate alone cannot unwind.
That difference is the entire engine. When US rates sit far above Japanese rates, holding dollars against yen pays you to wait, and capital floods toward the dollar.
The yield spread quantifies that advantage. Empirical estimates suggest a 100 basis point change in the US-Japan 10-year yield spread tends to move USD/JPY by roughly 4 to 6 yen over a 6-to-12-month period, giving you a rough sense of how sensitive the pair is to shifts in the gap.
There is also a breakeven point where the carry stops paying. The unhedged carry breakeven sits near 1.9%, meaning the yen can appreciate by roughly that much before it wipes out the interest income a long-dollar position earns. Cross that line, and the trade turns into a loss.
The breaking point of the carry trade
The problem for the carry crowd is that the yield advantage has been shrinking fast.
The US-Japan 10-year spread has compressed from roughly 525 basis points at its July 2024 peak to approximately 180 basis points by early September 2026, according to WorldGovernmentBonds data. That is a collapse of nearly two-thirds in the buffer that once made the trade so lucrative.
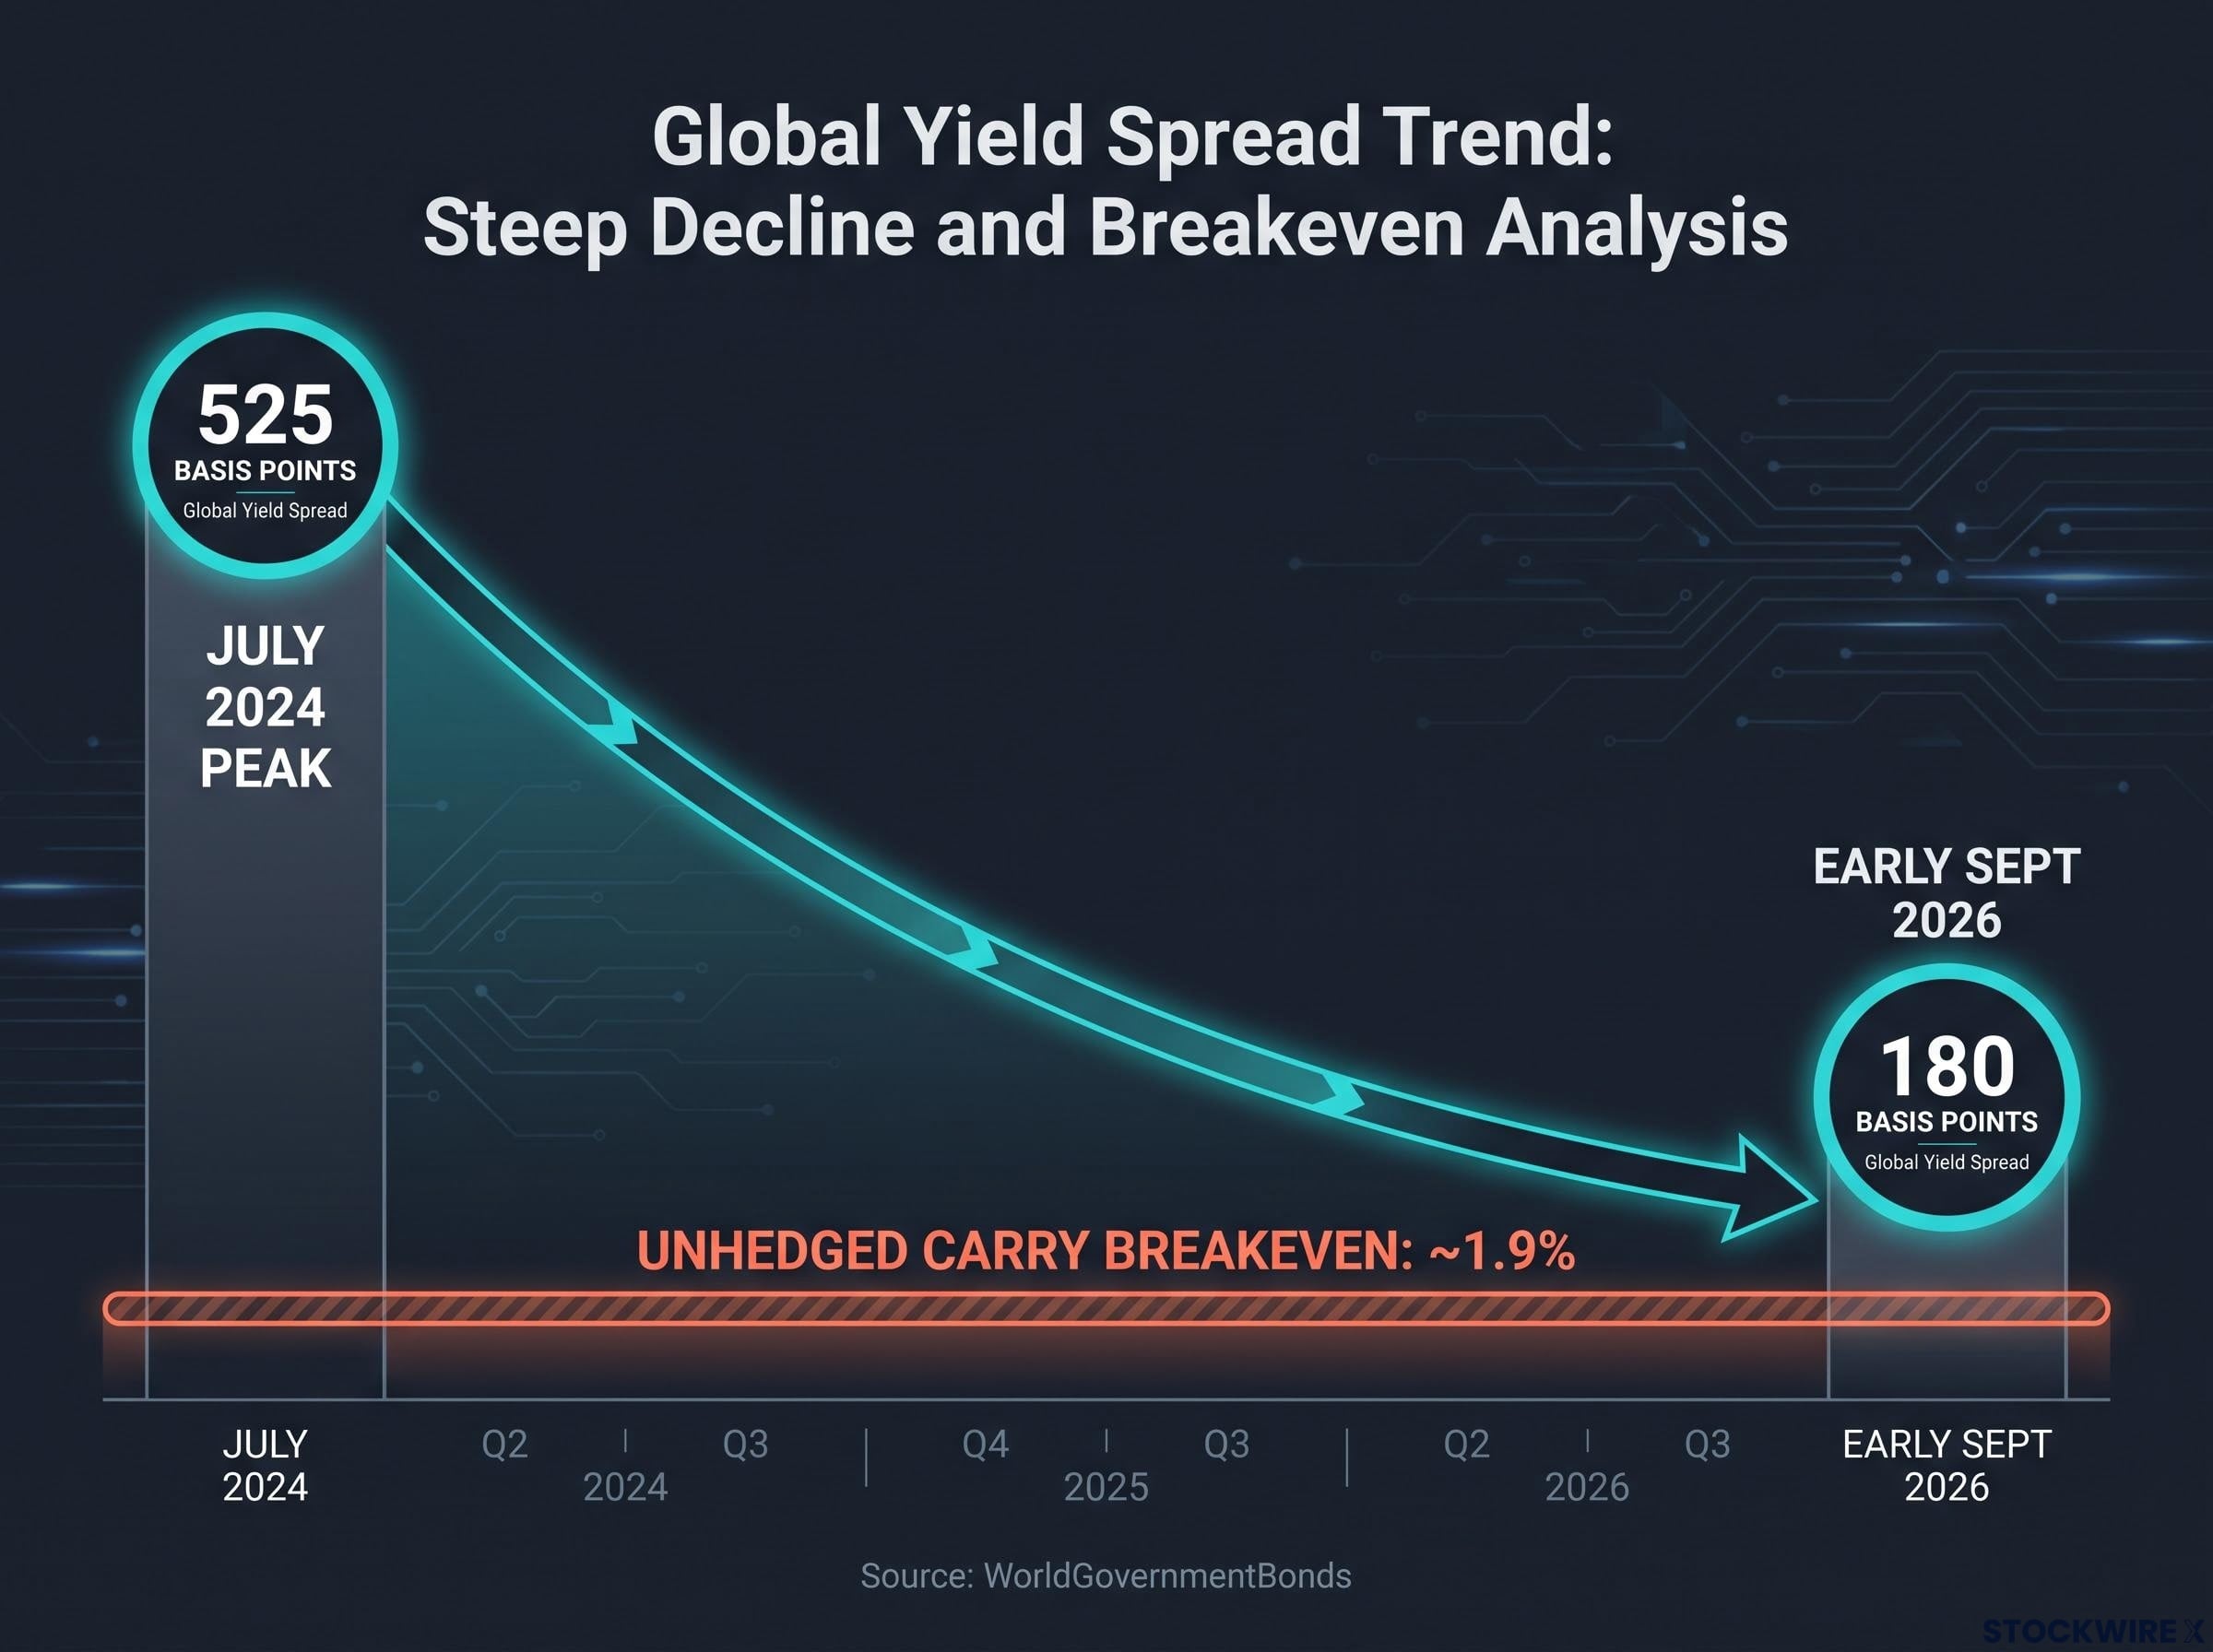
As the gap narrows, the cushion protecting your position gets thinner. With breakeven near 1.9% and the spread still tightening, the margin for error on a long-USD/JPY carry position is far smaller than it was two years ago.
This is where your own exposure becomes vulnerable. A rapid compression in the differential, or a sudden spike in global volatility, can trigger a fast unwind. Carry trades are highly sensitive to volatility, and a single sharp yen rally can erase months of accumulated interest income in days, forcing traders to bail out all at once.
Sizing carry trade unwind risk accurately requires distinguishing between the speculative, leveraged participants who drive episodic stress and the systemically critical institutions whose collective behaviour would be needed to produce a genuine structural breakdown, a distinction that the August 2024 episode ultimately confirmed.
The August 2024 episode showed exactly how violent that can be, when USD/JPY fell from the 160s into the low 140s within weeks. Understanding the mathematical threshold where the carry stops paying is what lets you set realistic stop-losses and size positions before that kind of reversal catches you off guard.
Diplomatic cover and the FX intervention ceiling
Rate math tells you where the yen wants to trade. Politics tells you where it is allowed to.
In April 2026, Katayama met Bessent in Washington, and the two agreed to strengthen communication on exchange rates. Katayama has said he explained Japan’s push for fiscal sustainability and economic expansion, and that Bessent responded positively, contradicting media reports that a specific demand had been made.
Crucially, Bessent has stated his view that the yen is undervalued, attributing that primarily to the interest rate differentials between Japan and other economies.
That single assessment matters more than it might first appear. When the US Treasury publicly acknowledges the yen is too cheap, it hands Tokyo tacit approval to defend its currency without triggering accusations of manipulation.
And Japan has a well-documented history of doing exactly that. Total intervention in 2024 reached approximately 15.2 trillion yen, roughly 98.5 billion US dollars, with documented operations recorded near several specific levels.
The most recent instance of coordinated yen intervention, in which the US deliberately sold euro reserves rather than dollars or Treasuries to avoid flooding the US sovereign bond market with supply, reveals how tightly the bilateral diplomatic channel between Tokyo and Washington has become embedded in the intervention architecture.
Here is the established pattern of defence across the recent cycle:
- October 2022: Authorities intervened as the yen approached 152 per dollar, spending roughly 6.35 trillion yen.
- April to May 2024: Record yen-buying near 160, with about 9.8 trillion yen spent over the 29 April and 1 May operations alone.
- Documented 2024 levels: Interventions clustered near 157.99, 159.45, 160.17, and 161.76 per dollar.
- July 2024: Suspected operations as USD/JPY tested roughly 161.96.
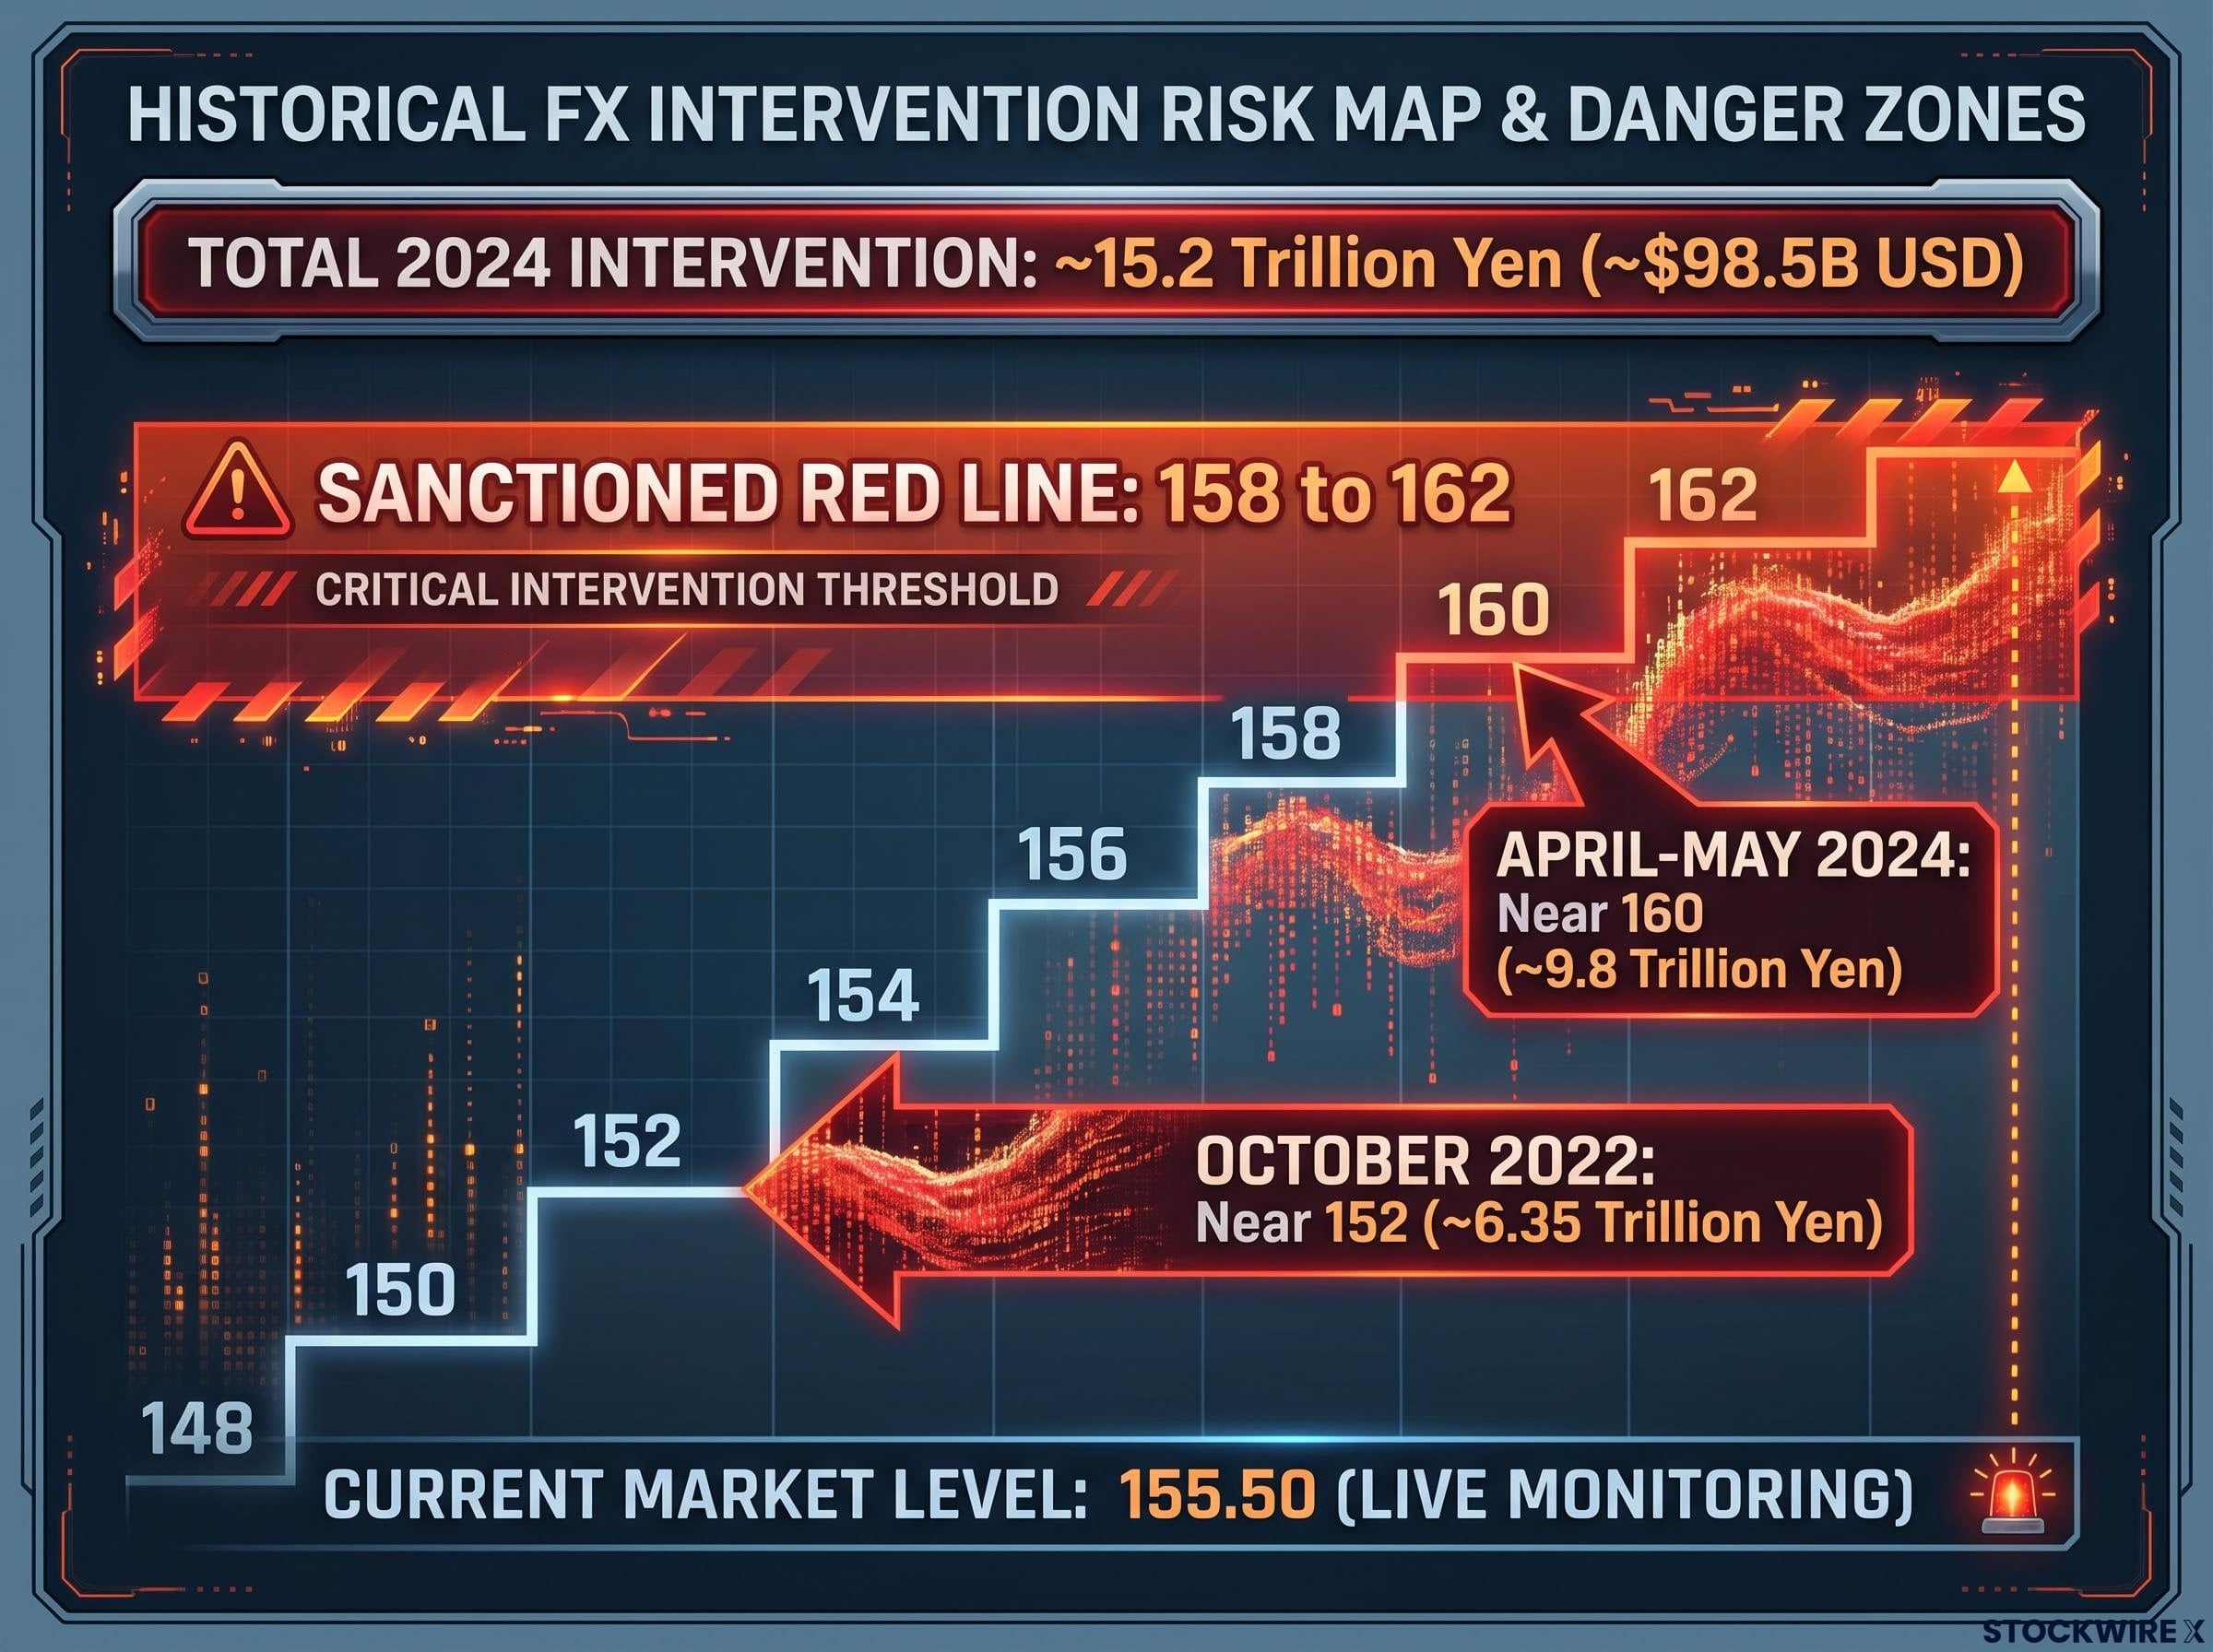
This is the read you should take from it. The 158 to 162 zone is not just technical resistance on a chart. It is a politically sanctioned red line, backed by both Tokyo’s willingness to spend and Washington’s tacit blessing.
For anyone holding long USD/JPY, that changes your risk and reward calculation. The upside above 158 is capped by the credible threat that institutional buying could wipe out gains in a single session, which makes that zone a logical place to consider taking profit rather than pressing the bet.
Diverging institutional outlooks for late 2026
So where does the pair actually go? The forecasters are split, and the split itself is the most useful information you have.
The competing views break into three camps, each resting on a different reading of which force wins out.
| Outlook | Target level | Primary rationale |
|---|---|---|
| Bullish (BNP Paribas, FXEmpire) | Stabilise around 155-160 | Slow, politically constrained BoJ normalisation and resilient US growth keep rates capped and the dollar supported. |
| Consensus (Bank of America, combined estimates) | Drift toward 152 | Gradual spread compression pulls the pair lower, but it stays well above pre-pandemic levels. |
| Bearish (UBS, ING) | Toward 138-140 | Rate has deviated strongly from fair value; narrowing real yield gaps drag it down. |
The case for persistent dollar dominance
The bullish camp rests on a simple premise: the Bank of Japan moves too slowly to matter.
FXEmpire has stressed that BoJ normalisation is slow and politically constrained, which limits durable yen strength even as inflation rises. BNP Paribas takes a similar line, suggesting USD/JPY stabilises near 160 into the fourth quarter of 2026, with rate increases expected to crawl only toward a terminal rate around 2% by the end of 2027.
For you, this scenario means the yield gap stays wide enough for long enough that the dollar holds its ground. Pullbacks are treated as temporary rather than the start of a trend.
The argument for yen recovery
The bearish camp bets that math and fiscal reality eventually win.
UBS has projected USD/JPY falling toward the 138 to 140 range, arguing the pair has deviated strongly from the fair value implied by narrowing US-Japan yield spreads. ING ties its call for a lower pair explicitly to the combination of Fed cuts and BoJ hikes compressing the differential.
The sharpest risk in this camp is the unwind. During global stress episodes, yen-funded carry trades collapse and the currency rallies hard regardless of the rate gap, which is precisely how the August 2024 rout unfolded.
Your task is not to pick the smartest forecaster. It is to identify which of these three scenarios best fits your own risk tolerance and time horizon, then stress-test your positions against the other two so a single credible outcome does not blindside you.
Navigating yen exposure as policy divergence narrows
Three forces are now converging on the same currency. Japan’s debt ceiling limits how far the Bank of Japan can hike, the shrinking yield gap erodes the carry that supported a weak yen, and the intervention threat caps how high the dollar can climb.
The result is a currency in transition. As the policy gap between the US and Japan narrows, USD/JPY becomes far more sensitive to incoming US economic data than to Bank of Japan moves alone. A soft US inflation print or a dovish Fed shift could now do more to the pair than another quarter-point from Tokyo.
The practical takeaway is this. If you hold or are considering exposure to Japanese assets, treat the coming months as a period of two-sided risk rather than a one-way bet, and watch the US data calendar as closely as you watch the Bank of Japan.
For investors wanting a structured monitoring checklist before the next deleveraging episode, our dedicated guide to yen market warning signals maps the three conditions that preceded the 2024 S&P 500 decline, including the specific USD/JPY technical level that Bank of America estimates could trigger $100 billion in programmatic CTA selling.
This article is for informational purposes only and should not be considered financial advice. Investors should conduct their own research and consult with financial professionals before making investment decisions. Past performance does not guarantee future results, and financial projections are subject to market conditions and various risk factors. These statements are speculative and subject to change based on market developments.