Gold is trading above $4,500 per ounce. A sitting U.S. vice president has publicly branded Federal Reserve inaction “monetary malpractice.” And markets are repricing the odds of a rate hike by the week, not the month. That combination is not how a healthy, orderly monetary system is supposed to behave.
For any investor, the question underneath all this is uncomfortably simple: is the central bank still making decisions on its own terms, or is it being steered by the government’s borrowing needs? That condition has a name, fiscal dominance, and it touches every corner of a portfolio, from commodities to currency-sensitive equities to the government bonds many treat as risk-free.
The link between fiscal dominance and gold prices is now one of the most consequential debates in markets. Read on and you will be better equipped to judge whether this rally reflects a durable structural shift or a narrative-driven overshoot, and which specific signals separate the two.
What fiscal dominance actually means, and why the 2025-2026 episode is being taken seriously
Start with what the reader has already seen: senior political figures publicly leaning on the Fed to cut rates. That pressure is not just noise. It is the visible surface of a well-documented economic condition.
Fiscal dominance describes a state in which a government’s financing needs begin to constrain the central bank’s policy choices, rather than the central bank acting purely on its price-stability mandate. When debt service becomes politically unmanageable, the pressure is always toward lower rates and more tolerance for inflation.
The 2025-2026 episode has three unusually public data points, each tying an inflation print directly to a demand for easier policy:
- 11 June 2025: Vice President JD Vance called Fed inaction “monetary malpractice” in a post on X, citing May CPI at +0.1% month-on-month and +2.4% year-on-year, with the policy rate held at 4.25%-4.50%.
- 11 December 2025: After a 25-basis-point cut, President Trump was reported as pleased but wanting “more should be done to lower interest rates,” per White House spokesperson Karoline Leavitt.
- 18 December 2025: White House adviser Kevin Hassett reacted to softer inflation data with “there’s lots of room for the Fed to cut rates.”
The transmission channel is credibility. Public political pressure erodes market confidence that the central bank will prioritise its mandate, and that erosion alone can move asset prices before any policy actually changes.
Fed independence under Warsh became a live market variable from the moment of his 54-45 Senate confirmation in May 2026, with markets repricing bond yields and the dollar on any policy signal that appeared to track presidential preferences rather than economic data.
You can see it in the tape. When Governor Waller struck a markedly less hawkish tone than Chair Warsh had days earlier, the market-implied probability of a hike fell from roughly 68% to 51% inside a single week.
Analyst Jack Vanderhoff, in a February 2026 note on central-bank gold buying, argued that as fiscal dominance intensifies and markets doubt whether policymakers remain focused on inflation, that credibility erosion “drives gold demand” as investors seek assets outside the political system.
That 17-percentage-point swing tells you something important. Markets are not dismissing political commentary as background chatter; they are pricing it into the expected path of interest rates in real time. For your own decision-making, that reframes political statements about monetary policy as market-relevant information rather than theatre.
When big ASX news breaks, our subscribers know first
How gold markets have responded, and what the price trajectory reveals about investor conviction
The price record does not read as a single fear spike. It reads as a sequence of escalating conviction, and the numbers make the case better than any assertion could.
Late in 2025, spot gold set a record close of $4,440.21 on 22 December 2025, with an intraday print near $4,530 across 25-26 December. Both moves were tied to safe-haven flows and expectations of Fed cuts.
Then January accelerated. On 26 January 2026, gold pushed past $5,100, briefly touching $5,102. Two sessions later, on 28 January 2026, it jumped 4% to $5,393.19, by which point it had gained more than 25% year-to-date.
| Date | Price Level | Move / Context |
|---|---|---|
| 22 Dec 2025 | $4,440.21/oz | Record close, safe-haven and rate-cut bets |
| 26 Jan 2026 | $5,102/oz | Fresh record, strong central-bank and retail demand |
| 28 Jan 2026 | $5,393.19/oz | +4% session, more than 25% YTD gain |
| 3 Sep 2026 | ~$4,493.33/oz | Overnight reading of $4,523 (+2.5%) |
This move sits inside a broader hard-asset rotation. Over the 20-day window into early September 2026, metals and mining was the top-performing sector under review, up 5.4%.
A gain above 25% by late January, a partial retracement, then a renewed push back above $4,500 by September, tells you this is not a momentum blip. It is a sustained repositioning that has survived multiple inflation releases and shifts in Fed communication.
That persistence matters because it rules out the simplest counter-explanation: that gold was just a short-lived panic trade. Buying that holds through changing rate probabilities and strong growth data looks structural, and structural tailwinds tend to last longer than fear does.
Where prices stand heading into the final quarter of 2026
By 3 September 2026, spot gold sat near $4,493.33, with that overnight jump to $4,523. What makes the moment analytically interesting is what rate markets were saying at the same time.
As of 26 August 2026, CME FedWatch showed a 44% probability of a September hike, up from 36% before the August inflation data. So hike expectations were rising even as gold stayed elevated.
That tension is worth flagging rather than smoothing over. If the market genuinely expected tighter policy, textbook logic would pressure gold. Its resilience suggests something other than pure rate mechanics is holding a bid under the metal.
The historical record: what past episodes of fiscal dominance did to hard assets
This dynamic is not new, and that is precisely why it is being taken seriously now. The clearest precedent runs from 1940 to 1975 in the United States.
During that period, the Fed held long-term rates artificially low and maintained yield caps to help finance Treasury debt through World War II and the early postwar years, even where that compromised its inflation objectives. A Cleveland Fed working paper identifies three mechanisms that enabled it:
The Cleveland Fed working paper on fiscal dominance identifies three structural preconditions that allowed yield-cap policy to persist for decades: existential wartime financing pressures, banking-sector fragility, and a non-auctioned Treasury debt structure, all of which set a documented baseline for comparing the 2025-2026 episode.
- Existential national security concerns during and after the war.
- Fears of banking-sector instability.
- A Treasury financing structure in which debt was not auctioned.
The 1951 Treasury-Fed Accord marked the point at which independence was formally reasserted. The lesson is that high debt loads combined with prominent political imperatives are the same preconditions that produced yield-cap policy before, and markets are now pricing that parallel.
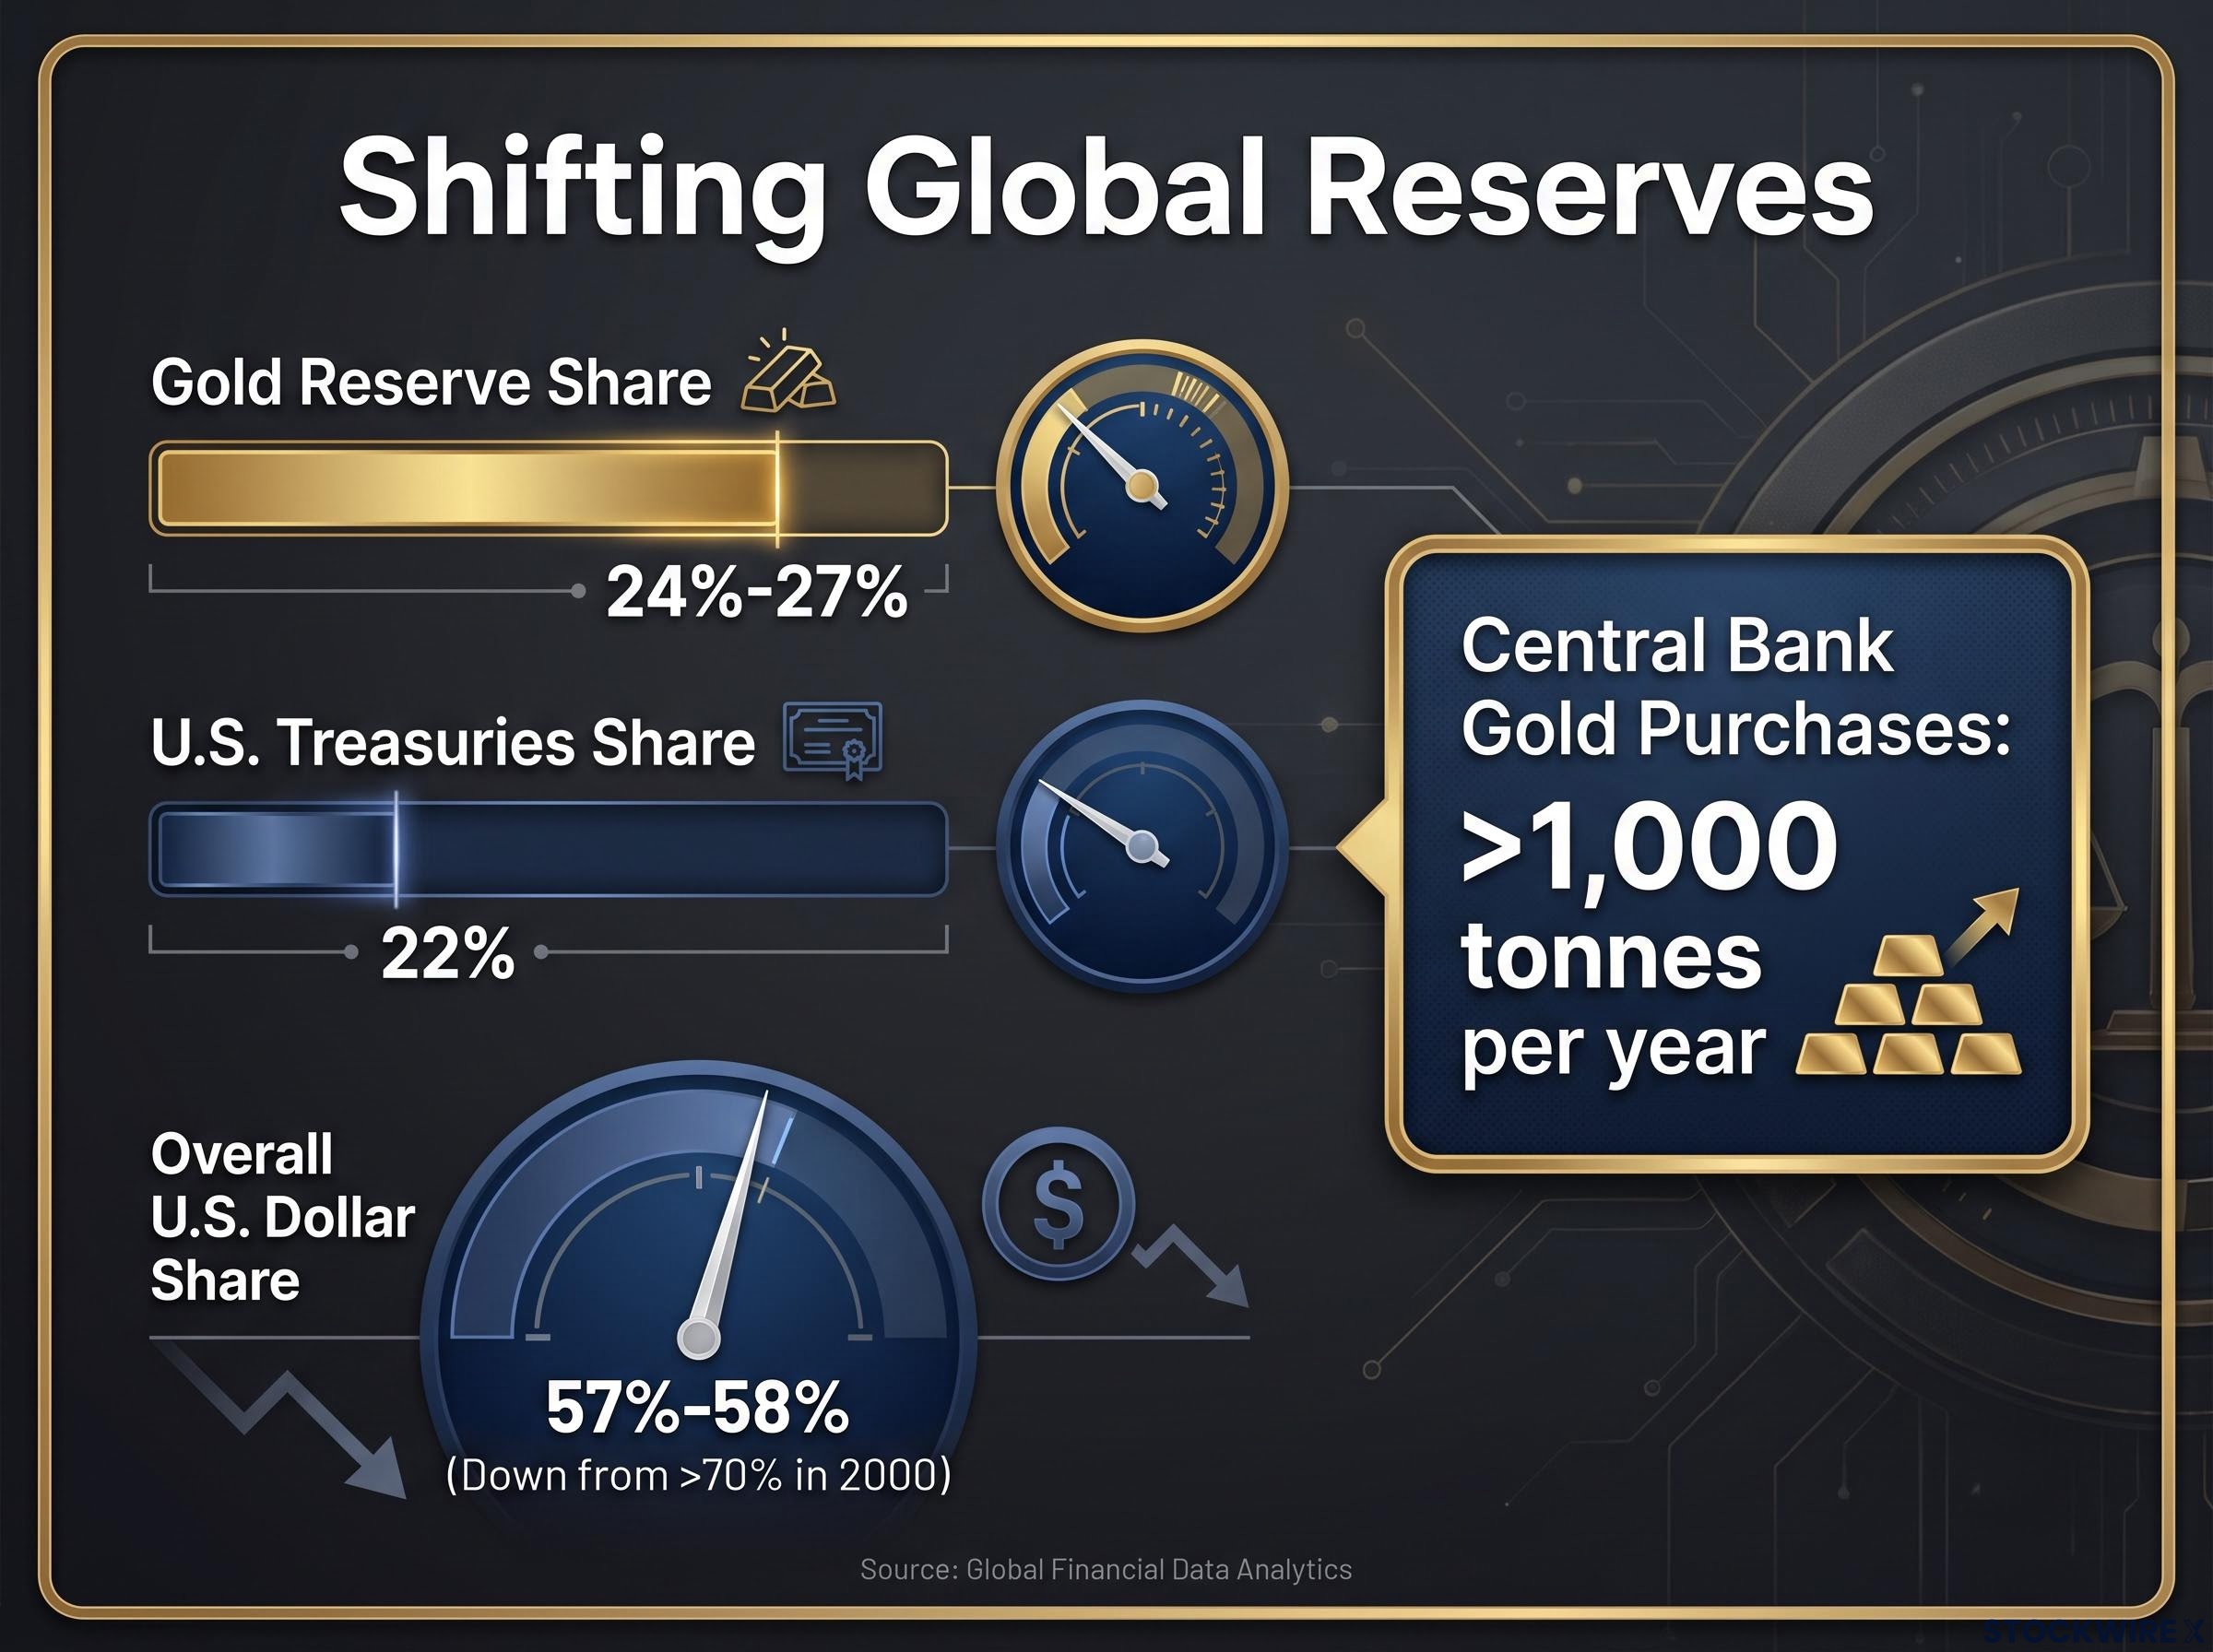
The modern institutional expression of this hedge is central-bank reserve behaviour. Central banks have been net buyers of gold since 2009, purchasing more than 1,000 tonnes per year in recent years, including over 1,000 tonnes in 2024.
Central bank gold buying in Q2 2026 reached 288.9 tonnes, the highest second-quarter total on record, but the institutional logic driving that accumulation — jurisdictional safety and sanctions-proofing rather than price speculation — is categorically different from the fiscal dominance hedge retail investors are typically expressing.
Gold’s share of global official reserves has risen to roughly 24%-27%, a level that in some analyses now surpasses the share held in U.S. Treasuries, while the dollar’s share has slipped to around 57%-58%, down from over 70% in 2000.
Research published by MDPI draws a useful distinction here, separating active de-dollarisation (net gold purchases) from passive de-dollarisation (gold’s reserve share rising simply because its price climbed). That difference becomes central to the counter-case.
When the very institutions whose core operational interest is monetary credibility are allocating more than 1,000 tonnes a year into gold, you should read that as a credibility signal from the inside, not a retail sentiment gauge. History confirms fiscal dominance is a recurrent structural condition with documented asset-price consequences, which means the current episode comes with a playbook you can reference rather than improvising in real time.
The counter-case: what fiscal dominance does not explain about the gold rally
Here is where a sophisticated read requires holding two ideas at once. The fiscal dominance narrative is powerful, but serious institutional research pushes back, and that pushback is not a straw man.
Three genuine counter-arguments deserve weight:
- Independence looks structurally intact. A Federal Reserve international finance discussion paper from May 2025 found that gold reserve accumulation is generally not associated with de-dollarisation at the country level, except in a few prominent cases, with the dollar still central to reserve composition.
- Much of the reserve shift is price-driven. Financial Express analysis from August 2026 noted gold’s 27% reserve share overtaking U.S. Treasuries at 22% was driven almost entirely by gold’s rising price, not by deliberate portfolio reallocation.
- Sanctions risk is an alternative primary driver. Man Group (April 2025) linked record buying partly to a desire for sanction-proof assets after Russia’s reserves were frozen.
The price-versus-allocation distinction carries real weight for how you size exposure. If gold’s rising reserve share is mostly a mechanical effect of a higher price rather than active dollar abandonment, that is a materially different story from institutional flight from the dollar.
The OMFIF Global Public Investor survey released 30 June 2026 captured a measurable inflection in de-dollarisation intent, recording the first instance on record where net dollar-reduction intent among sovereign institutions outnumbered net dollar-increase intent, a data point that sits underneath gold’s elevated price floor regardless of whether fiscal dominance proves to be the dominant driver.
And it has a direct implication for you. A premium built on narrative can compress far faster than a premium built on structural allocation. If political pressure on the Fed eases, a price-driven story unwinds more quickly than a genuine reallocation would.
Sanctions risk and the “nobody’s liability” argument
Man Group and Rabobank-sourced research frame gold’s appeal in geopolitical terms. It is nobody’s liability, it cannot be frozen abroad, and that makes it a neutral reserve asset regardless of any view on central-bank independence.
Rabobank attributed the 2024 purchases above 1,000 tonnes to hedging geopolitical, sanctions, and counterparty risk rather than fiscal dominance expectations.
This driver is additive, not mutually exclusive. Gold can be a sanctions hedge and a fiscal dominance hedge simultaneously, but the purchasing behaviour makes sense even if fiscal dominance turns out to be overstated. Holding both explanations is exactly the posture you need to judge whether your gold position is sized for regime change or for a high-conviction but reversible premium.
Sizing the signal correctly before the next Fed decision
This is not a forecast of where gold goes next. It is a map of the signals that will distinguish a durable structural shift from a narrative-premium episode.
Two variables will settle the debate. The first is whether political commentary continues to track actual Fed decisions, and the second is whether central-bank gold purchasing holds above the 1,000-tonne threshold in the next annual data cycle.
The near-term test is the September 2026 Fed meeting. Deliver a hike despite the political noise, and the independence narrative strengthens, which could compress gold’s fiscal dominance premium. Defer it, or let the rhetoric soften in a way that tracks political pressure, and the narrative gains empirical support.
The rate probabilities frame the stakes. As of 26 August 2026, markets priced a 44% chance of a September hike, yet after Jackson Hole on 18 August 2026 they were pricing an 88% probability of at least one hike by December.
The clearest single illustration of narrative-driven repricing remains that intra-week swing, when the implied probability of a hike moved from 68% to 51% in one week on a shift in Fed tone.
That gap between 44% for September and 88% by year-end tells you markets are not doubting that tightening will happen, only when. Timing uncertainty is precisely where fiscal dominance fears insert themselves most forcefully, especially with the U.S. services PMI prices-paid component elevated, the setting in which a politically pressured hold would look most conspicuous.
Track these signals:
- Political statement cadence relative to data: rhetoric that intensifies as inflation cools is the fiscal dominance tell.
- Central-bank purchase volumes: a hold above 1,000 tonnes supports the structural case; a drop undercuts it.
- Fed meeting outcomes versus pre-meeting rhetoric: a hike into political pressure favours independence; a deferral favours the dominance thesis.
Watching the gold price alone will not tell you which driver is in control at any given moment, because the price reflects all of them at once. Reading these signals as they emerge puts you in a stronger position than simply reacting to the tape.
For investors wanting to stress-test their signal framework before the September Fed meeting, our full explainer on gold price prediction documents three historical rate cycles where gold produced outcomes that directly contradicted widely cited trading rules, including a 20% drawdown during the 2022-2023 tightening cycle despite simultaneous 9.1% inflation and active geopolitical conflict.
This article is for informational purposes only and should not be considered financial advice. Investors should conduct their own research and consult with financial professionals before making investment decisions. Past performance does not guarantee future results. Financial projections are subject to market conditions and various risk factors, and forward-looking scenarios are speculative and subject to change based on market developments.