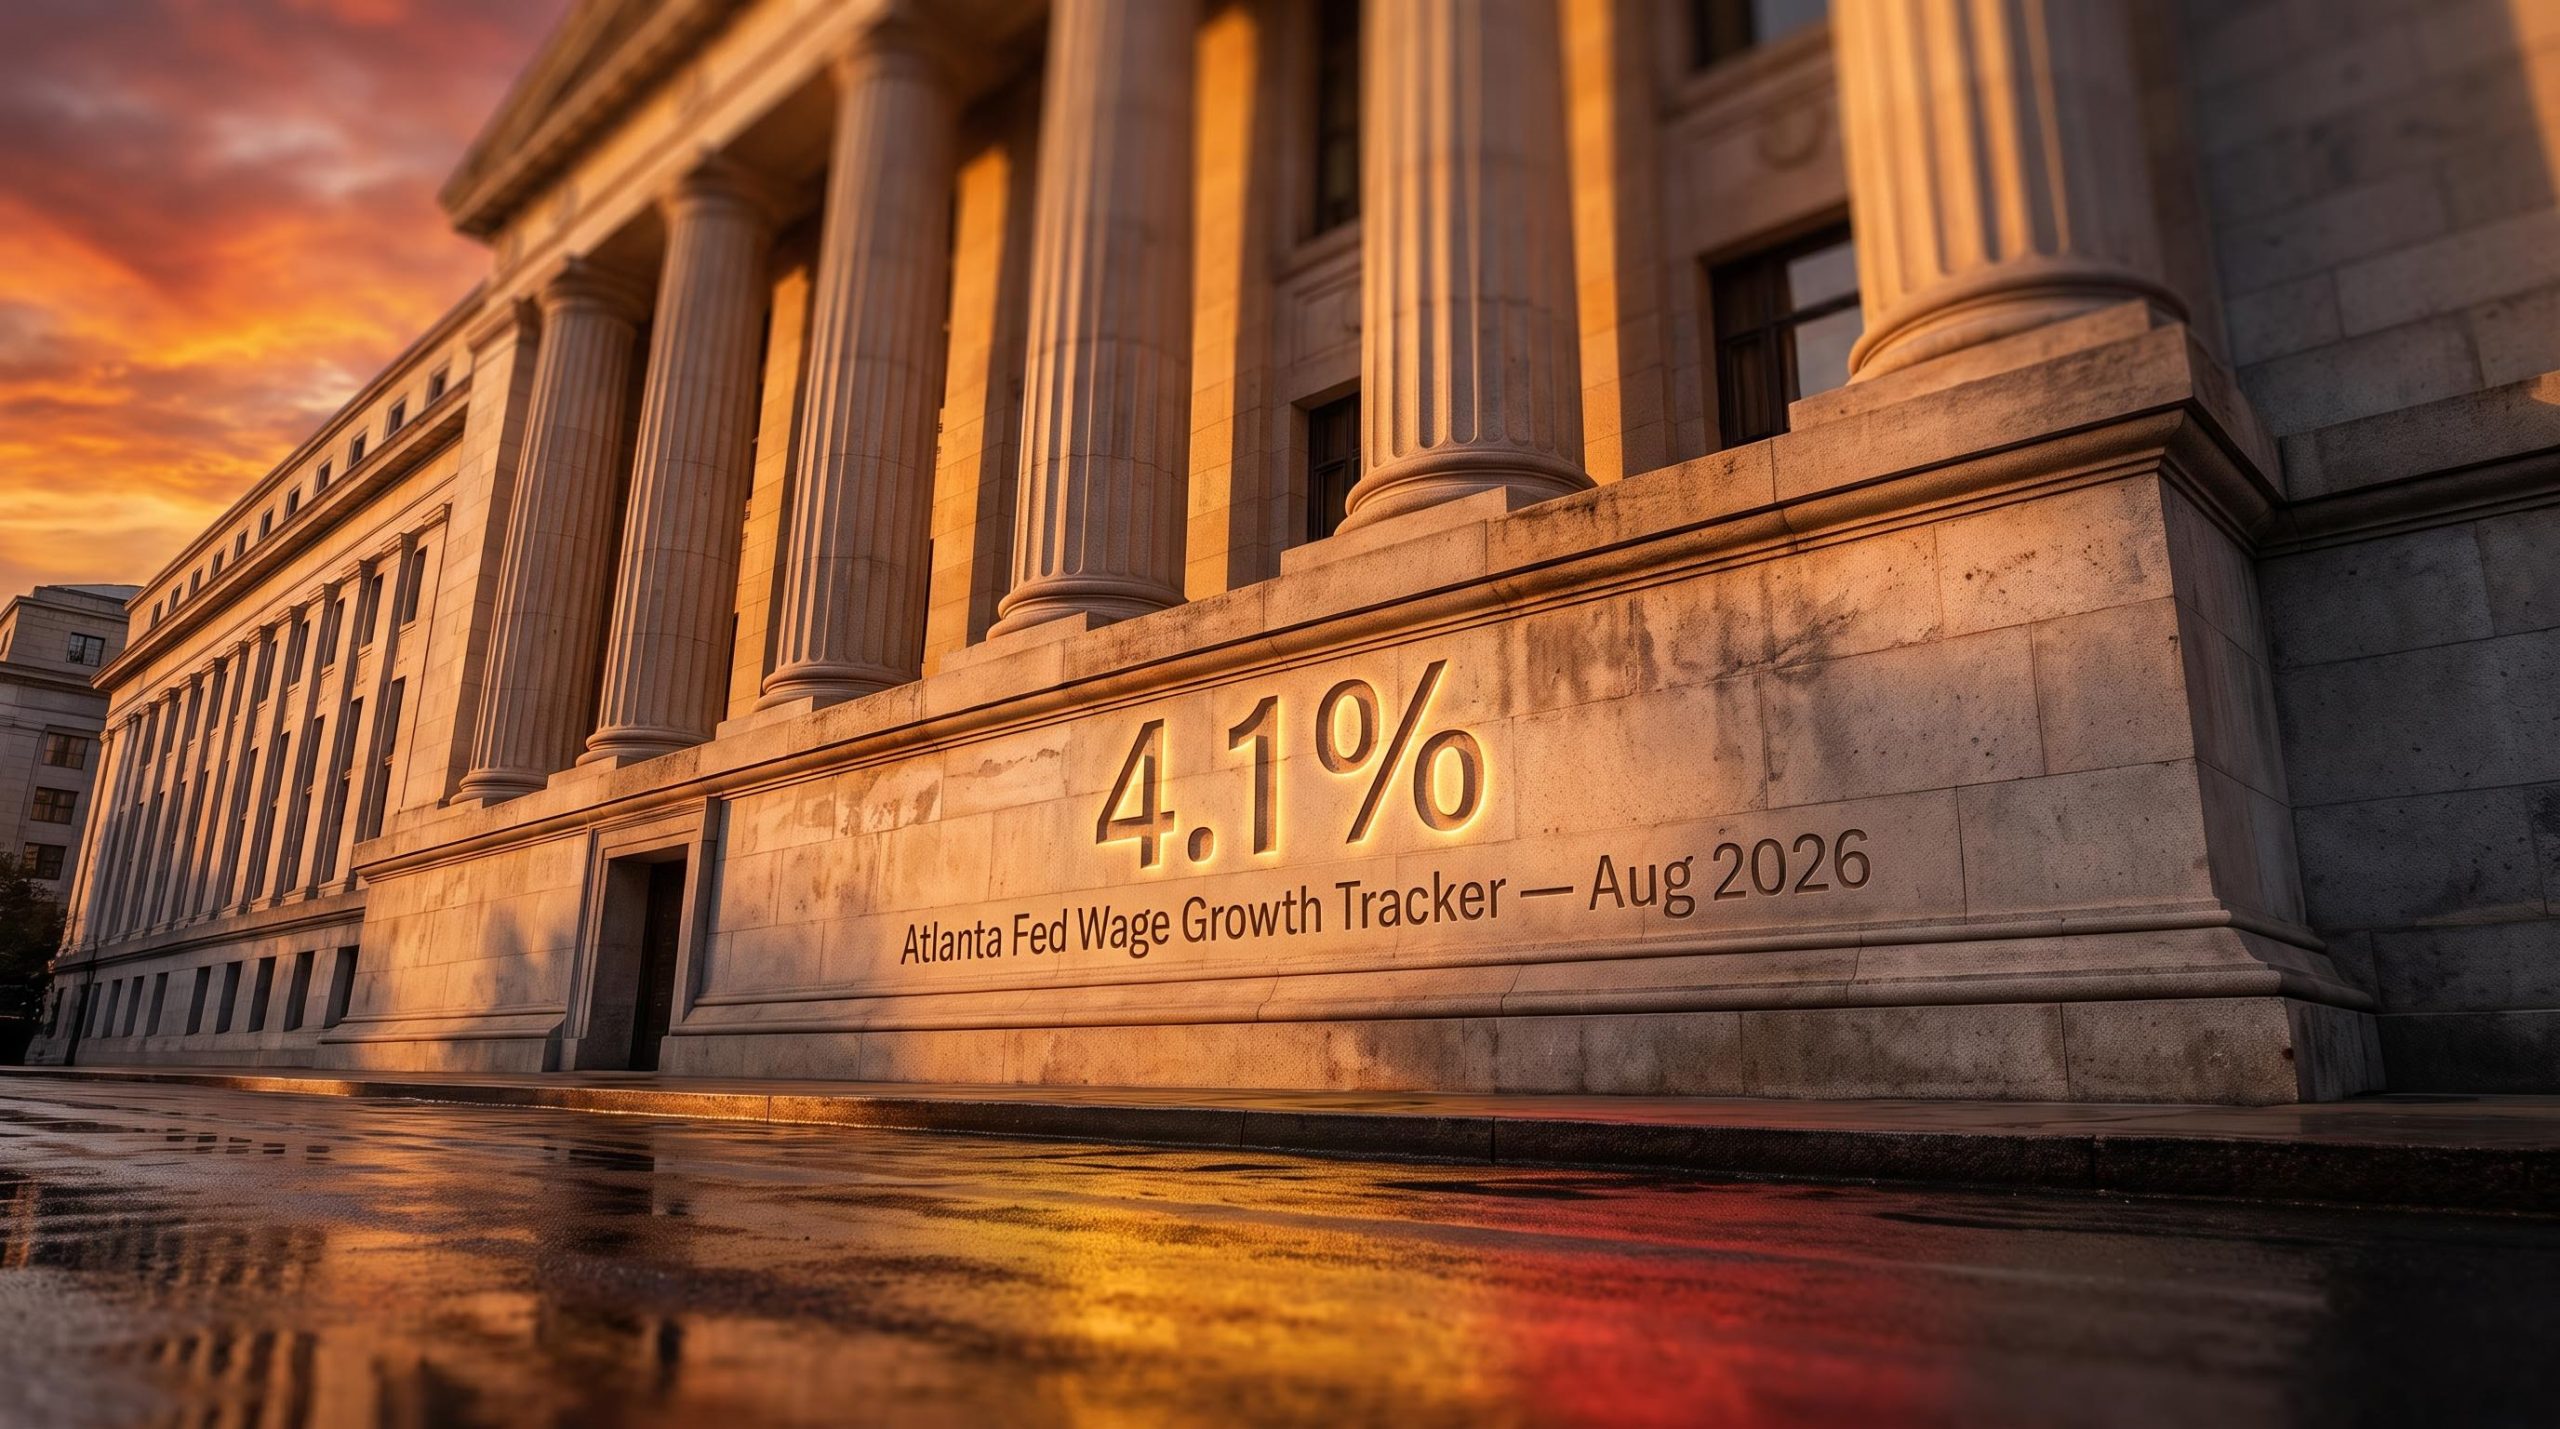
The U.S. unemployment rate sits at 4.1%. Wage growth just ticked up to 4.1% year-over-year. On the surface, that looks like the standard inflation story: too much demand chasing too few workers. But the causality may be running the other way, and most investors are still watching the wrong variable.
The real pressure is coming from the supply side. Over the past year, the labour force itself has been quietly contracting, driven by immigration enforcement and softening participation. That changes what the unemployment rate is actually telling you. A 4.1% reading in a shrinking workforce is not the same signal as 4.1% in a stable or growing one, because fewer workers now need to find jobs to push that number lower.
That asymmetry is feeding wage pressure without requiring a hiring boom, and it sits at the centre of the debate over US labour force inflation. What follows below is a breakdown of the structural forces that could keep inflation stickier than consensus expects, and what that means for how you should read the Federal Reserve’s next move.
How a shrinking labour pool is quietly rebuilding wage pressure
Start with the arithmetic, because it is where the story breaks from the textbook version. The U.S. workforce has contracted over the past year as undocumented workers left the country and overall participation drifted lower. According to the Bureau of Labor Statistics, the civilian labour force participation rate stood at 61.6% (seasonally adjusted) in August 2026.
A smaller labour pool changes the mechanics of the unemployment rate. As BCA Research points out, when the workforce shrinks, fewer new jobs are needed to produce a decline in unemployment. The 4.1% unemployment rate reported for August 2026 can therefore hold steady, or even fall, without the strong hiring that would normally accompany it.
Now look at where labour demand actually sits, because the two most common signals are pointing in opposite directions.
The July 2026 payroll contraction of 23,000 jobs, the largest negative surprise in more than two years, confirmed that the depressed hiring rate BCA Research identifies as the more reliable demand signal is not a temporary soft patch but a sustained directional trend.
- Job openings: BCA Research assesses these as inflated. The low cost of posting vacancies online means published openings may overstate genuine employer demand rather than reflect it.
- Hiring rate: Depressed, and treated as the more reliable read. A falling hiring rate suggests employer demand for workers has receded, not surged.
So demand is softening while supply is being squeezed. That combination is the pressure channel. Wages are not rising because the economy is overheating; they are holding firm because there are structurally fewer workers to go around.
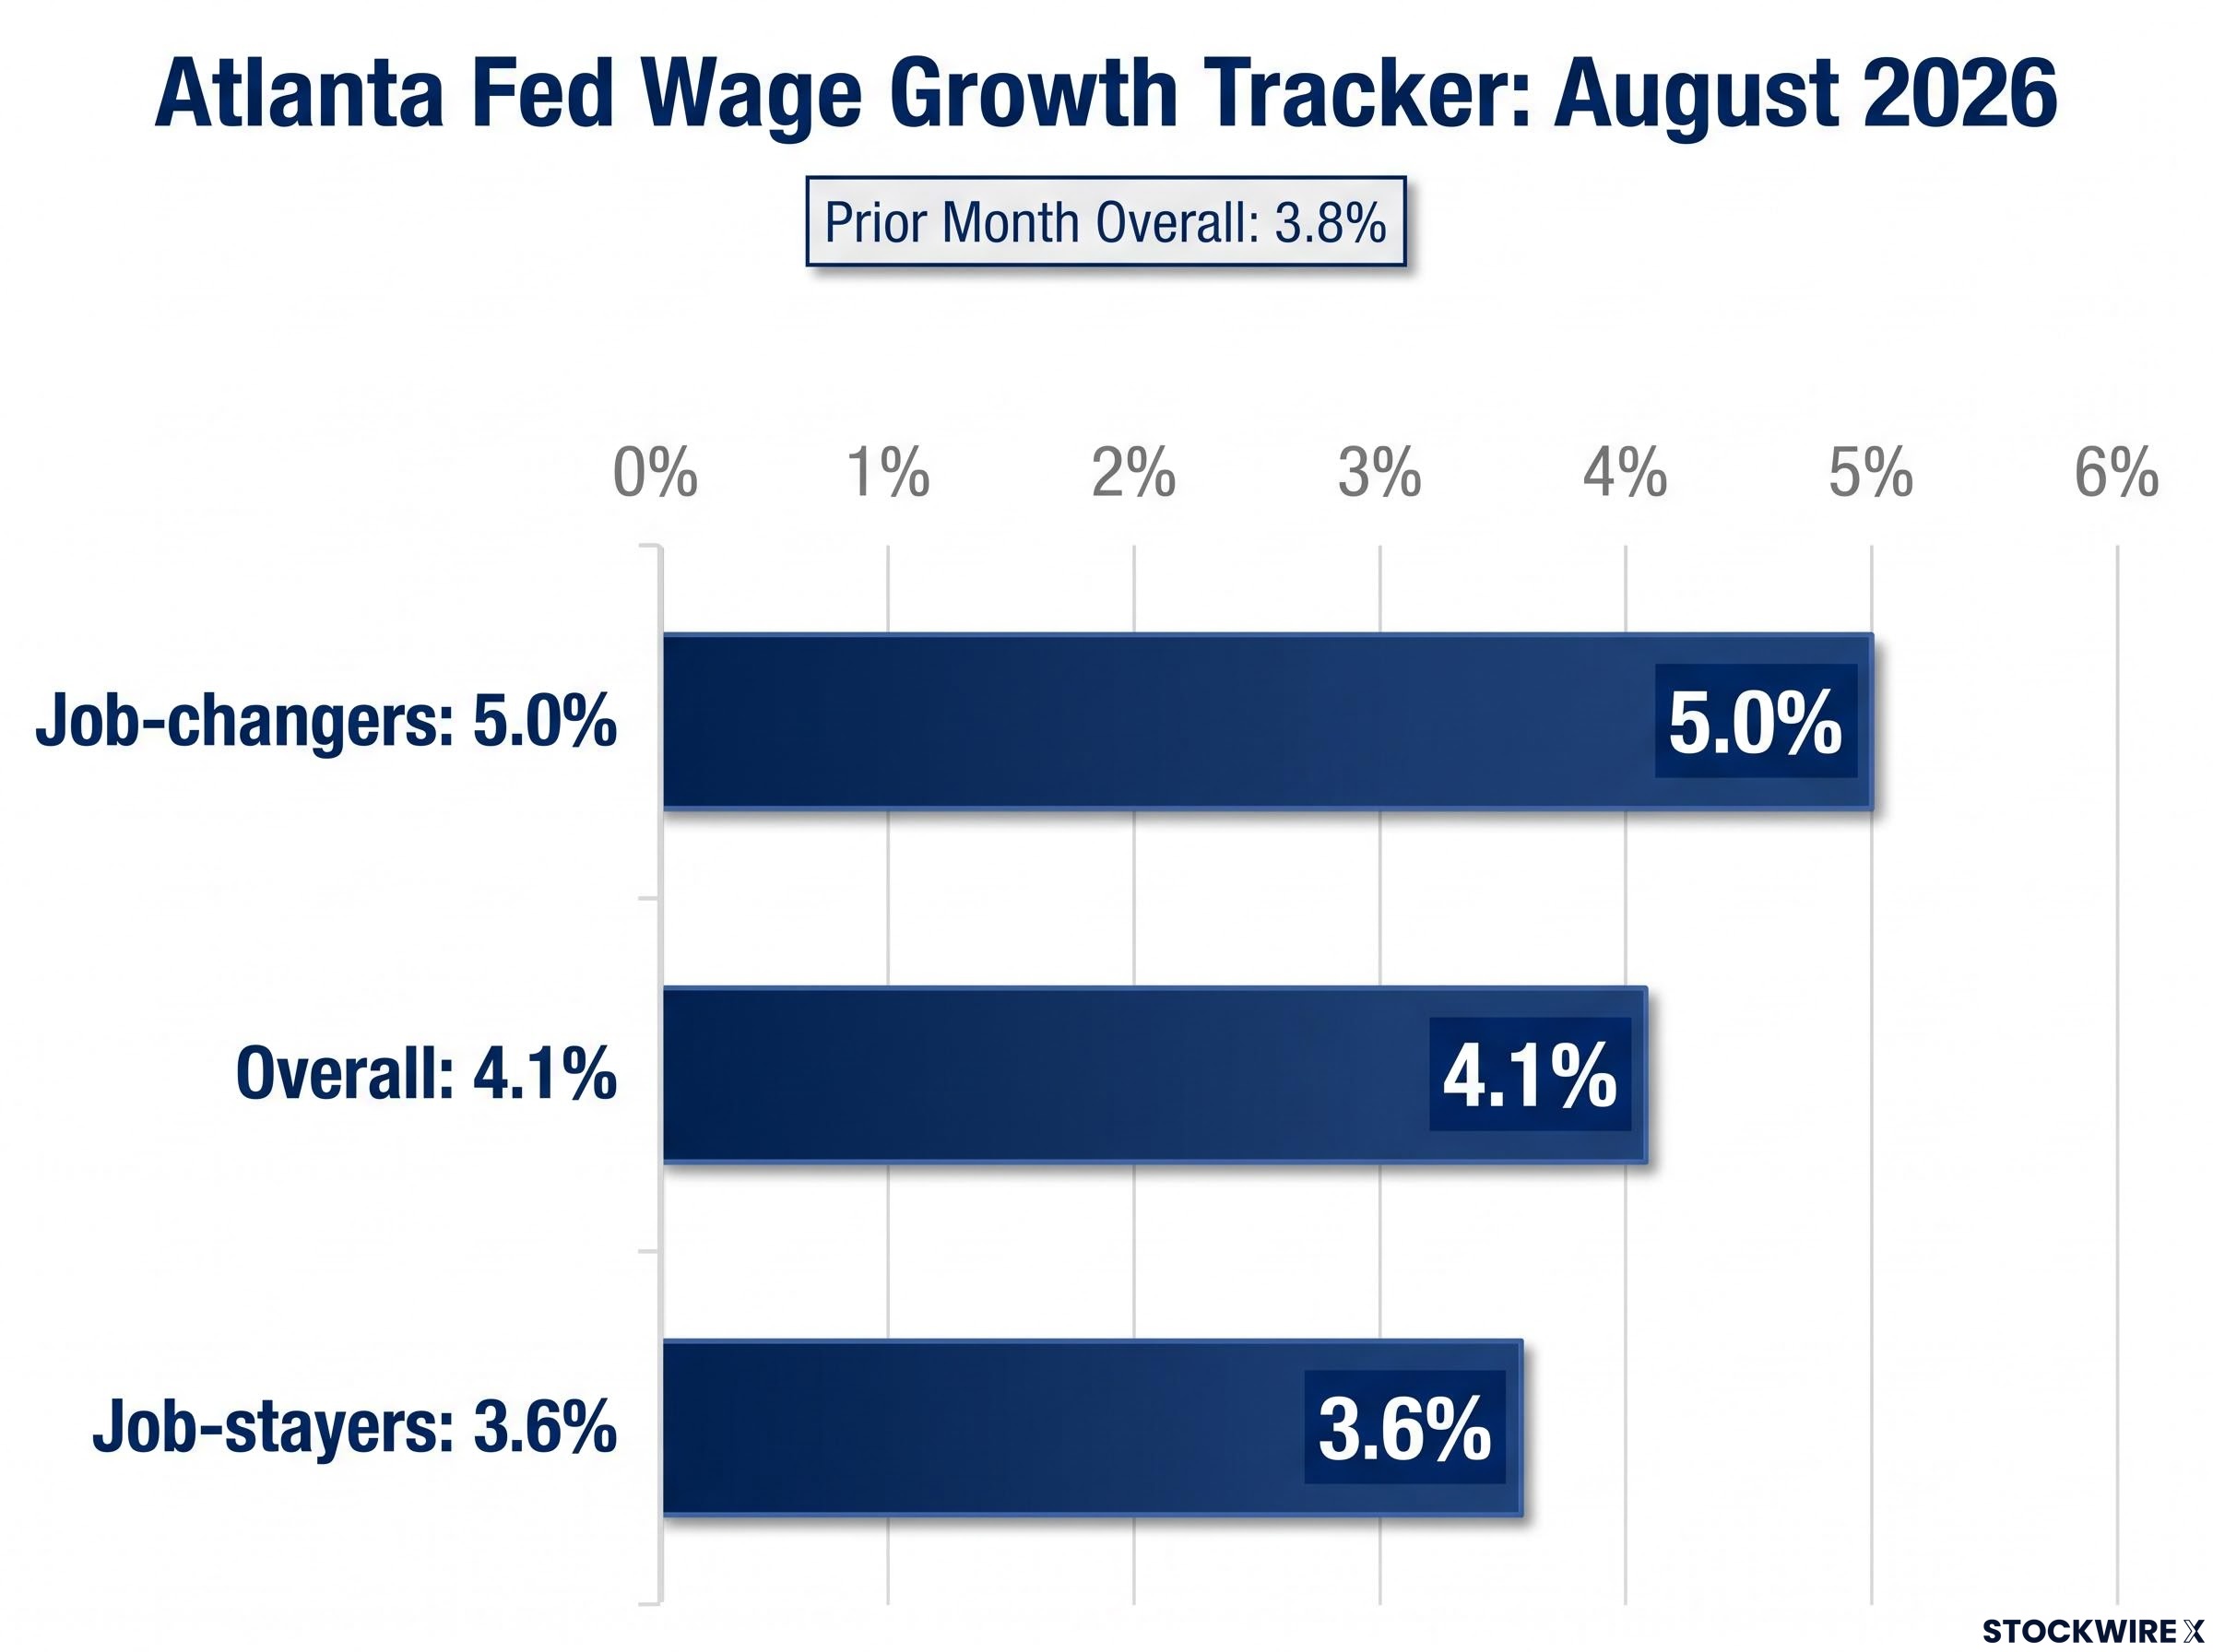
The wage data confirms the pressure is real and uneven. The Atlanta Fed Wage Growth Tracker edged up to 4.1% year-over-year in August 2026, from 3.8% the prior month, with a sharp split beneath the surface.
The Atlanta Fed Wage Growth Tracker methodology tracks median nominal wage growth for continuously employed workers, separating job-stayers from job-changers to capture the underlying composition of wage pressure that aggregate earnings measures can obscure.
| Measure | Reading (Aug 2026) | What it captures |
|---|---|---|
| Overall | 4.1% | Median nominal hourly wage growth across all workers |
| Job-stayers | 3.6% | Workers who remained in the same job |
| Job-changers | 5.0% | Workers who switched employers |
Immigration economists including Giovanni Peri and Adam Ozimek of the Economic Innovation Group have linked enforcement-driven supply cuts to upward wage pressure, particularly in low-wage and service-intensive sectors. The takeaway for you is uncomfortable but clear: the headline unemployment rate is now a less reliable guide to labour market slack than it was two years ago. Every jobs report and Fed statement you read from here carries that blind spot.
When big ASX news breaks, our subscribers know first
What the 1990s and 2018-2019 actually tell us about tight labour markets and inflation
Here is where the reassuring analogies come in. Investors who argue tight labour markets do not cause inflation usually reach for two episodes: 1999-2000 and 2018-2019. In both, unemployment fell below 4% without producing high inflation. Case closed, or so the argument goes.
The history is messier than that. The Phillips Curve, which describes the short-term inverse relationship between unemployment and inflation, has a record BCA Research analyst Jonathan LaBerge characterises as conflicting rather than consistent.
BCA Research on the Phillips Curve The relationship between unemployment and inflation is best described as conflicting rather than consistent across historical episodes.
Run the tape across four episodes and the ambiguity is obvious. The late 1960s saw low unemployment alongside high inflation, fitting the theory. Then 1999-2000 and 2018-2019 broke it, with sub-4% unemployment and tame prices. Then 2022-2024 fit again, though supply shocks did much of the work.
So the analogies are real. The problem is what made them work. BCA Research identifies three structural conditions that kept the two low-inflation episodes benign, and each is absent or materially weaker today.
| Condition | 1990s-2000 | 2018-2019 | Today (2026) |
|---|---|---|---|
| Productivity | IT and internet boom absorbed demand | Modest but stable | Uneven and weaker; AI gains not yet in the data |
| Inflation expectations | Firmly anchored post-Volcker | Close to 2% | More volatile after the post-pandemic spike |
| Globalisation | Deep offshoring, disinflationary | Efficient supply chains | Reshoring and fragmentation raising costs |
The IMF and BIS have made a related point in recent assessments: aging populations and weaker migration flows can create structural tightness that makes inflation more persistent at any given policy rate. What this tells you is that the comfort blanket of the 1990s and 2018-2019 comparisons has holes in it. The same 4% unemployment print carries a different inflation signal now, because the tailwinds that neutralised it before have faded.
The IMF and BIS assessments on aging populations and weaker migration sit within a broader argument that the current episode is not a cyclical overshoot but a structural inflation regime built on 13 simultaneous reversals of the disinflationary forces that ran for four decades, a thesis with direct implications for how long the Fed’s path to 2% actually is.
Why the AI productivity argument does not yet resolve the tension
The obvious counter is that AI will eventually replicate the 1990s productivity boom and flatten the curve all over again. It might. BCA Research acknowledges AI could lift productivity over time. But measurable gains have not yet shown up in official statistics, which means the deflationary offset is a forecast, not a present-day fact. Positioning around a productivity miracle that has not arrived is a bet on timing, and the current-period cost pressure is real regardless of how that bet resolves.
Why a wage-price spiral is still unlikely, even if wages stay elevated
If wages are sticky and the historical analogies are weaker than advertised, the natural fear is a 1970s-style wage-price spiral, where rising wages and rising prices chase each other upward. BCA Research assesses that scenario as unlikely, and the reasoning is structural rather than hopeful.
The balance of power between workers and employers has shifted decisively toward employers. Private-sector union membership has declined sharply, reducing the collective bargaining leverage that made the 1970s dynamic possible. Just as important, the exceptional conditions that drove the post-pandemic wage surge are no longer present.
- Record quit rates, which signalled widespread poaching of workers between firms, have normalised.
- Government fiscal transfers that slowed workers’ re-entry into the labour force have expired.
- Bidding wars for scarce talent have cooled as employer demand has receded.
BCA Research concludes the post-pandemic surge was a temporary supply shortfall, not an enduring structural force, and that the preconditions for a self-reinforcing loop are simply absent.
BCA Research conclusion Fears of a significant wage-growth breakout are exaggerated, and a self-reinforcing wage-price spiral is not considered a realistic outcome.
There is a competing macroeconomic view worth holding alongside this. Some economists argue that fewer workers also means fewer incomes and less spending, so reduced labour supply can depress aggregate demand as much as it lifts wages. In that reading, the net result is lower potential growth rather than a price-wage loop.
Here is where you should land. Ruling out a spiral is not the same as ruling out persistently above-target inflation. Wages that stay stuck at 4% do not signal the 1970s, but they do narrow the Fed’s path to 2% inflation without a demand shock. The risk is not runaway prices. It is a prolonged plateau, and that distinction matters for how you position across duration.
Rate-sensitive positioning across duration, credit spreads, and equity multiples faces the same repricing dynamic that played out after the September 2026 FOMC hike, when markets pricing 55% odds of a further October move demonstrated how quickly a hold-then-hike sequence can compress valuations that assumed aggressive easing.
What a hawkish Fed surprise would mean for markets over the next 12 months
This is where the analysis meets your portfolio. Even without a spiral, BCA Research acknowledges a realistic scenario: inflation persisting above target because of labour supply contraction, prompting the Fed to deliver a hawkish surprise within 12 months of September 2026, meaning by September 2027.
Broader expert commentary frames this as moderate further hawkishness rather than an extreme shock, a residual possibility rather than a base case. But residual is not the same as negligible. Consensus is currently priced for cuts, and a Fed that holds higher-for-longer or hikes against that expectation would reprice rate-sensitive assets across duration, credit spreads, and equity multiples. The force would land hardest where valuations already assume aggressive easing.
The July 2026 FOMC meeting produced a 9-3 hawkish dissent, the first three-way split for a rate hike since September 2016, which sent the 30-year Treasury yield to 5.21% and pushed swap markets to price roughly 60% odds of a September hike, quantifying exactly how close consensus already was to a hawkish surprise.
If you are positioned for rate cuts in 2027 and the labour supply dynamic described here persists, BCA Research’s analysis suggests you may be underpricing the scenario where the Fed’s next move is not the one the market expects.
Three signals to watch before the next Fed decision
You do not need to guess. Three indicators tell you whether the hawkish surprise probability is rising or fading.
- Wage Growth Tracker trajectory. If job-changers hold at or above 5.0% and the overall tracker stays above 4%, the wage floor is not softening. A sustained move down would ease the pressure.
- Labour force participation rate. Currently 61.6%. Any further decline tightens the arithmetic regardless of hiring trends, because a smaller pool keeps unemployment low without a hiring boom.
- Supercore inflation. Services excluding housing isolates demand-driven, labour-intensive cost pressure. If it stays elevated, the demand side is confirming the supply-side signal, and the case for persistence strengthens.
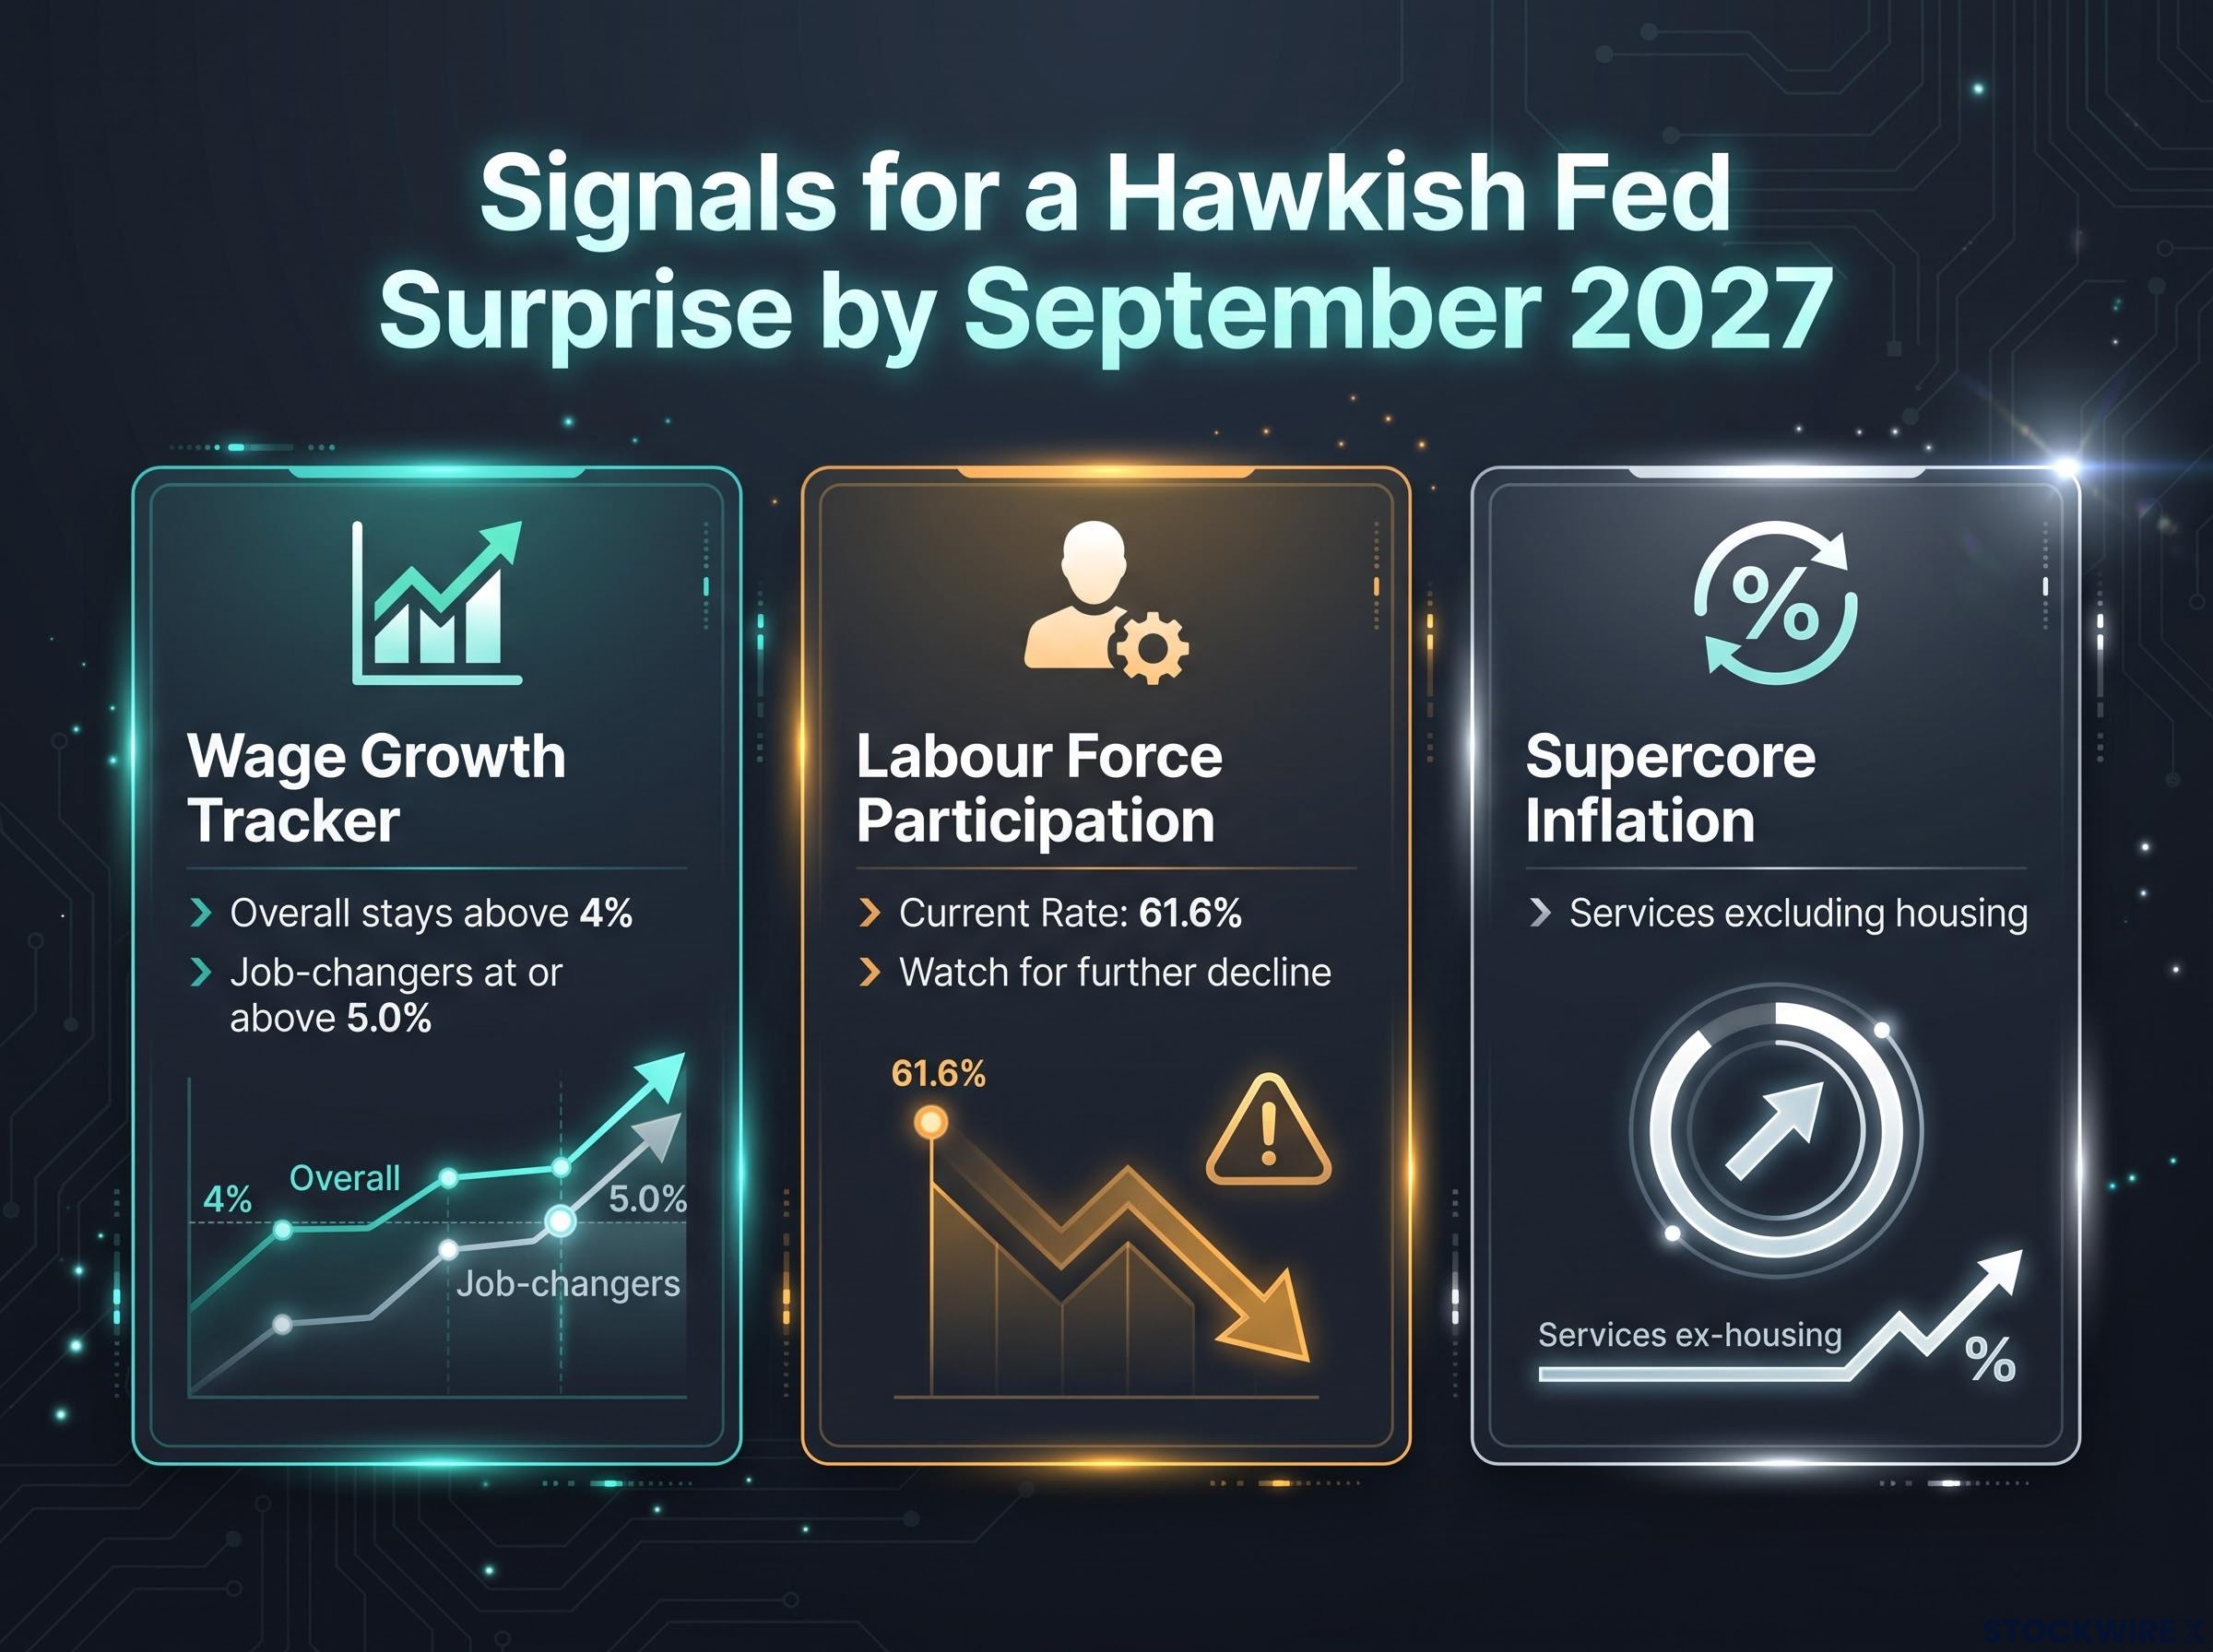
The IMF and BIS have argued that structural labour market tightness makes inflation more persistent at any given policy rate. These three signals are how you watch that thesis play out in real time.
Positioning for a labour market that is tighter than it looks
Pull the threads together and the picture is coherent. The labour force is shrinking. Wages are sticky, with the Atlanta Fed tracker at 4.1% in August 2026, up from 3.8% the prior month. The historical analogies investors lean on carried structural tailwinds, productivity, anchored expectations, and deep globalisation, that no longer apply. A wage-price spiral looks unlikely, but the Fed’s next surprise is more likely to be hawkish than dovish.
That is the asymmetry. Consensus is priced for easing, while the structural evidence points toward a labour market that can generate persistent inflation without economic overheating.
The core risk The case is not that inflation is about to spike. It is that the floor on inflation is higher than consensus pricing reflects, and that is where the investment risk sits.
The variables that resolve this are not GDP prints or headline CPI. They are the wage tracker, participation, and supercore inflation. If you track those three, you are positioned to adjust duration and rate exposure before the consensus catches up.
This article is for informational purposes only and should not be considered financial advice. Investors should conduct their own research and consult with financial professionals before making investment decisions. Past performance does not guarantee future results. Financial projections are subject to market conditions and various risk factors, and forward-looking scenarios are speculative and subject to change based on economic developments.