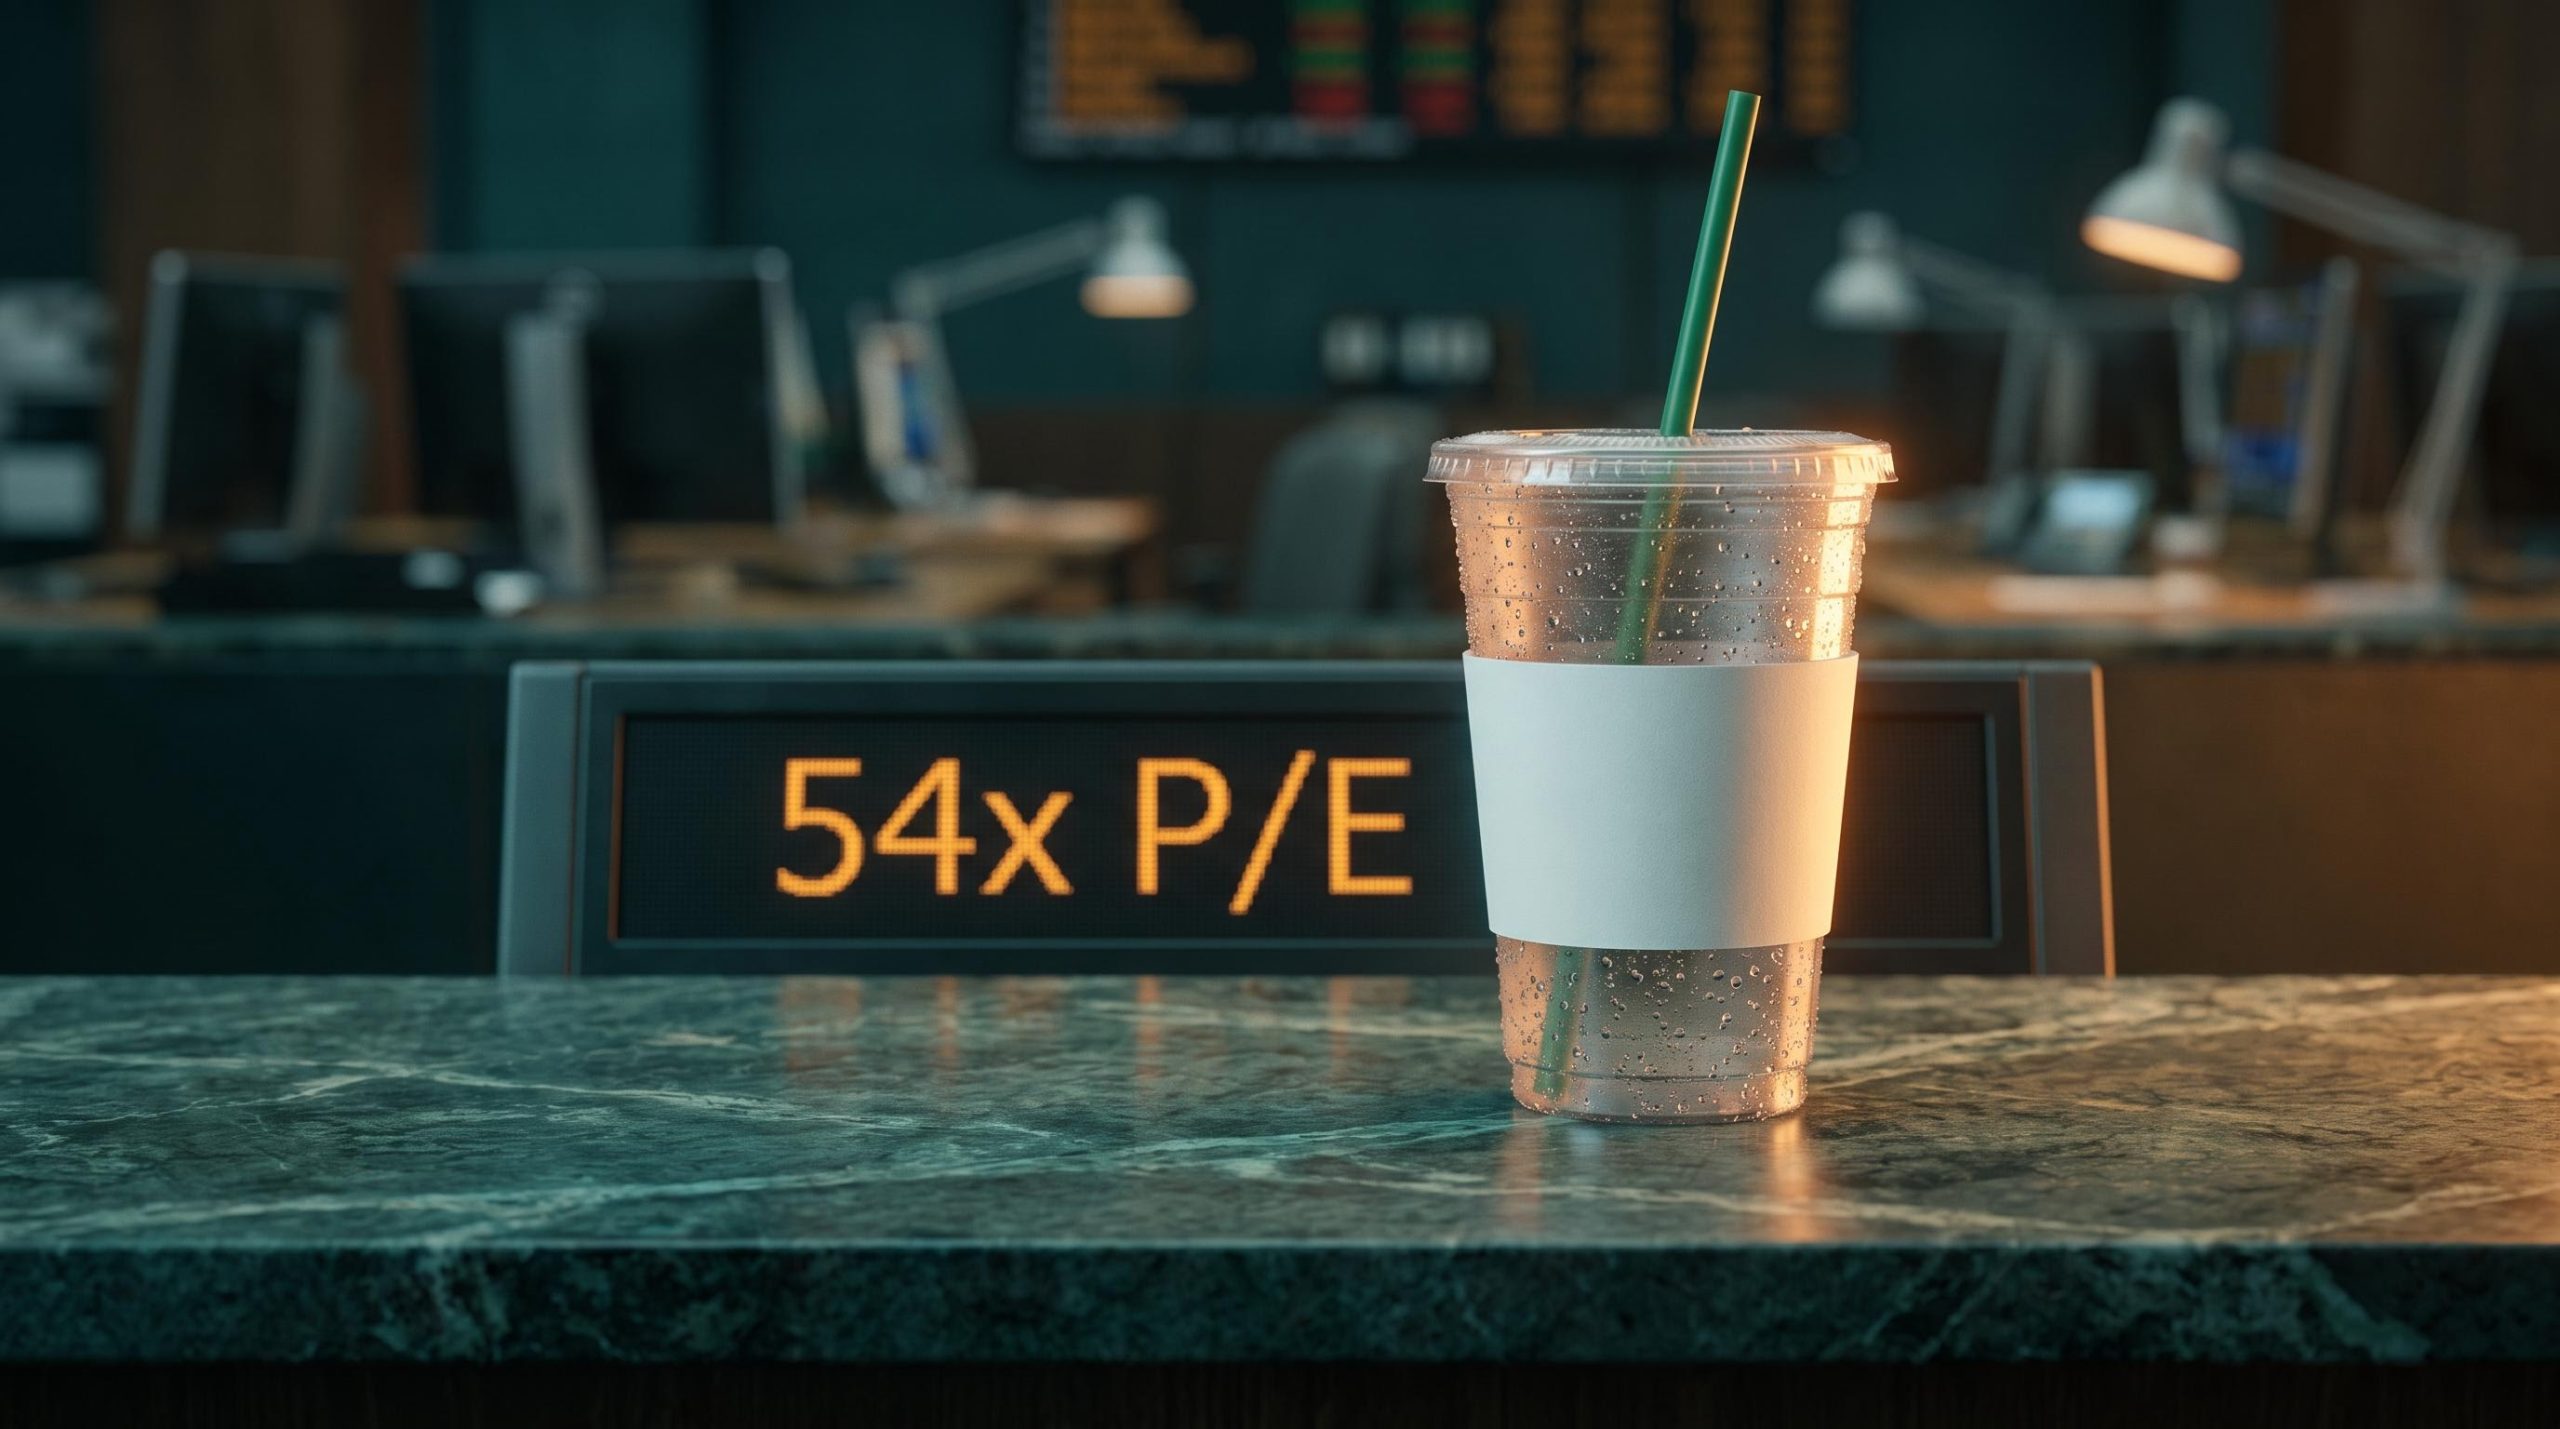
Starbucks is one of the most recognised brands on the planet, and its stock has still lost roughly 20% over five years. At the same time, it trades at a price-to-earnings ratio of about 54 times trailing earnings, meaning investors are paying more than fifty dollars for every dollar of profit the company currently produces.
If you assume brand strength automatically converts into shareholder returns, that pairing should stop you cold.
There is a genuine reason to look again now. A new chief executive with a credible operational record is delivering consecutive quarters of improving comparable sales and expanding margins. But the balance sheet still carries around $11.8 billion in long-term debt, the residue of a leveraged buyback strategy that did little for the people who own the shares.
The question is whether the recovery underway is durable enough to justify what you pay today.
Work through the numbers below and you will have a clear-eyed view of what the data actually supports, the return you can realistically expect at the current price, and precisely what would have to be true for that return to improve. This is a framework, not a verdict.
How Starbucks built its track record, then spent it
For most of its history, Starbucks was a genuine compounding machine. Over the roughly 15 to 20 year period analysts typically study, the business grew both its top and bottom line at a pace that rewarded patient owners handsomely.
The scale of that growth is worth holding in mind before anything else, because it explains why the brand still commands respect:
- Revenues grew approximately six-fold over the long-term period
- Earnings grew approximately eight-fold over the same window
- Annual net income reached roughly $4 billion in normalised years
That is the record. What happened next is where shareholder value quietly leaked away.
The Starbucks business model sits closer to a traditional retailer than a franchise operator, with roughly 82% of fiscal 2024 revenues flowing from company-owned stores, which means every wage increase and occupancy cost lands directly on the parent income statement rather than being absorbed by a franchisee.
The leveraged buyback era and what it cost shareholders
Before around 2018, Starbucks carried no significant long-term debt. Then management made a deliberate choice: borrow heavily to fund enormous share repurchases, buying back stock rather than sitting on a clean balance sheet.
The company spent approximately $25 billion on buyback programmes, much of it funded by taking on debt. The trouble is timing. The bulk of those repurchases were executed when the share price was elevated, and the stock has since fallen roughly 20%.
Approximately $25 billion was spent buying back stock, largely with borrowed money, while the share price subsequently declined around 20%. Shareholders were left holding both the debt and the impairment.
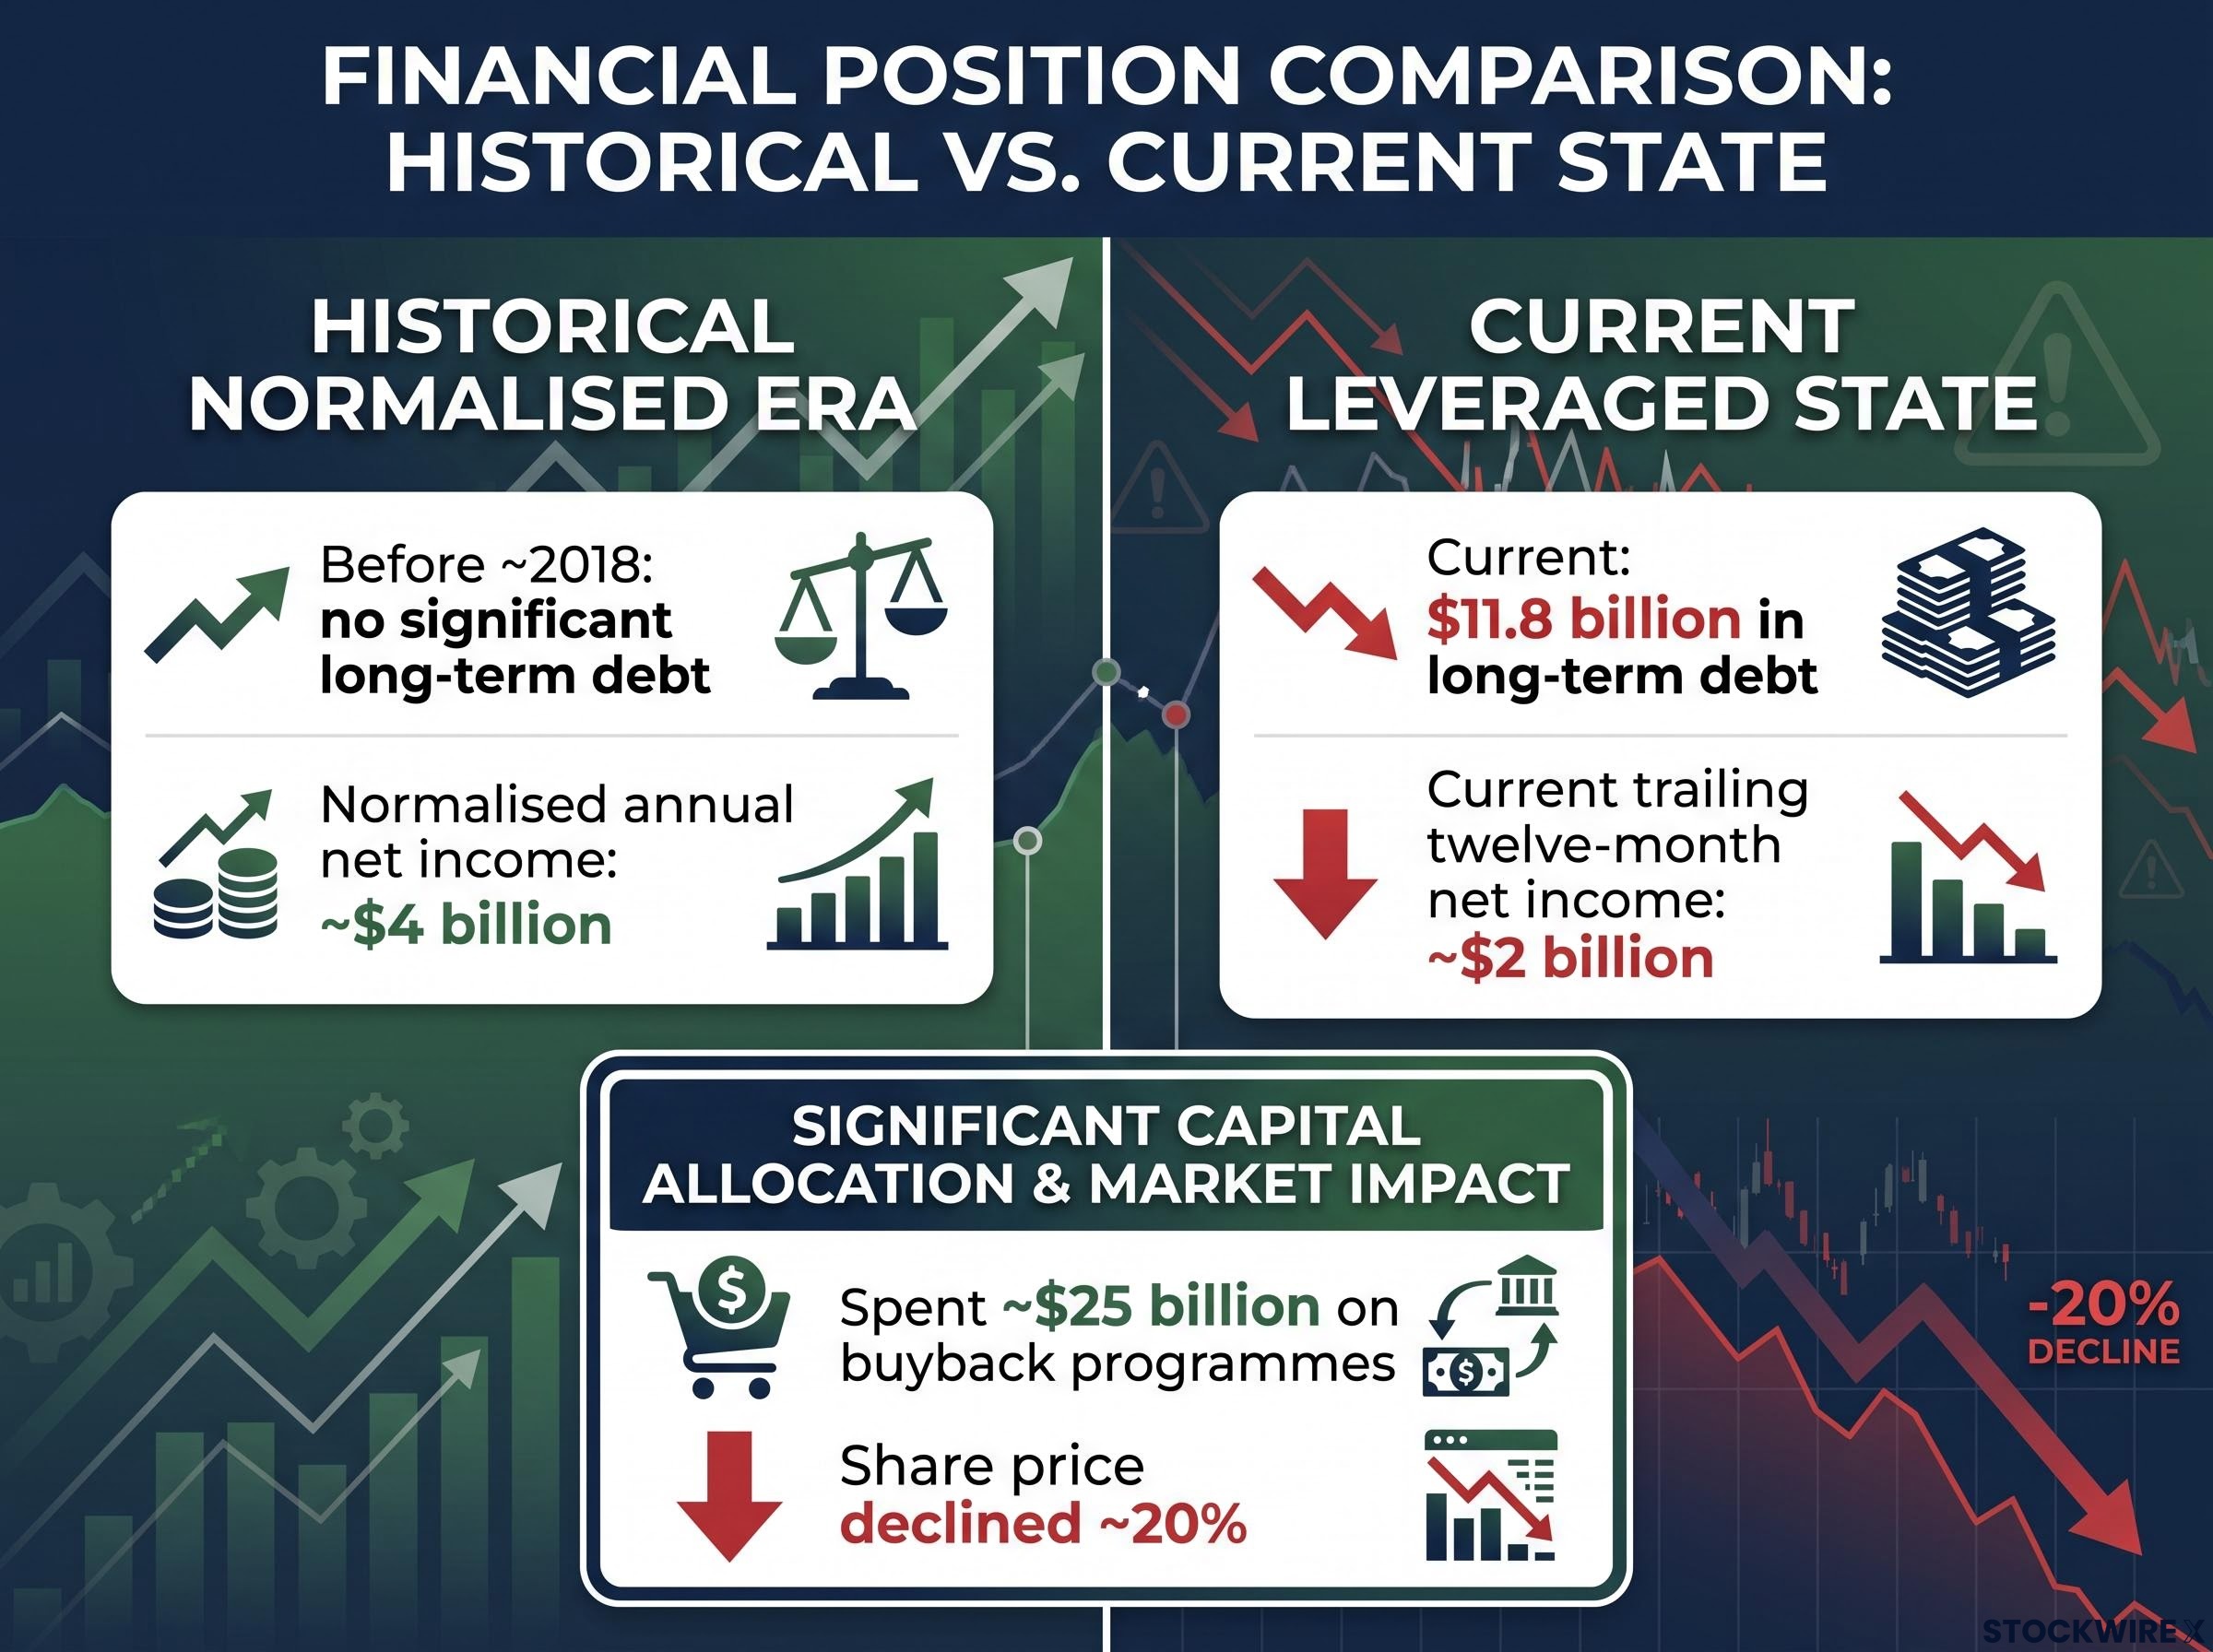
This is the part that changes how you should read the balance sheet today. That $11.8 billion in long-term debt is not the cost of building factories, acquiring growth, or expanding into new markets. It is what remains after buying shares at prices the market no longer supports.
Trailing twelve-month net income has since compressed to about $2 billion, roughly half the normalised level. So the current situation is best understood as self-inflicted rather than a macro or industry story: leverage funding financial engineering, not growth.
That framing matters for one practical reason. Debt taken on to build a business signals ambition; debt taken on to shrink the share count at high prices signals reduced flexibility. The real question for today’s investor is whether new leadership can generate returns strong enough to justify servicing that borrowing.
When big ASX news breaks, our subscribers know first
What Brian Niccol’s numbers actually show
Here is where the story turns, and the evidence is specific. Under chief executive Brian Niccol, who previously revitalised Chipotle between 2018 and 2024, Starbucks has strung together consecutive quarters of measurable improvement.
The most recent results, for Q3 FY2026 (quarter ended 28 June 2026), are the clearest proof yet. Global comparable store sales rose 7.9%, with transactions up 4.2% and average ticket up 3.5%. North America was stronger still at 8.1%.
The Q2 FY2026 earnings results that preceded the current quarter were the first clear signal of a genuine turn, with $9.5 billion in revenue, a 7.1% US comparable sales rise driven more by transaction volume than price, and a share price reaction of nearly 6% on the day that reset analyst conviction across the coverage universe.
Margins tell an equally striking story. Non-GAAP operating margin reached 14.4%, an expansion of roughly 430 basis points year over year. To appreciate the scale of that recovery, FactSet estimates cited an adjusted operating margin of around 8.3% during the earlier phase of weakness. This is a business climbing back from a genuine trough.
And the bottom line beat expectations decisively. Non-GAAP earnings per share came in at $0.85 against consensus of roughly $0.66, a beat of nearly 29%.
The table below shows the trajectory across the two most recent quarters.
| Metric | Q2 FY2026 | Q3 FY2026 | Year-over-Year Change |
|---|---|---|---|
| Global comp store sales | +6.2% | +7.9% | Accelerating |
| North America comp store sales | +7.1% | +8.1% | Accelerating |
| Non-GAAP operating margin | Improving | 14.4% | +430 bps |
| Non-GAAP EPS vs. consensus | $0.50 vs $0.44 | $0.85 vs $0.66 | Beat widened |
Management has been direct about the significance.
“Our second quarter marked the turn in our turnaround as our Back to Starbucks plan drove both top and bottom line growth,” said Brian Niccol, Chief Executive Officer.
Full-year guidance backs the claim. FY2026 non-GAAP EPS guidance has been raised twice, now sitting at $2.55-$2.65, and the company’s own Investor Day targets point to EPS of $3.45-$4.00 by 2028.
What this tells you is real, not cosmetic. Two consecutive quarters of accelerating comps and a near-29% EPS beat are the signature of operational changes that are actually working.
The China transition and what it changes for investors
There is a complication the headline comp figures obscure. Starbucks sold a 60% stake in its China retail business to a Boyu Capital joint venture, retaining a 40% equity interest. China performance now flows through equity earnings rather than consolidated revenue.
The near-term effect is visible in the top line. Q3 FY2026 consolidated net revenues fell approximately 1% year over year, a direct result of this restructuring, even as underlying operating trends improved. Proceeds also funded the repurchase of around $1.3 billion in senior notes.
Here is the point to register. Detailed economics of the joint venture and its long-term contribution are not yet publicly transparent. So while the operating momentum is genuine, the revenue picture is cloudier than the comp numbers alone suggest, and that opacity is itself an analytical uncertainty you carry into any decision.
The valuation math and what it tells long-term investors
Improving operations are one thing. What you pay for them is another. Start with the inputs at current prices: a P/E of approximately 54 times trailing earnings, a dividend yield of about 2.61%, and a market capitalisation near $108 billion.
Now follow the return arithmetic. The base-case framework assumes 5% dividend growth, a 10% discount rate, and a terminal earnings multiple of 25 times. Run those numbers and the implied prospective total return works out to roughly 6% annually at today’s price.
Loosen the assumptions and the picture brightens modestly. Assume a 3% current yield with 7% dividend growth that the market accepts, and the implied return rises to around 8%. Push the other direction and it gets uncomfortable: reaching a 5% dividend yield on 4% growth would require roughly a 50% decline in the share price.
| Scenario | Key Assumptions | Implied Annual Return |
|---|---|---|
| Base Case | 5% dividend growth, 10% discount rate, 25x terminal multiple | ~6% |
| Optimistic Case | 3% current yield, 7% dividend growth, market acceptance | ~8% |
| Bear Case | 5% yield on 4% growth requires re-pricing | ~50% price decline required |
The analyst community offers a useful cross-check, and it leans cautious:
- Consensus price target range of approximately $106-$115, implying only modest upside
- Only 12 analysts carry a Strong Buy rating
- Institutional ownership of roughly 86.4%-87%
- Wolfe Research upgraded to Outperform with a $112 price target following Q1 FY26 results
There is a path to a better outcome. If Starbucks hits its Investor Day EPS target of $3.45-$4.00 by 2028, the multiple could normalise from 54 times toward the mid-20s that analysts apply to forward estimates.
At a P/E of approximately 54 times, the stock is priced for the recovery to succeed, not for the recovery to prove temporary.
What this tells you is straightforward. A prospective annual return of around 6% is not obviously adequate compensation for a leveraged balance sheet, a turnaround still in its early innings, and the requirement that comp and margin gains persist for years to justify the multiple you are paying today.
What would have to be true for the thesis to work
Shift from what the data shows to what you have to believe. If you buy at these prices, you are implicitly betting that a specific set of conditions holds. Here they are, framed as requirements rather than predictions:
- High-single-digit comparable store sales sustained into FY2027, not just for a couple of quarters
- Non-GAAP operating margin continuing to expand beyond 14.4% rather than plateauing
- The China joint venture delivering results comparable to the prior company-owned contribution
- Analyst consensus migrating from Hold toward Buy as conviction builds
- A consumer environment that keeps supporting premium coffee demand
- Debt reduction progress that restores capital allocation flexibility against the $11.8 billion load
The company is doing its part on the numbers within its control. FY2026 EPS guidance sits at $2.55-$2.65, the 2028 target is $3.45-$4.00, and analysts model roughly 20% forward EPS growth against a target multiple near 25 times.
The variables outside Niccol’s control
Not everything on that list is management’s to deliver. Sustained high-single-digit comps depend on customers absorbing premium pricing without trading down, and that is a function of the broader consumer environment rather than store execution.
Competitive pressure from value-oriented quick-service rivals is a structural threat the research flags but does not quantify. That absence of hard numbers is worth registering; it is a known risk without a measurable size attached.
US consumer spending resilience through mid-2026, with five consecutive months of retail sales growth and Bank of America card transactions at their strongest year-over-year rate in more than four years, provides the macro backdrop that makes sustained high-single-digit comparable sales at a premium-priced chain plausible rather than exceptional.
Then there is the ownership structure. With roughly 87% of shares held by institutions, the shareholder base is sophisticated and impatient. A stalling recovery, any comp deceleration or margin plateau, would likely trigger a swift and unforgiving correction.
The honest read is that accepting this thesis means betting on two things at once: Niccol’s execution, and a market willing to sustain a mid-20s multiple once earnings recover into the $3.45-$4.00 range. Both must hold.
What the recovery is worth at current prices, and what it is not
The tension at the heart of this analysis is not complicated. The turnaround is real, the evidence keeps improving, and the valuation already prices in a successful multi-year recovery. You are not buying a distressed asset at a discount; you are paying a premium for an outcome that still has to be delivered.
Run the normalisation scenario to see why the margin of safety is thin. If Starbucks earns $3.45-$4.00 by 2028 and the market applies a 25 times multiple, the implied price lands around $86-$100. That sits below current trading levels depending on the inputs, which means much of the reward for a successful turnaround is already in the price.
The question is not whether Niccol is succeeding. It is whether the price already reflects his success.
Here is where the scenarios leave you:
- Base case: approximately 6% annual return
- Optimistic case: approximately 8% annual return
- Bear case: roughly a 50% price decline to reach a 5% dividend yield
That leaves a specific decision on the table. Accepting around 6% annual returns from a leveraged, heavily institutionally owned, turnaround-phase business is a high-risk-for-moderate-return proposition. The $11.8 billion debt load remains a carry cost and a constraint on flexibility, and the analyst consensus target range of $106-$115 signals modest upside at best.
Whether that is enough depends entirely on your required return and how much conviction you hold in the recovery persisting for years. The analysis gives you the framework. The judgement is yours.
This article is for informational purposes only and should not be considered financial advice. Investors should conduct their own research and consult with financial professionals before making investment decisions. Past performance does not guarantee future results. Financial projections are subject to market conditions and various risk factors, and the return scenarios discussed here are speculative and subject to change based on market developments and company performance.