#
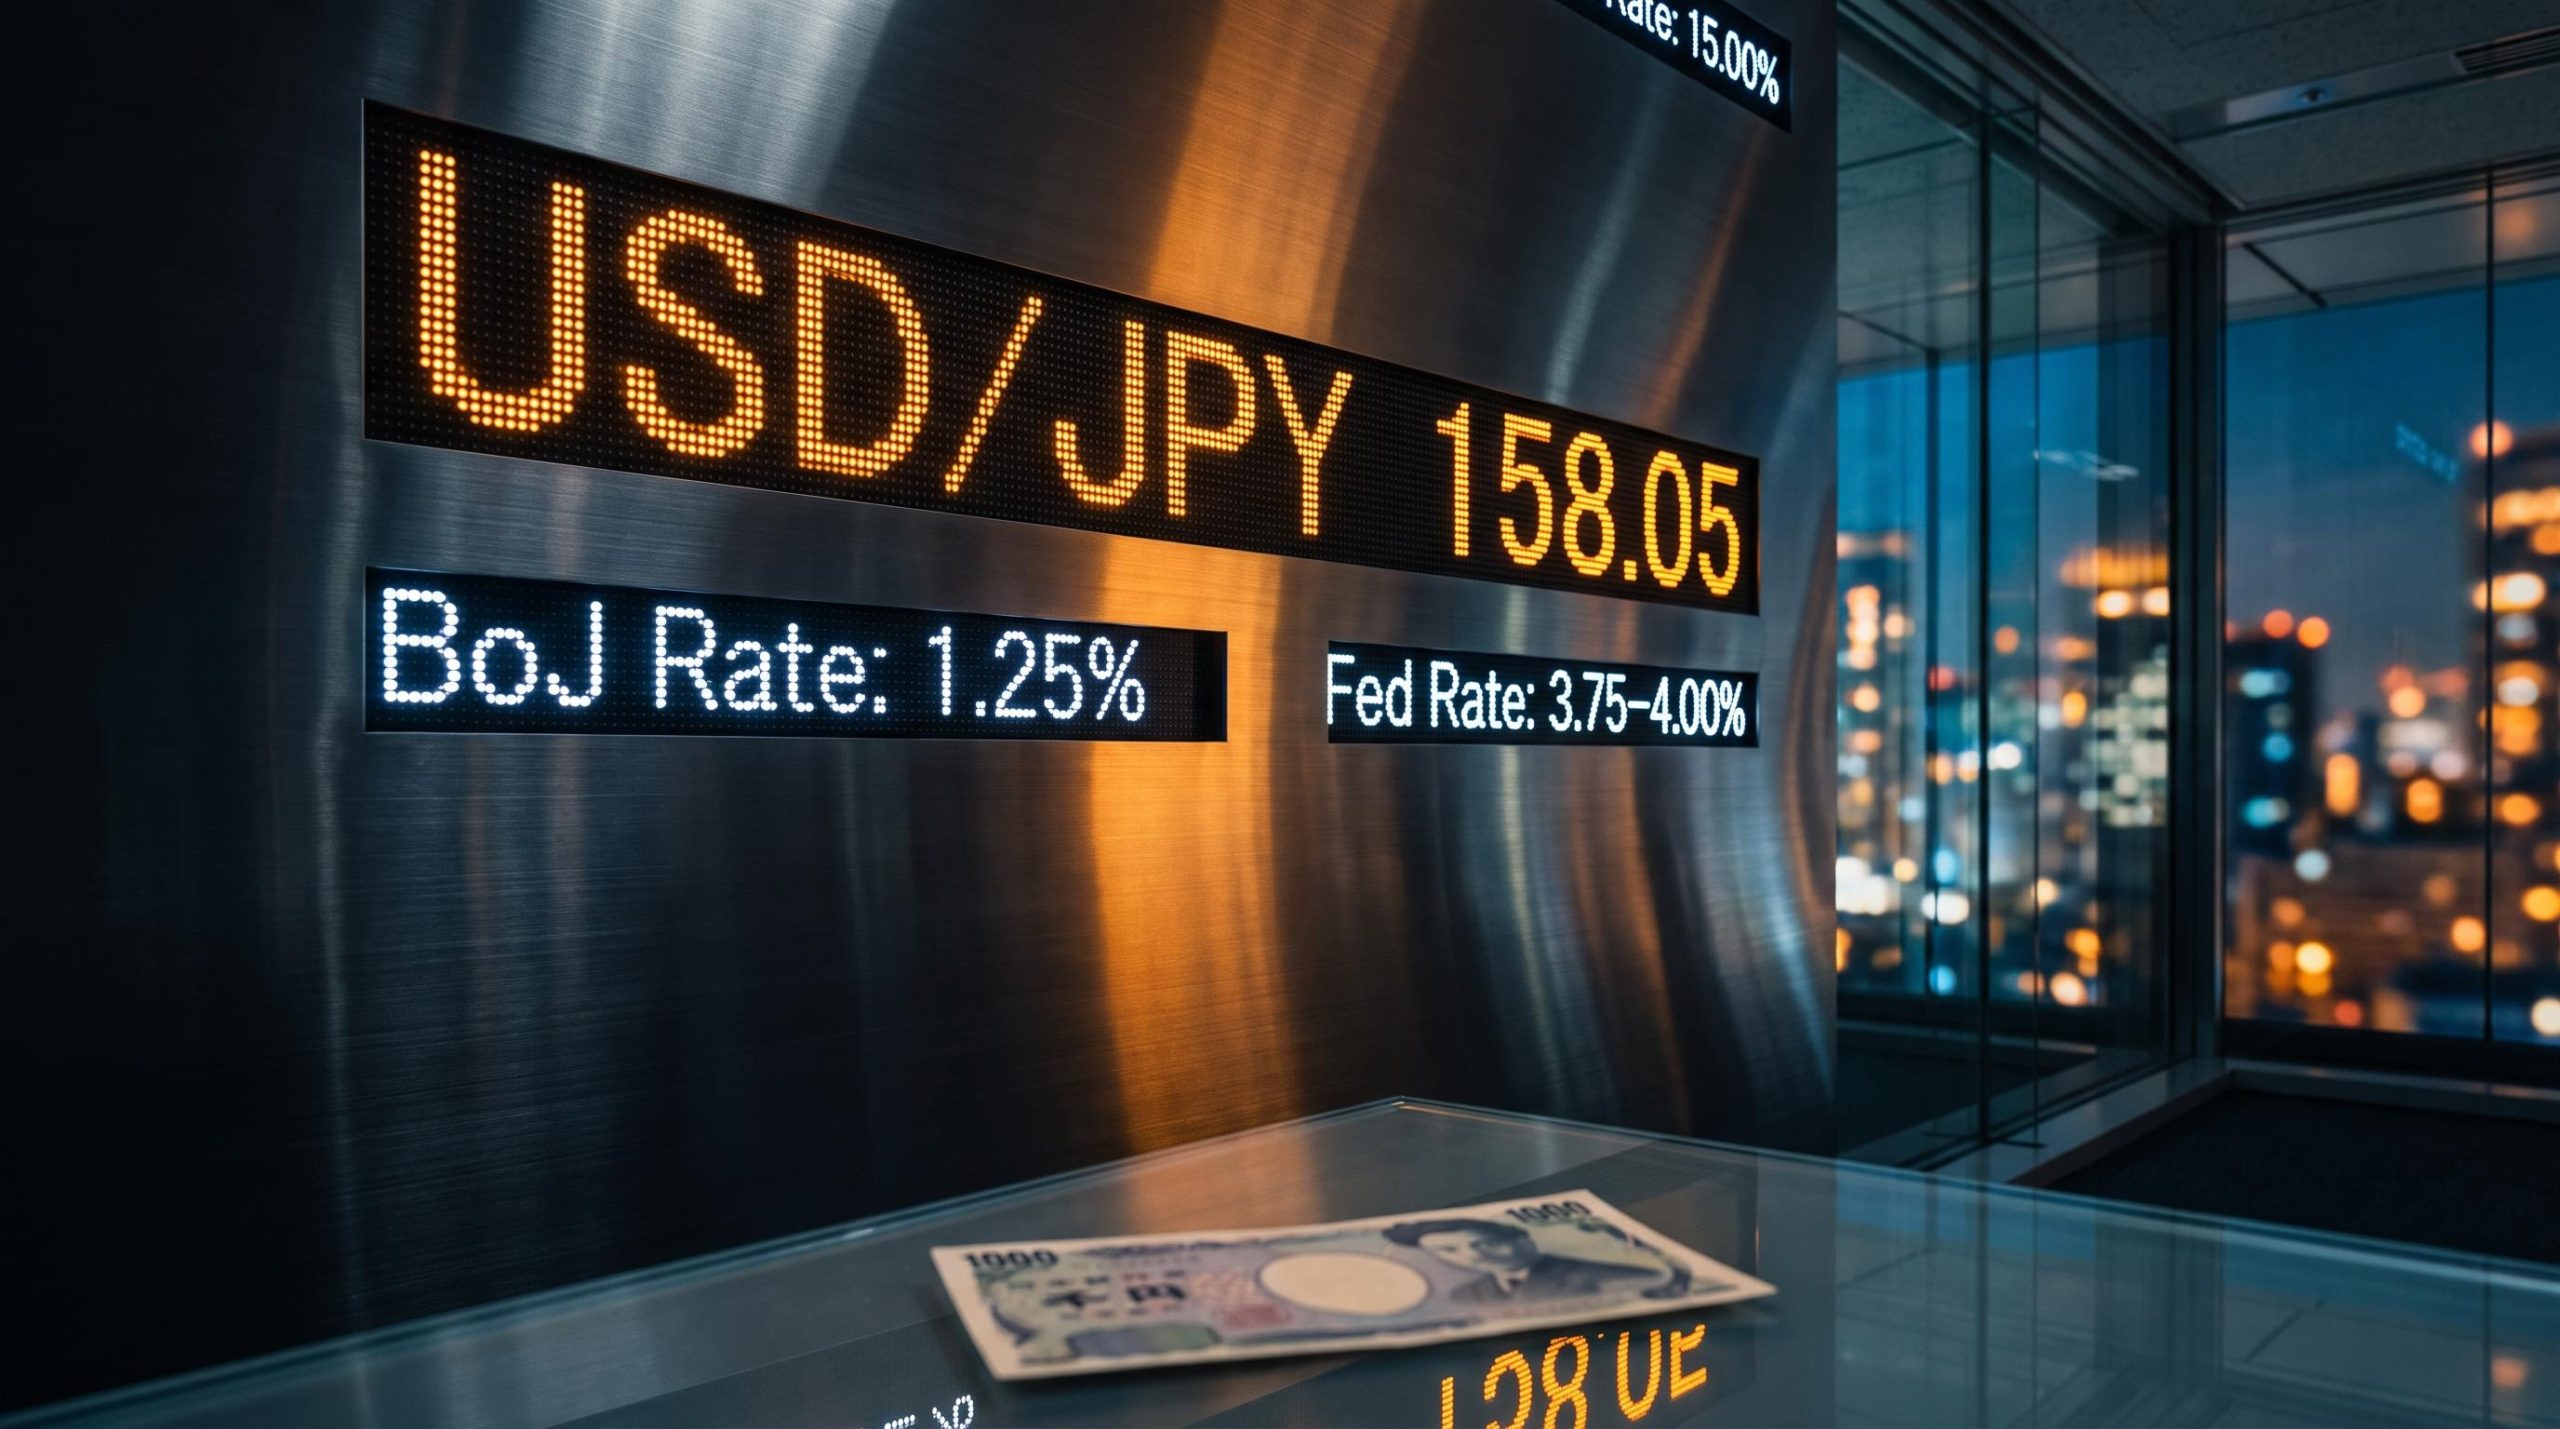
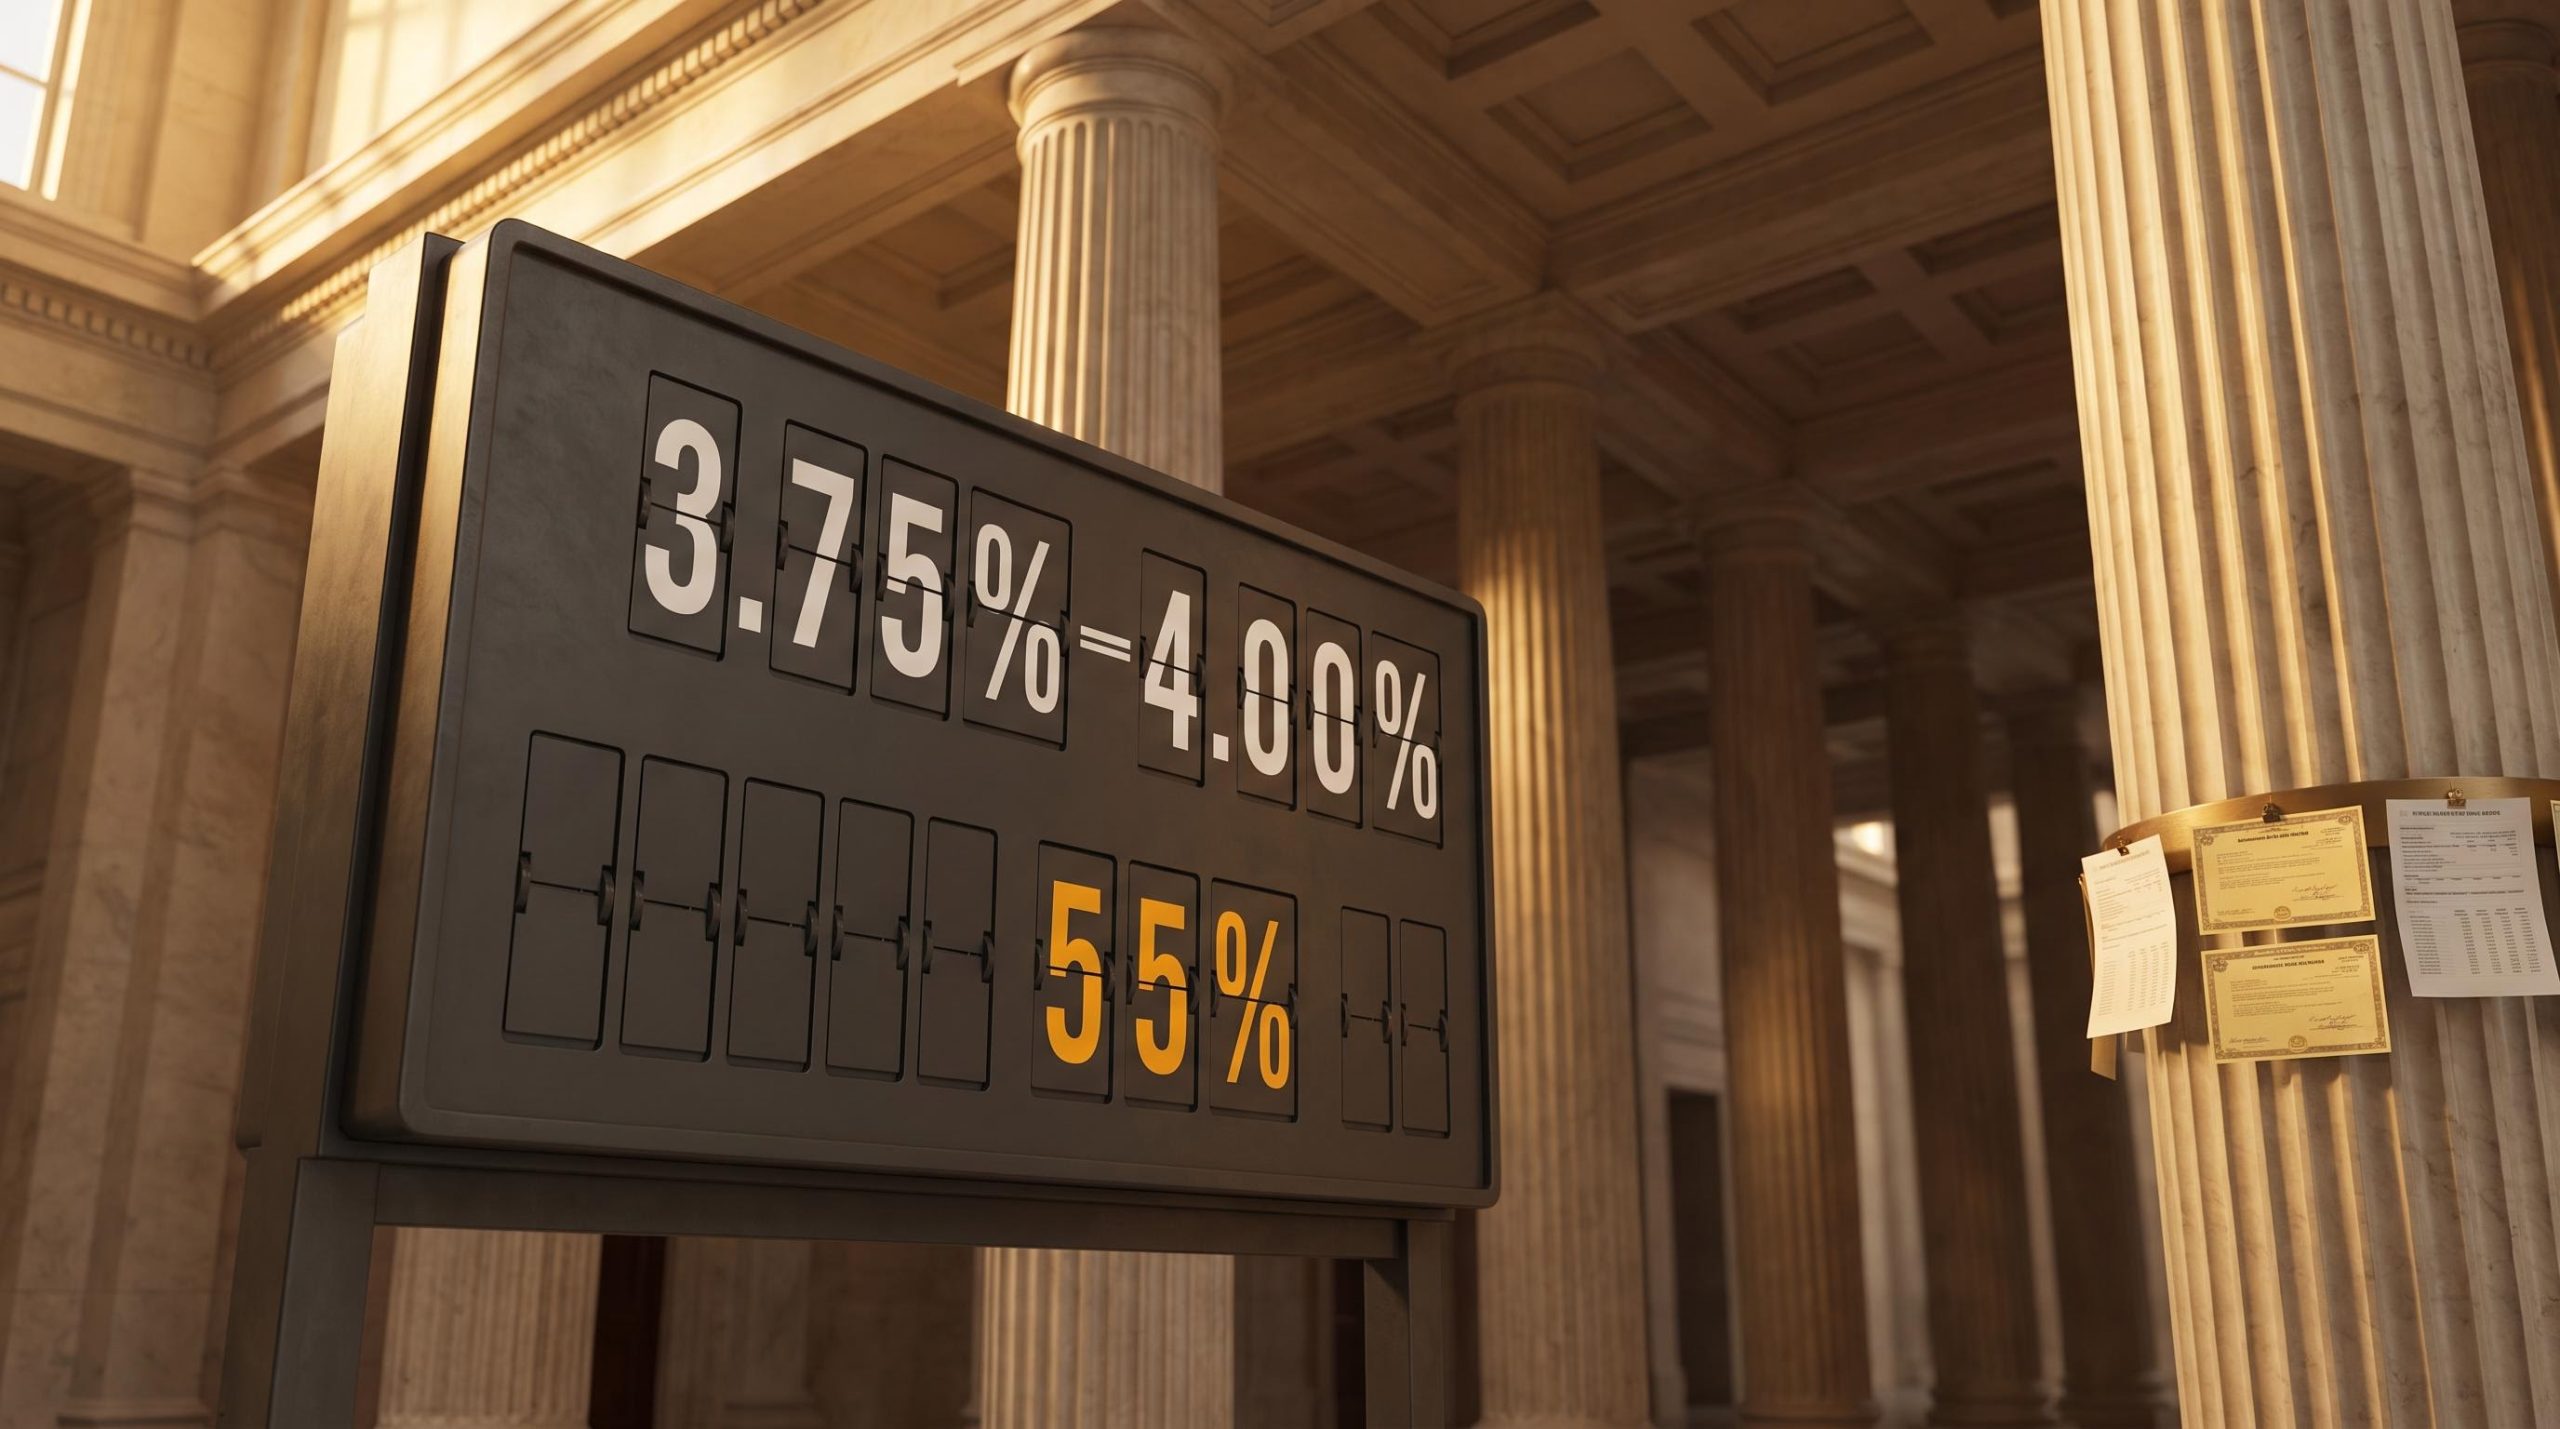
The Federal Reserve just raised its benchmark rate to 3.75%-4.00% in September 2026, and markets are already pricing a 55% chance of another increase in October. For anyone who assumed the tightening era was quietly winding down, that number is a direct challenge to the assumption.
The signal came from Governor Michael Barr in his September 2026 remarks, and it was not simply a data update. Barr framed the latest move as a recalibration rather than a pause — a position he first outlined on 1 September 2026, when he used the phrase “act decisively” and pointed to inflation that has stayed above the Fed’s 2% target for more than five years. On 23 September 2026, he confirmed the hike and described it as an “important step” in that recalibration. With CPI at 3.4% year-over-year and PCE hovering near 3%, the backdrop explains why this moment feels different from the quieter stretches of 2025.
Here is a clear map of where Fed policy is heading, why it is heading there, and what it means for the decisions sitting in your portfolio right now. The specifics matter, because the market has already started repricing, and waiting for confirmation tends to leave investors a step behind.
What the Fed just did, and what it is signaling next
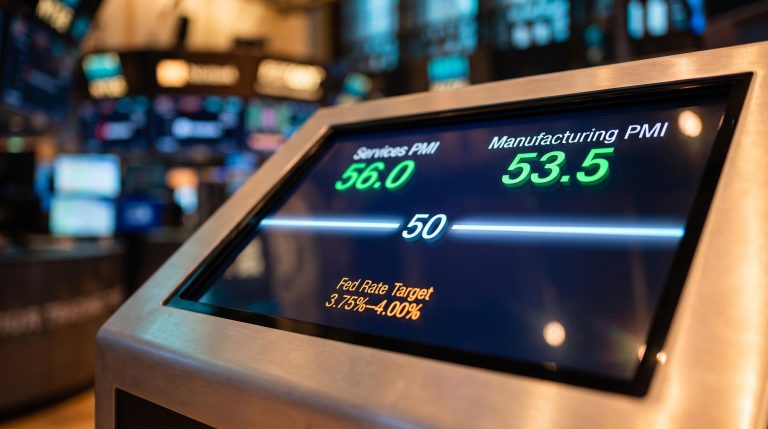
The FOMC voted unanimously in September 2026 to lift the federal funds rate to 3.75%-4.00%, up from the 3.50%-3.75% range it had held since July. That is the anchor fact, and Barr made no attempt to soften it.
He described the increase as an “important step” to recalibrate short-term borrowing costs, and he was explicit that it was a step, not a destination.
“Further policy adjustments are likely to be needed to ensure inflation comes down to target in a timely fashion.” — Governor Michael Barr, 23 September 2026
The market translated that language almost instantly. The CME FedWatch Tool, which converts futures pricing into probabilities of Fed moves, showed a sharp shift in the odds of further tightening.
- Federal funds rate target range: 3.75%-4.00%, set at the September 2026 FOMC meeting on a unanimous vote.
- October 2026 hike probability: approximately 55%, up from around 9% a month earlier, according to Dow Jones Newswires on 23 September 2026.
- Year-end hike probability: roughly 90% for at least one more quarter-point increase, per Reuters on 15 September 2026, citing CME FedWatch.
- FOMC dot-plot: 16 of 18 participants expect at least one more rate increase in 2026.
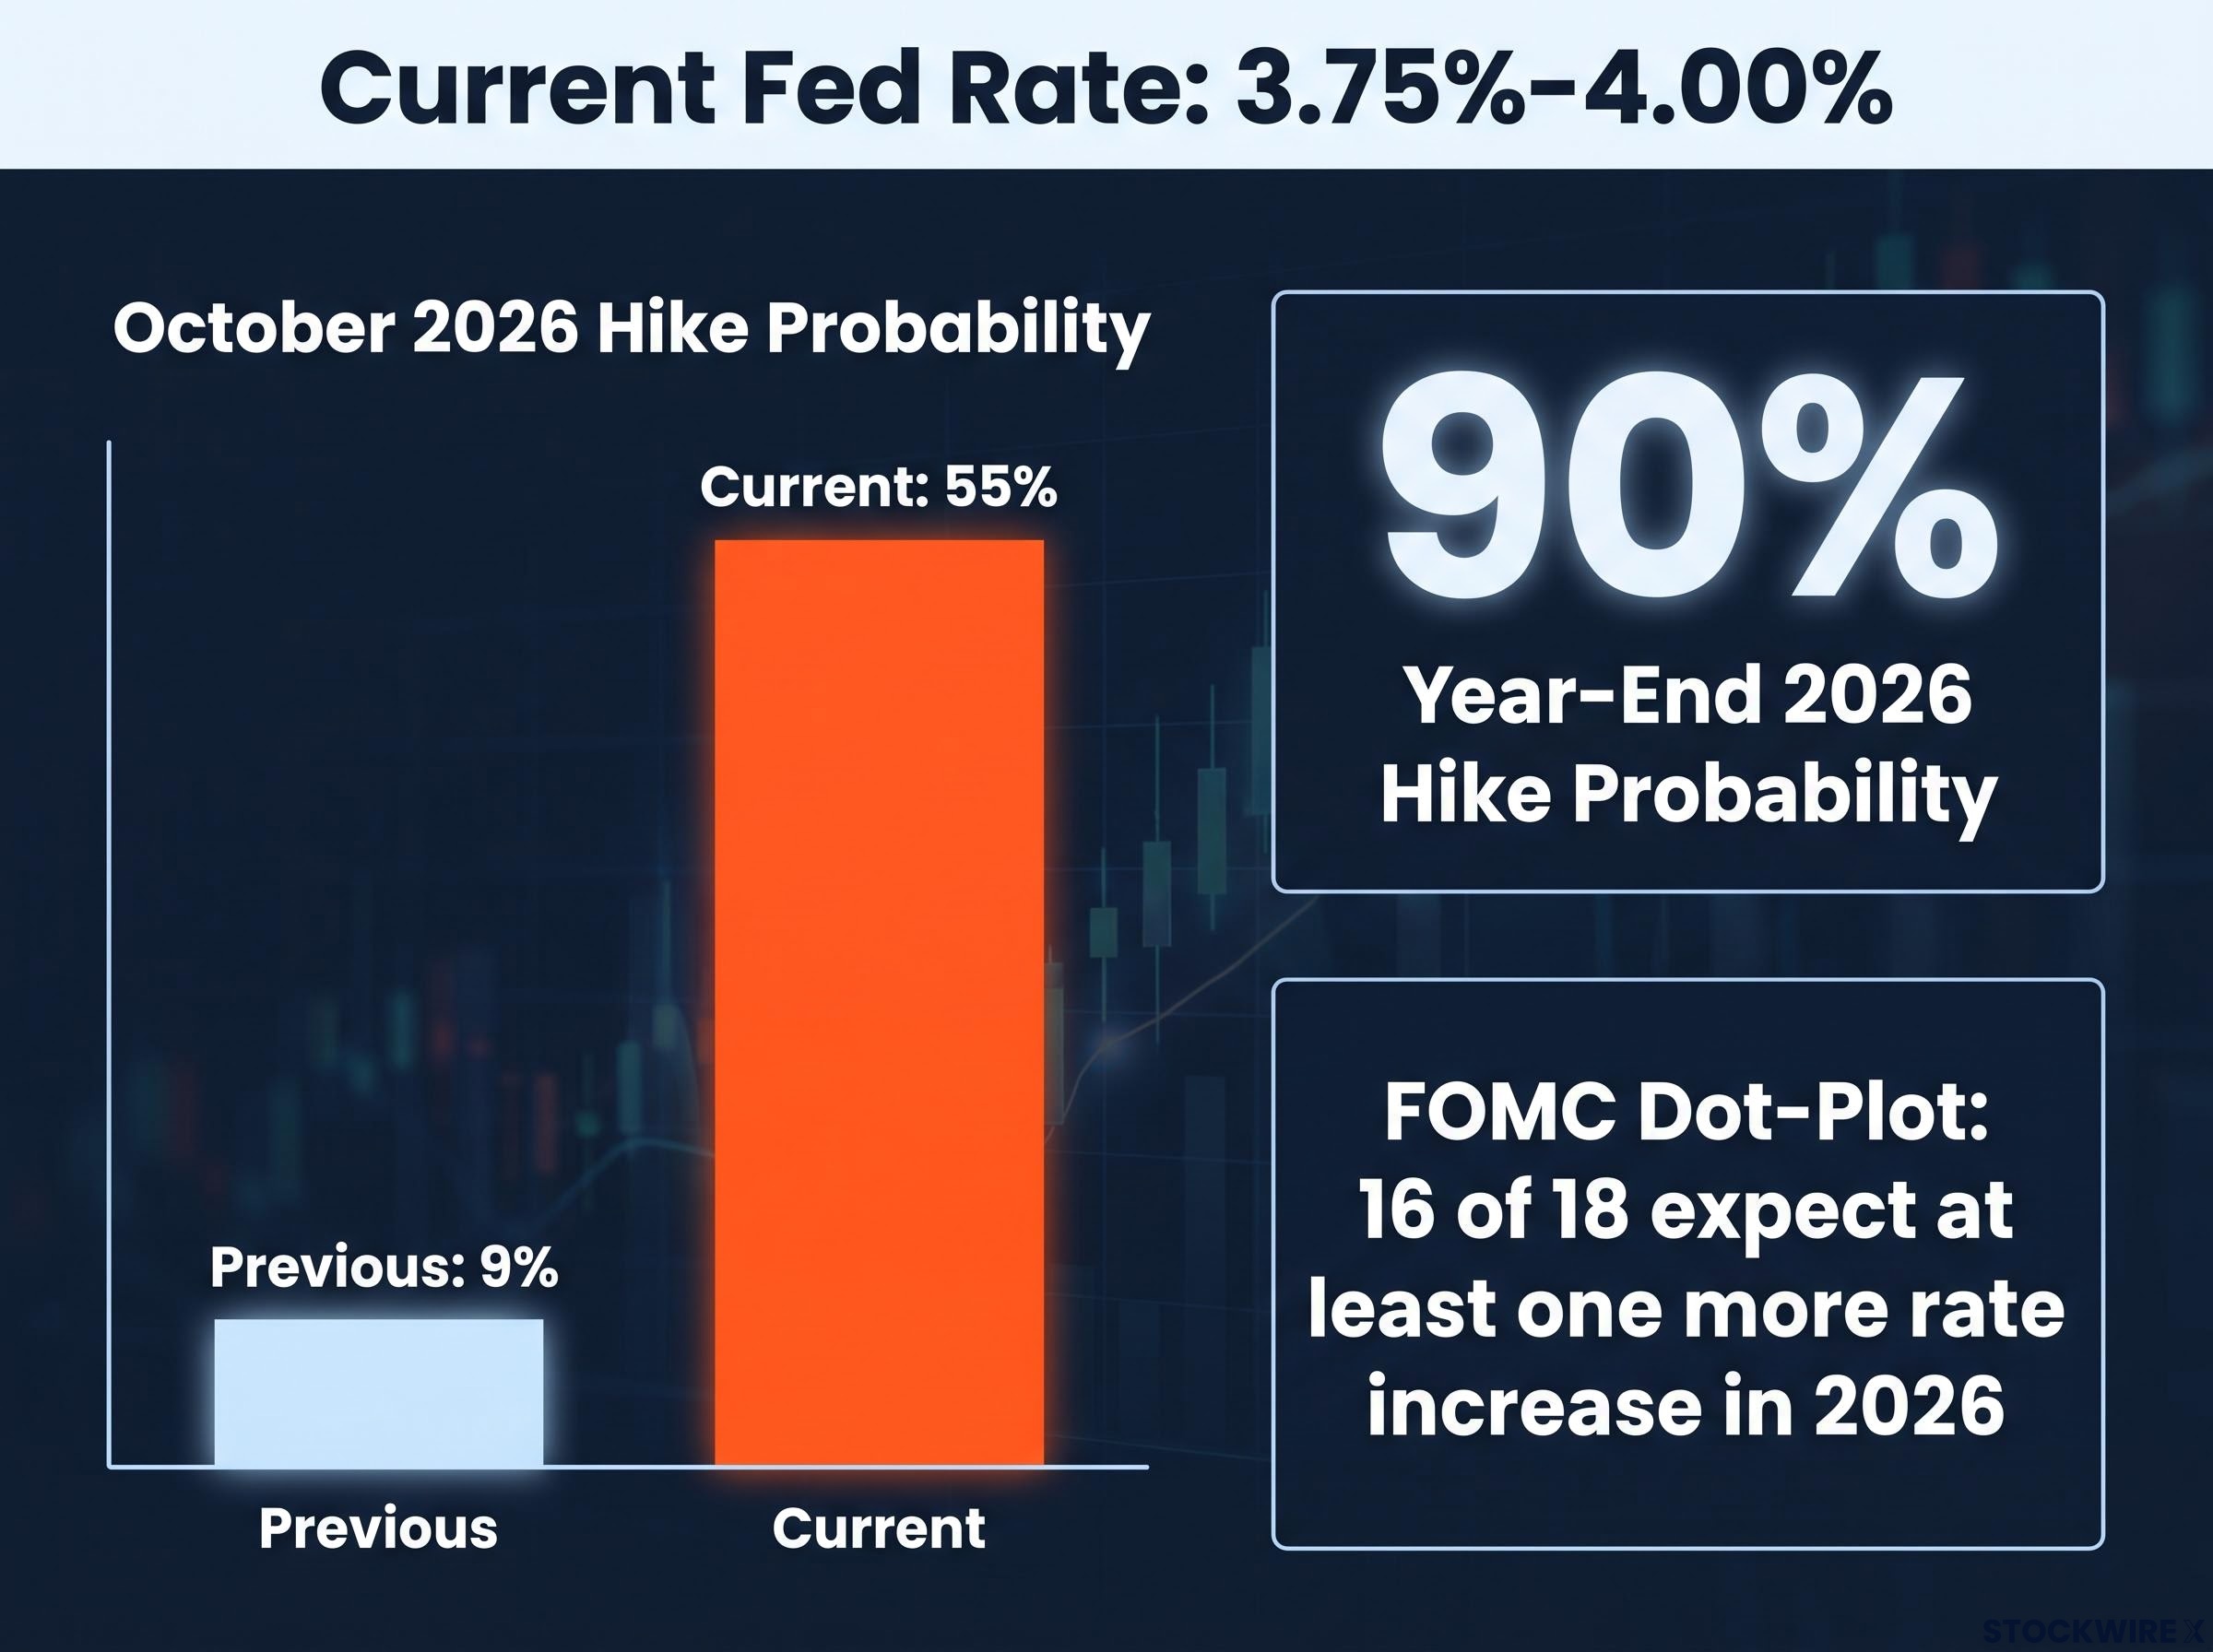
The jump in October odds from 9% to 55% in a single month is the detail worth sitting with. That kind of move does not reflect traders nudging one meeting’s probability higher. It tells you the Fed’s communication shifted the market’s entire baseline, repricing the whole trajectory rather than a single outcome.
The September unanimous vote was not inevitable: hawkish FOMC dissent in July, when three regional presidents voted for an immediate hike that the committee majority deferred, sent the 30-year Treasury yield to its highest level since 2007 and moved swap markets to price a 60% probability of the very September move that just arrived.
For you, this probability data is not an academic curiosity. It is the closest thing to a live read on what sophisticated money expects the Fed to do, and it is the foundation every other decision in this environment rests on.
When big ASX news breaks, our subscribers know first
Why inflation is still too high, and what is keeping it there
If the September hike answered the “what,” Barr spent most of his recent remarks on the “why.” And his explanation was specific enough to be useful.
The inflation gauges the Fed actually watches
Two numbers dominate the Fed’s thinking. The Consumer Price Index (CPI) is the broad measure of what urban consumers pay across a basket of goods and services. The Personal Consumption Expenditures index (PCE) is the Fed’s preferred gauge, and it weights categories like healthcare and services differently, which is why the two figures rarely match exactly.
The BEA PCE price index, the Fed’s preferred inflation gauge, weights healthcare and services more heavily than CPI does, which is why its persistent reading near 3 percent carries more weight in FOMC deliberations than the headline CPI figure alone.
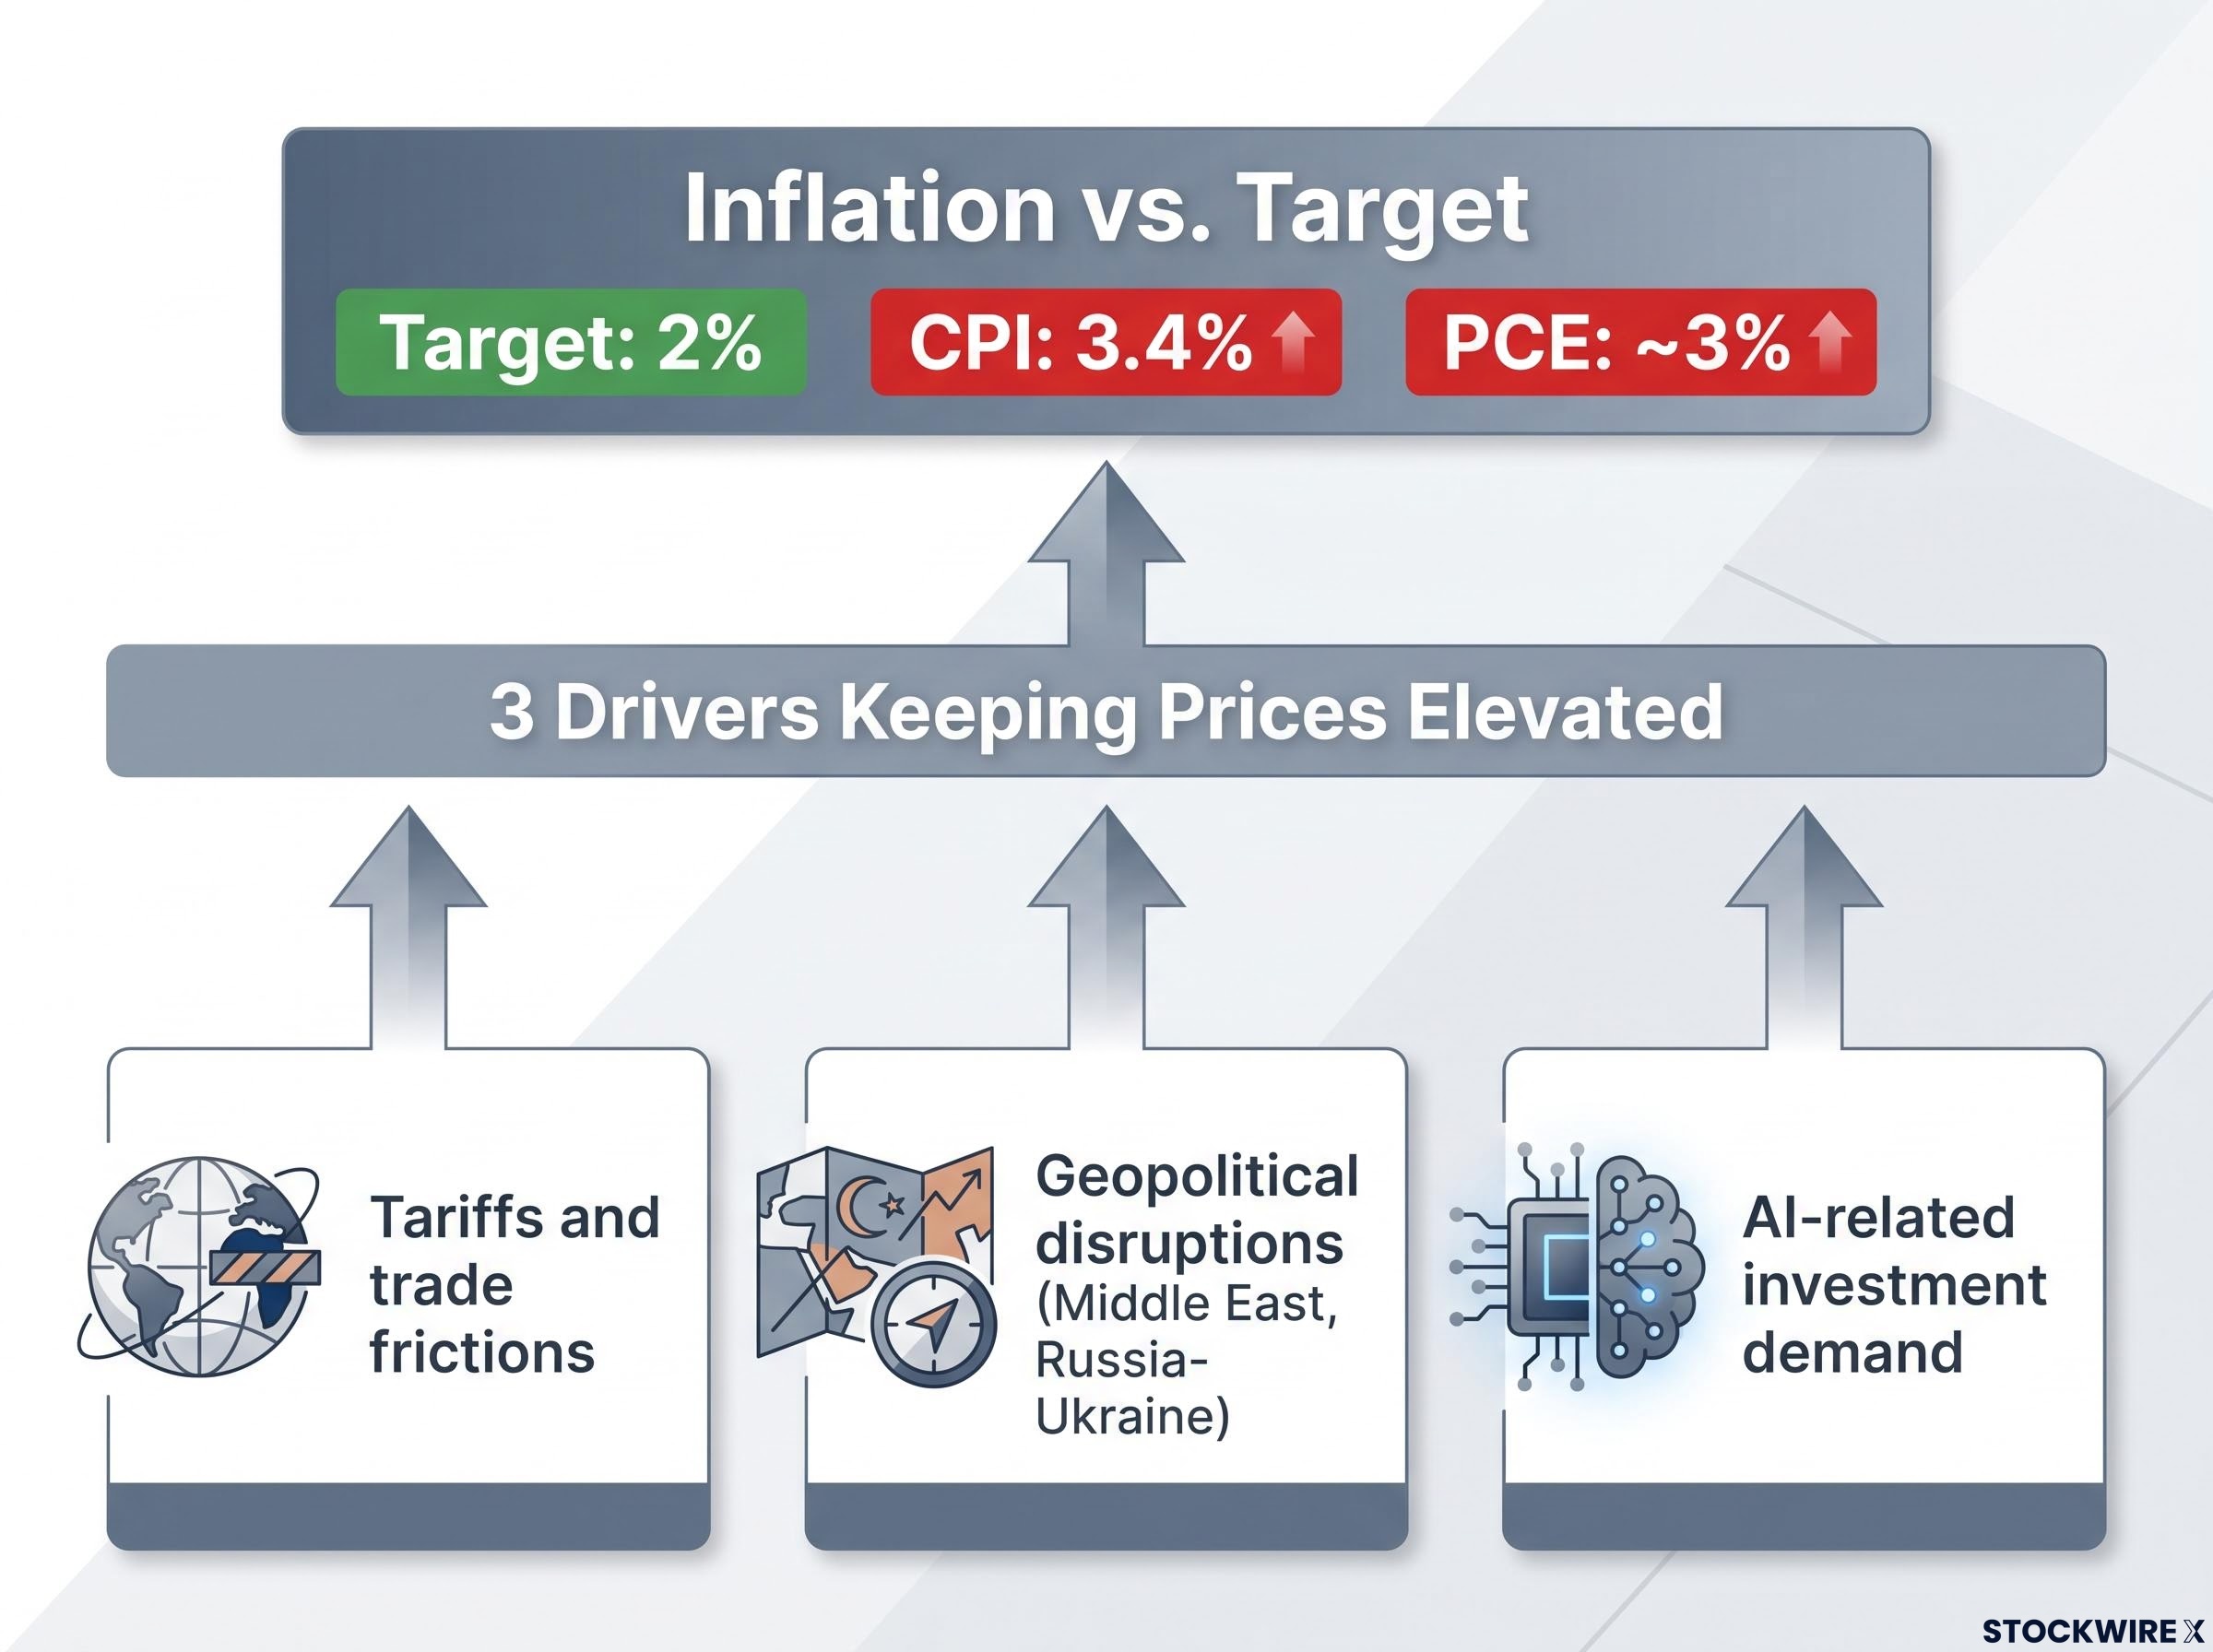
The latest CPI, released by the Bureau of Labor Statistics on 11 September 2026, showed prices rising 0.4% month-over-month and 3.4% over the prior year. PCE, meanwhile, has been running near 3%, which by Barr’s own account in February 2026 was “about where it was a year ago.”
The August CPI breakdown published on 11 September 2026 showed core rising 0.3% month-over-month, beating consensus, but the composition mattered as much as the headline: a 5.9% airline fares spike and shelter re-acceleration drove the beat, not tariff pass-through, which is precisely why Barr’s remarks the same day leaned on structural and geopolitical drivers rather than goods-price pressure.
Both gauges point the same direction: well above the 2% target and not clearly trending down. That the PCE barely moved across a full year is the whole story. Whatever the Fed did in 2025 was not enough, and inflation is not retreating so much as persisting, which is precisely why Barr’s language escalated from “monitor carefully” to “act decisively.”
Barr named three specific drivers keeping prices elevated, each with its own logic:
- Tariffs and trade frictions: higher import costs feed directly into goods prices, and Barr cited these as an ongoing source of pressure.
- Geopolitical disruptions: the Middle East conflict and Russia-Ukraine disruptions have kept energy costs and supply chains under strain.
- AI-related investment demand: the rapid expansion of AI capital spending has added demand and created potential capacity bottlenecks that push prices higher.
Underneath these shocks sits a stickier problem. Core non-housing services inflation, which reflects wage dynamics and steady demand for services, does not respond to rate hikes the way goods prices do. It cools slowly, which is why Barr warned that “with inflation above target for a protracted period, there is a risk of broader price pressures taking hold.”
For you as an investor, the distinction between structural and shock-driven inflation changes how you read every data release. If the tariff and geopolitical channels ease, the picture shifts and the Fed’s urgency fades. If they persist, the posture holds, and so does the pressure on rate-sensitive assets.
How to read hawkish Fed signals, and what history says happens next
Understanding what the Fed is doing is one thing. Learning to read its language before the decisions land is where the real edge sits.
“Hawkish” is central bank shorthand for a bias toward tighter policy: higher rates, and a willingness to prioritise controlling inflation over supporting growth. Barr’s September remarks were hawkish by any plain reading, and market professionals have tools to quantify exactly how hawkish.
FXStreet’s Speechtracker assigned Barr’s remarks a score of 8 out of 10, above its historical hawkish baseline of 7. The FXS Fed Sentiment Index, which tracks tightening bias, climbed 0.42 points to 148.81.
FXS Fed Sentiment Index: 148.81 (up 0.42 points), signalling a strong tightening bias in Barr’s language.
That matters because it converts tone into a measured signal. When professionals quantify Barr’s September language, it registers above the hawkish line, which tells you the escalation is not an impression. The Fed’s centre of gravity has genuinely shifted.
History offers a guide to what typically follows a hawkish pivot, and the precedents are specific rather than vague.
| Tightening cycle | Trigger | Fed response | Primary market consequence |
|---|---|---|---|
| 2022-2023 | Post-pandemic inflation surge | Rates from near-zero to above 5% in roughly a year | Long-duration bond drawdowns, yield-curve inversion, bank balance-sheet stress from unrealised losses |
| Mid-2000s | Rising inflation after extended accommodation | Steady, rapid tightening | Bond-market turmoil and stress for carry trades |
| 1994 | Pre-emptive move against emerging inflation | Surprise rapid tightening | Sharp bond-market disruption |
The 2022-2023 episode is the closest analogue. Rates climbed from near-zero to above 5% in about a year, and the fallout included steep drawdowns in long-duration bonds and high-growth equities, an inverted yield curve historically tied to recession risk, and bank balance sheets strained by unrealised losses on the securities they held.
The mid-1990s and mid-2000s cases carry a different lesson: when the Fed delayed acting on inflation, it was forced into more aggressive moves later, which amplified the disruption. That is the trap Barr appears determined to avoid.
It helps to remember the machinery behind all this. The FOMC has 12 voting participants and meets eight times a year to set the policy rate. Alongside that rate, the Fed uses balance-sheet tools: quantitative easing (QE), which involves buying bonds to inject credit, and quantitative tightening (QT), which lets those holdings mature without reinvestment to shrink the balance sheet. Both operate in the background of the current cycle.
For you, the takeaway is that reading central bank language, not just rate decisions, delivers earlier signals. The 2022-2023 cycle rewarded investors who acted on the Fed’s communication before the hikes arrived, not those who waited for confirmation.
What this rate environment actually means for your portfolio
You have the what, the why, and the historical context. Now the practical question: what do you actually do before the next FOMC meeting?
The core logic is straightforward. Higher rates held for longer compress risk premia and change the relative attractiveness of every major asset class at once. When cash and short-term Treasuries yield meaningfully, the bar for holding riskier assets rises.
At the current 3.75%-4.00% rate against PCE near 3%, real rates sit at roughly 0.75%-1.00%. That is restrictive but not yet extreme, which is exactly why Barr feels there is room to move higher.
| Asset class | Hawkish Fed headwind or tailwind | Positioning consideration |
|---|---|---|
| Short-duration fixed income | Tailwind | Lower interest-rate risk while capturing higher short-term yields |
| TIPS (inflation-linked) | Tailwind if inflation persists | Hedge against PCE staying above target longer than expected |
| Growth and unprofitable tech | Headwind | Historically underperforms in hawkish environments |
| Value, financials, defensives | Relative tailwind | Stronger balance sheets; defensives cushion overtightening risk |
| Money market and cash | Tailwind | Competitive yields versus equities and long-duration bonds |
On fixed income, shorter-duration bonds and cash-like instruments reduce interest-rate risk while capturing higher short-term yields. Laddered maturities help manage reinvestment risk, and TIPS offer protection if PCE stays sticky.
On equities, the 2022-2023 precedent is instructive: rate-sensitive growth stocks and unprofitable technology were hit hardest, while value, financials, and quality cyclicals held up better. Defensive sectors like staples, utilities, and healthcare become more appealing if overtightening risk materialises.
AI earnings momentum introduces a conditional wrinkle to the standard hawkish-Fed playbook: rate futures currently price roughly two-in-three odds that the policy rate ends 2026 above 4.00%, yet the Nasdaq rallied 2.26% on the same day Musalem called for front-loaded hikes, a divergence that holds only as long as technology earnings growth continues to outrun the discount-rate drag.
That risk is real. With real rates already restrictive and monetary policy working with well-documented lagged effects, further hikes could overshoot, particularly for housing and commercial real estate. The counterintuitive point is this: even if the Fed pauses after October, the impact of hikes already delivered has not yet fully arrived.
Three moves worth weighing now, in order of priority:
- Shorten duration in your fixed income to cut interest-rate risk while yields are attractive.
- Rotate sector exposure toward value, financials, and defensives, away from rate-sensitive growth.
- Hold adequate liquidity so you can navigate volatility and act on dislocations.
The investor who waits for the Fed to signal a pause before repositioning is already late. The repricing happens on the signal, not the meeting, which is exactly what that jump from 9% to 55% demonstrated.
This article is for informational purposes only and should not be considered financial advice. Investors should conduct their own research and consult with financial professionals before making investment decisions. Past performance does not guarantee future results, and financial projections are subject to market conditions and various risk factors.
Navigating the next chapter of Fed policy before the data decides it
The Fed’s next move is not settled, and Barr has been unusually transparent about what will decide it. Three variables will determine whether October brings another hike or a pause:
- September CPI, released by the Bureau of Labor Statistics in the second week of October, ahead of the October 2026 FOMC meeting.
- The core PCE trajectory, and whether it shows any clear move toward target.
- Labour market indicators, watched for any sign of softening that would ease the pressure to hike.
The roughly 90% year-end probability of at least one more increase does not mean certainty. It means the burden of proof has shifted to the inflation data, and one or two softer readings could reprice those odds sharply lower.
What makes this actionable is that Barr has effectively published his decision function. He has said the Fed could “take a bit more time” if data shows inflation moderating on a clear path to 2%, and that if inflation is “not moderating sufficiently,” the Fed should do the opposite.
“Act decisively to raise rates.” — Governor Michael Barr, describing the Fed’s response if inflation fails to moderate.
Name those two conditions, convincing moderation versus insufficient progress, and you know which way the Fed leans before the meeting happens. In a data-dependent environment, that is not uncertainty; it is a roadmap. Watch the same variables the Fed watches, understand the thresholds that matter, and each incoming release becomes a forward signal rather than a surprise.
For readers wanting to understand why further hikes could paradoxically loosen rather than tighten credit conditions, our dedicated guide to yield curve dynamics examines how a steepening spread improves bank net interest margins and stimulates new loan origination, a counterintuitive risk that makes overtightening harder to detect in real time.