Why AI Model Makers May Earn Less Than Airlines
4 mins ago

A 60-day ceasefire memorandum between the United States and Iran, paired with a commitment to reopen one of the world’s most consequential shipping chokepoints, sent equity markets to record highs, crude oil to multi-month lows, and at least one major investment bank back to a bullish stance within a single trading session. The agreement, structured as a 14-point memorandum of understanding, has compressed the geopolitical risk premium that had been embedded in global asset prices for months. For investors, the immediate price action reflects a rational, if provisional, repricing of tail-risk scenarios that had been weighing on equities, supply chains, and inflation expectations simultaneously. This analysis unpacks what drove those market moves at the mechanical level, identifies which sectors stand to benefit most durably, and presents the honest case for why the rally may have moved faster than the underlying fundamentals warrant.
The agreement’s provisions are not a single headline event. Each one carries a distinct timeline and a distinct market implication, and the sequence matters.
The five core provisions, in the order of their contractual timeline:
The formal signing is scheduled for Friday.
The scale of the disruption that preceded this agreement provides necessary context: the effective closure of the Strait of Hormuz drove a 57% crude price surge from roughly $70 per barrel in late February 2026 to above $110 per barrel by mid-May, removing nearly 11 million barrels per day from global supply with no bypass infrastructure capable of replacing that volume.
Analysts characterise the memorandum as tentative, noting it pushes hard structural questions into the 60-day discussion period rather than resolving them at the point of agreement. That distinction determines which market moves are pricing confirmed catalysts and which are front-running provisions that may not materialise on schedule.
| Provision | Timeline | Market Implication |
|---|---|---|
| Maritime reopening (Strait of Hormuz) | Within 30 days of signing | Crude oil repricing, shipping cost relief, inflation softening |
| Sanctions suspension | Effective upon signing | Immediate drop in energy futures, upstream margin compression |
| Frozen capital release | Terms under negotiation | Incremental buying power for risk assets if deployed |
The numbers from the trading session tell a coherent story once read as risk-premium unwinding rather than speculative momentum.
NBER research on geopolitical risk premiums documents how geopolitical shocks adversely affect energy commodity prices and broader equity markets, providing the academic framework for understanding why a credible de-escalation event compresses that embedded premium as rapidly as the market demonstrated in this session.
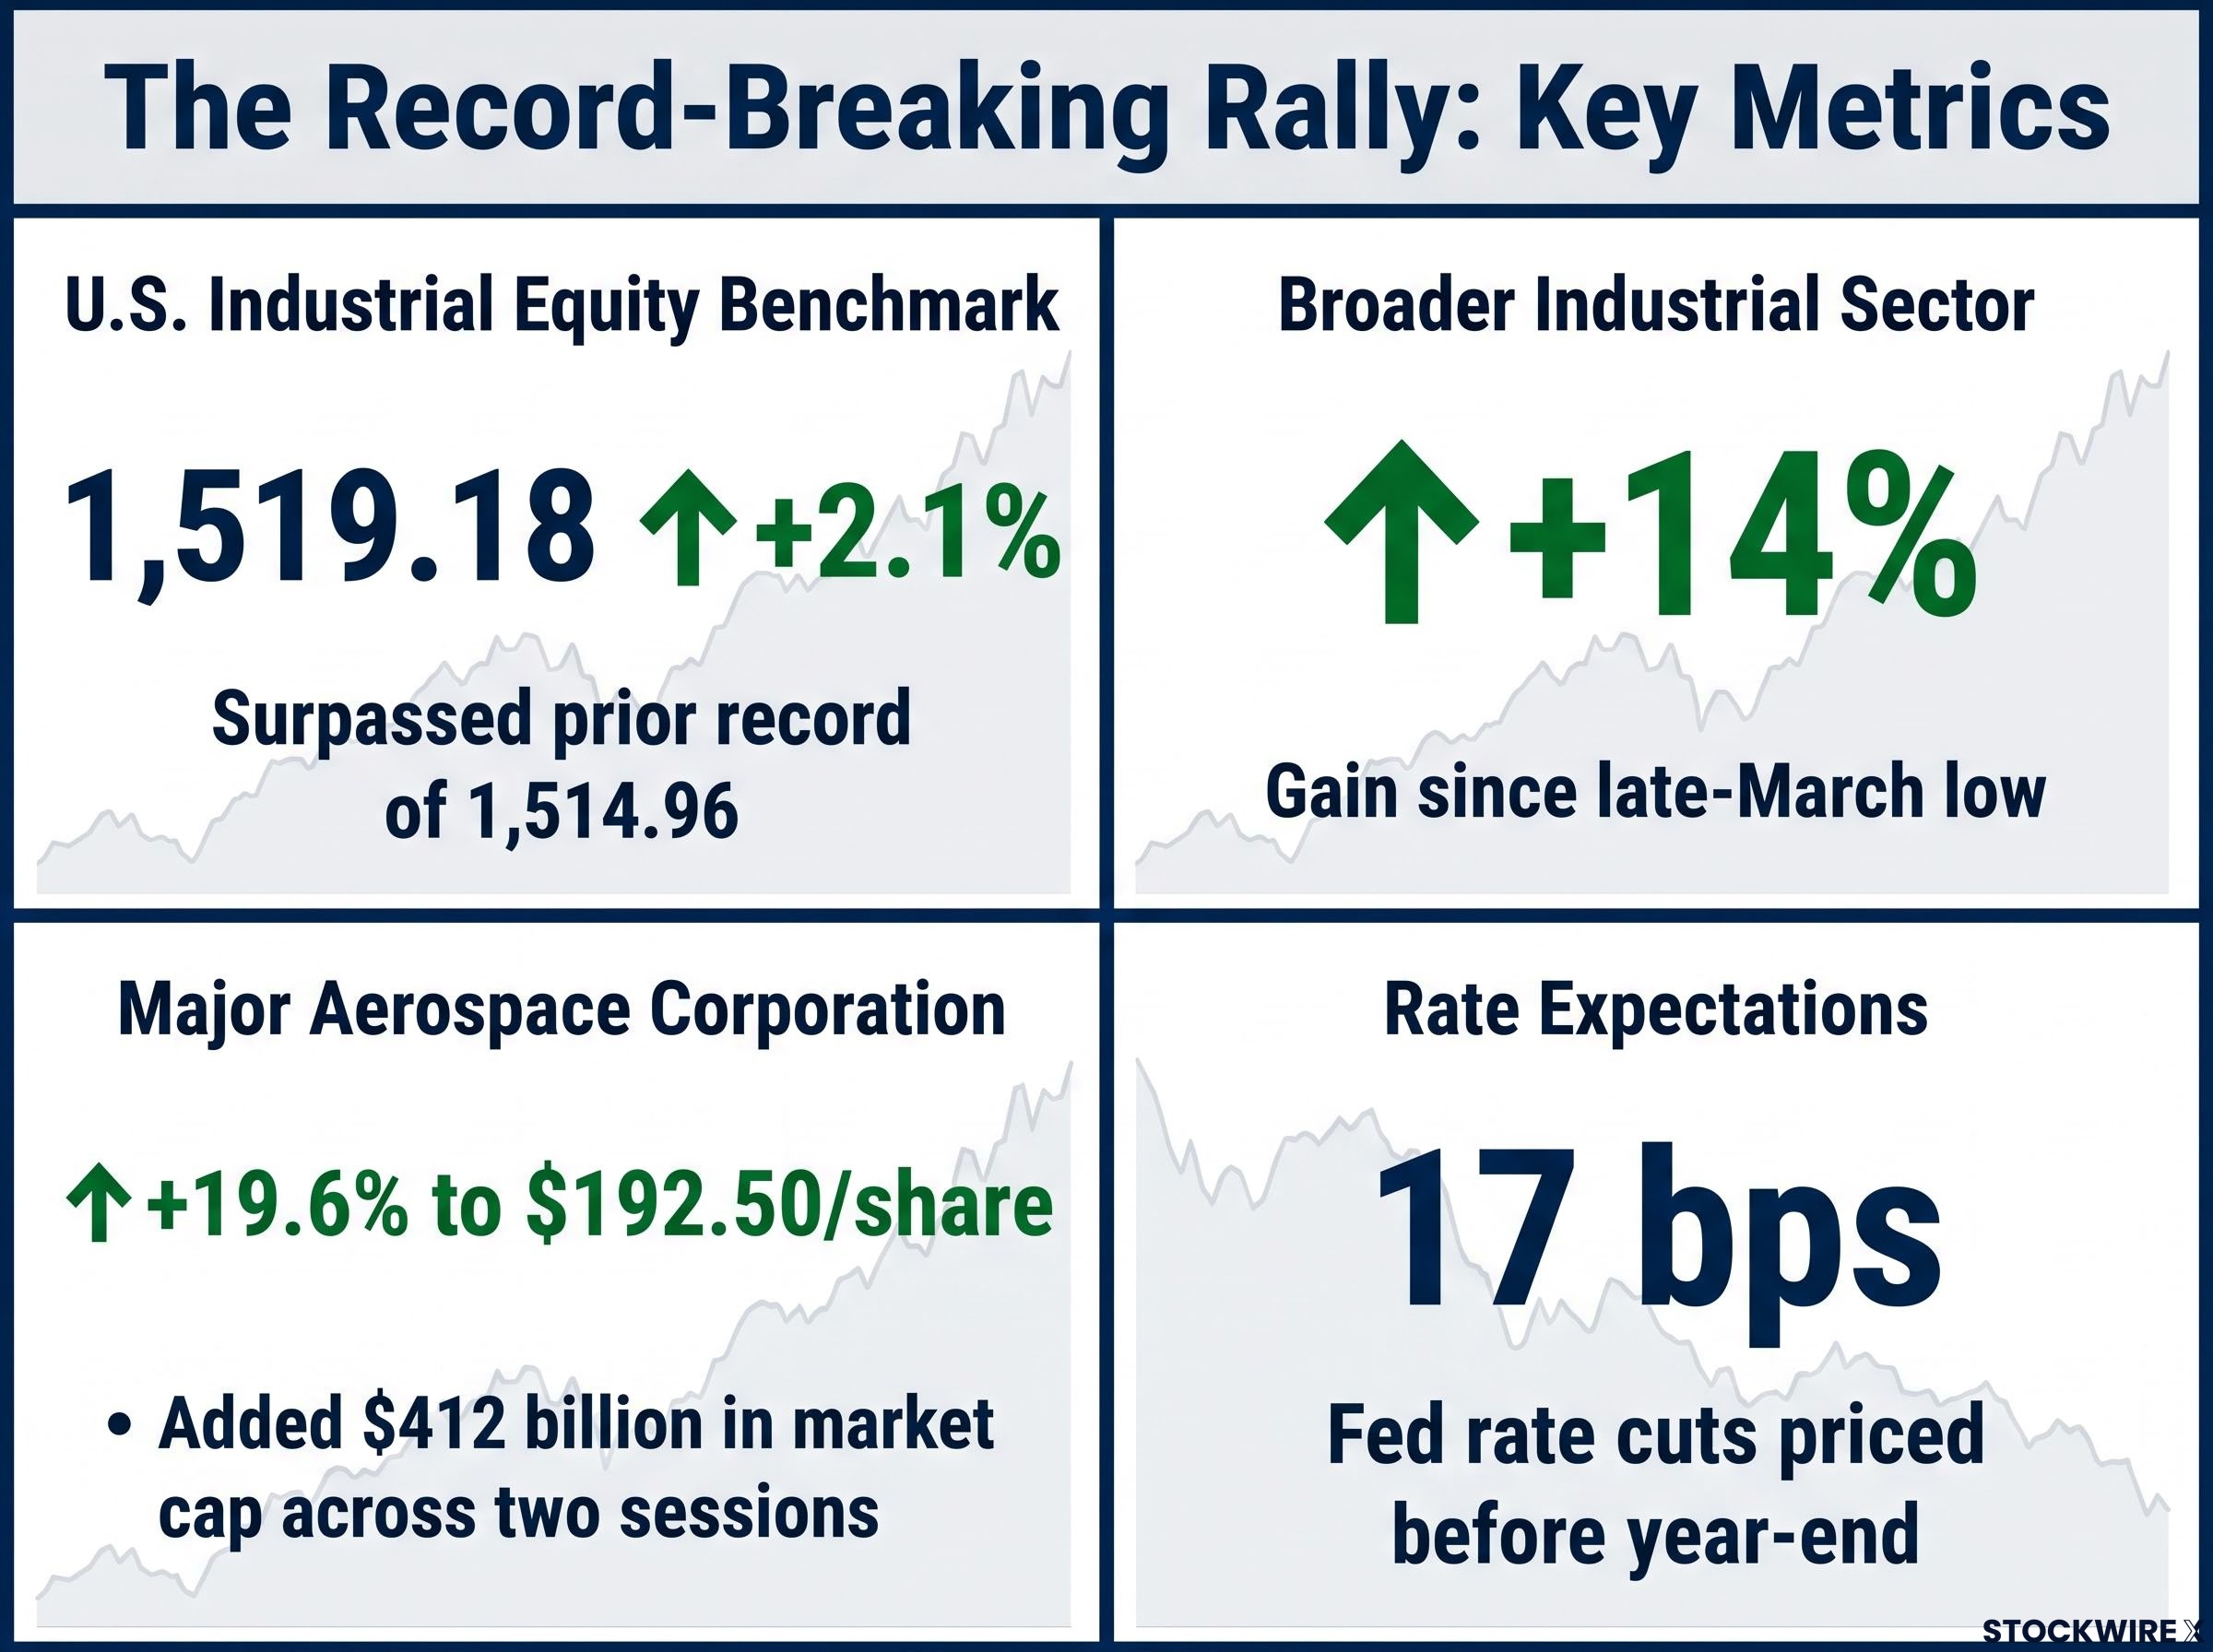
The U.S. industrial equity benchmark climbed approximately 2.1% to reach 1,519.18, surpassing its prior record of 1,514.96. The broader industrial sector has now gained roughly 14% since its late-March low. Crude oil fell to multi-month lows as the market priced out worst-case supply disruption scenarios. Financial markets began pricing approximately 17 basis points of Federal Reserve rate cuts before year-end, a modest but meaningful shift in the interest rate outlook.
The single-stock repricing was even more concentrated. One major aerospace corporation gained 19.6% in overnight trading, reaching $192.50 per share and adding $412 billion in market capitalisation across two sessions.
A major aerospace corporation added $412 billion in market capitalisation across two trading sessions, gaining 19.6% overnight to reach $192.50 per share, the sharpest single-name repricing of the rally.
An investment banking division shifted its short-term outlook back to bullish, citing the maritime agreement as the catalyst. That institutional signal matters because it reflects a repricing of forward models, not retail enthusiasm chasing headlines.
The U.S. dollar softened. Treasury yields eased. Gold and long-dated government bonds underperformed as the fear bid that had supported defensive positioning for months began to fade.
These moves are not separate reactions. They are the mirror image of the equity rally. When investors reduce the probability of conflict escalation in their models, capital flows out of safe havens and into risk assets simultaneously. The two sides of the trade confirm each other’s logic.
The rally is not abstractly geopolitical. It is grounded in concrete operational and financial mechanisms with measurable dollar consequences, and tracing the transmission chain clarifies why specific asset classes moved.
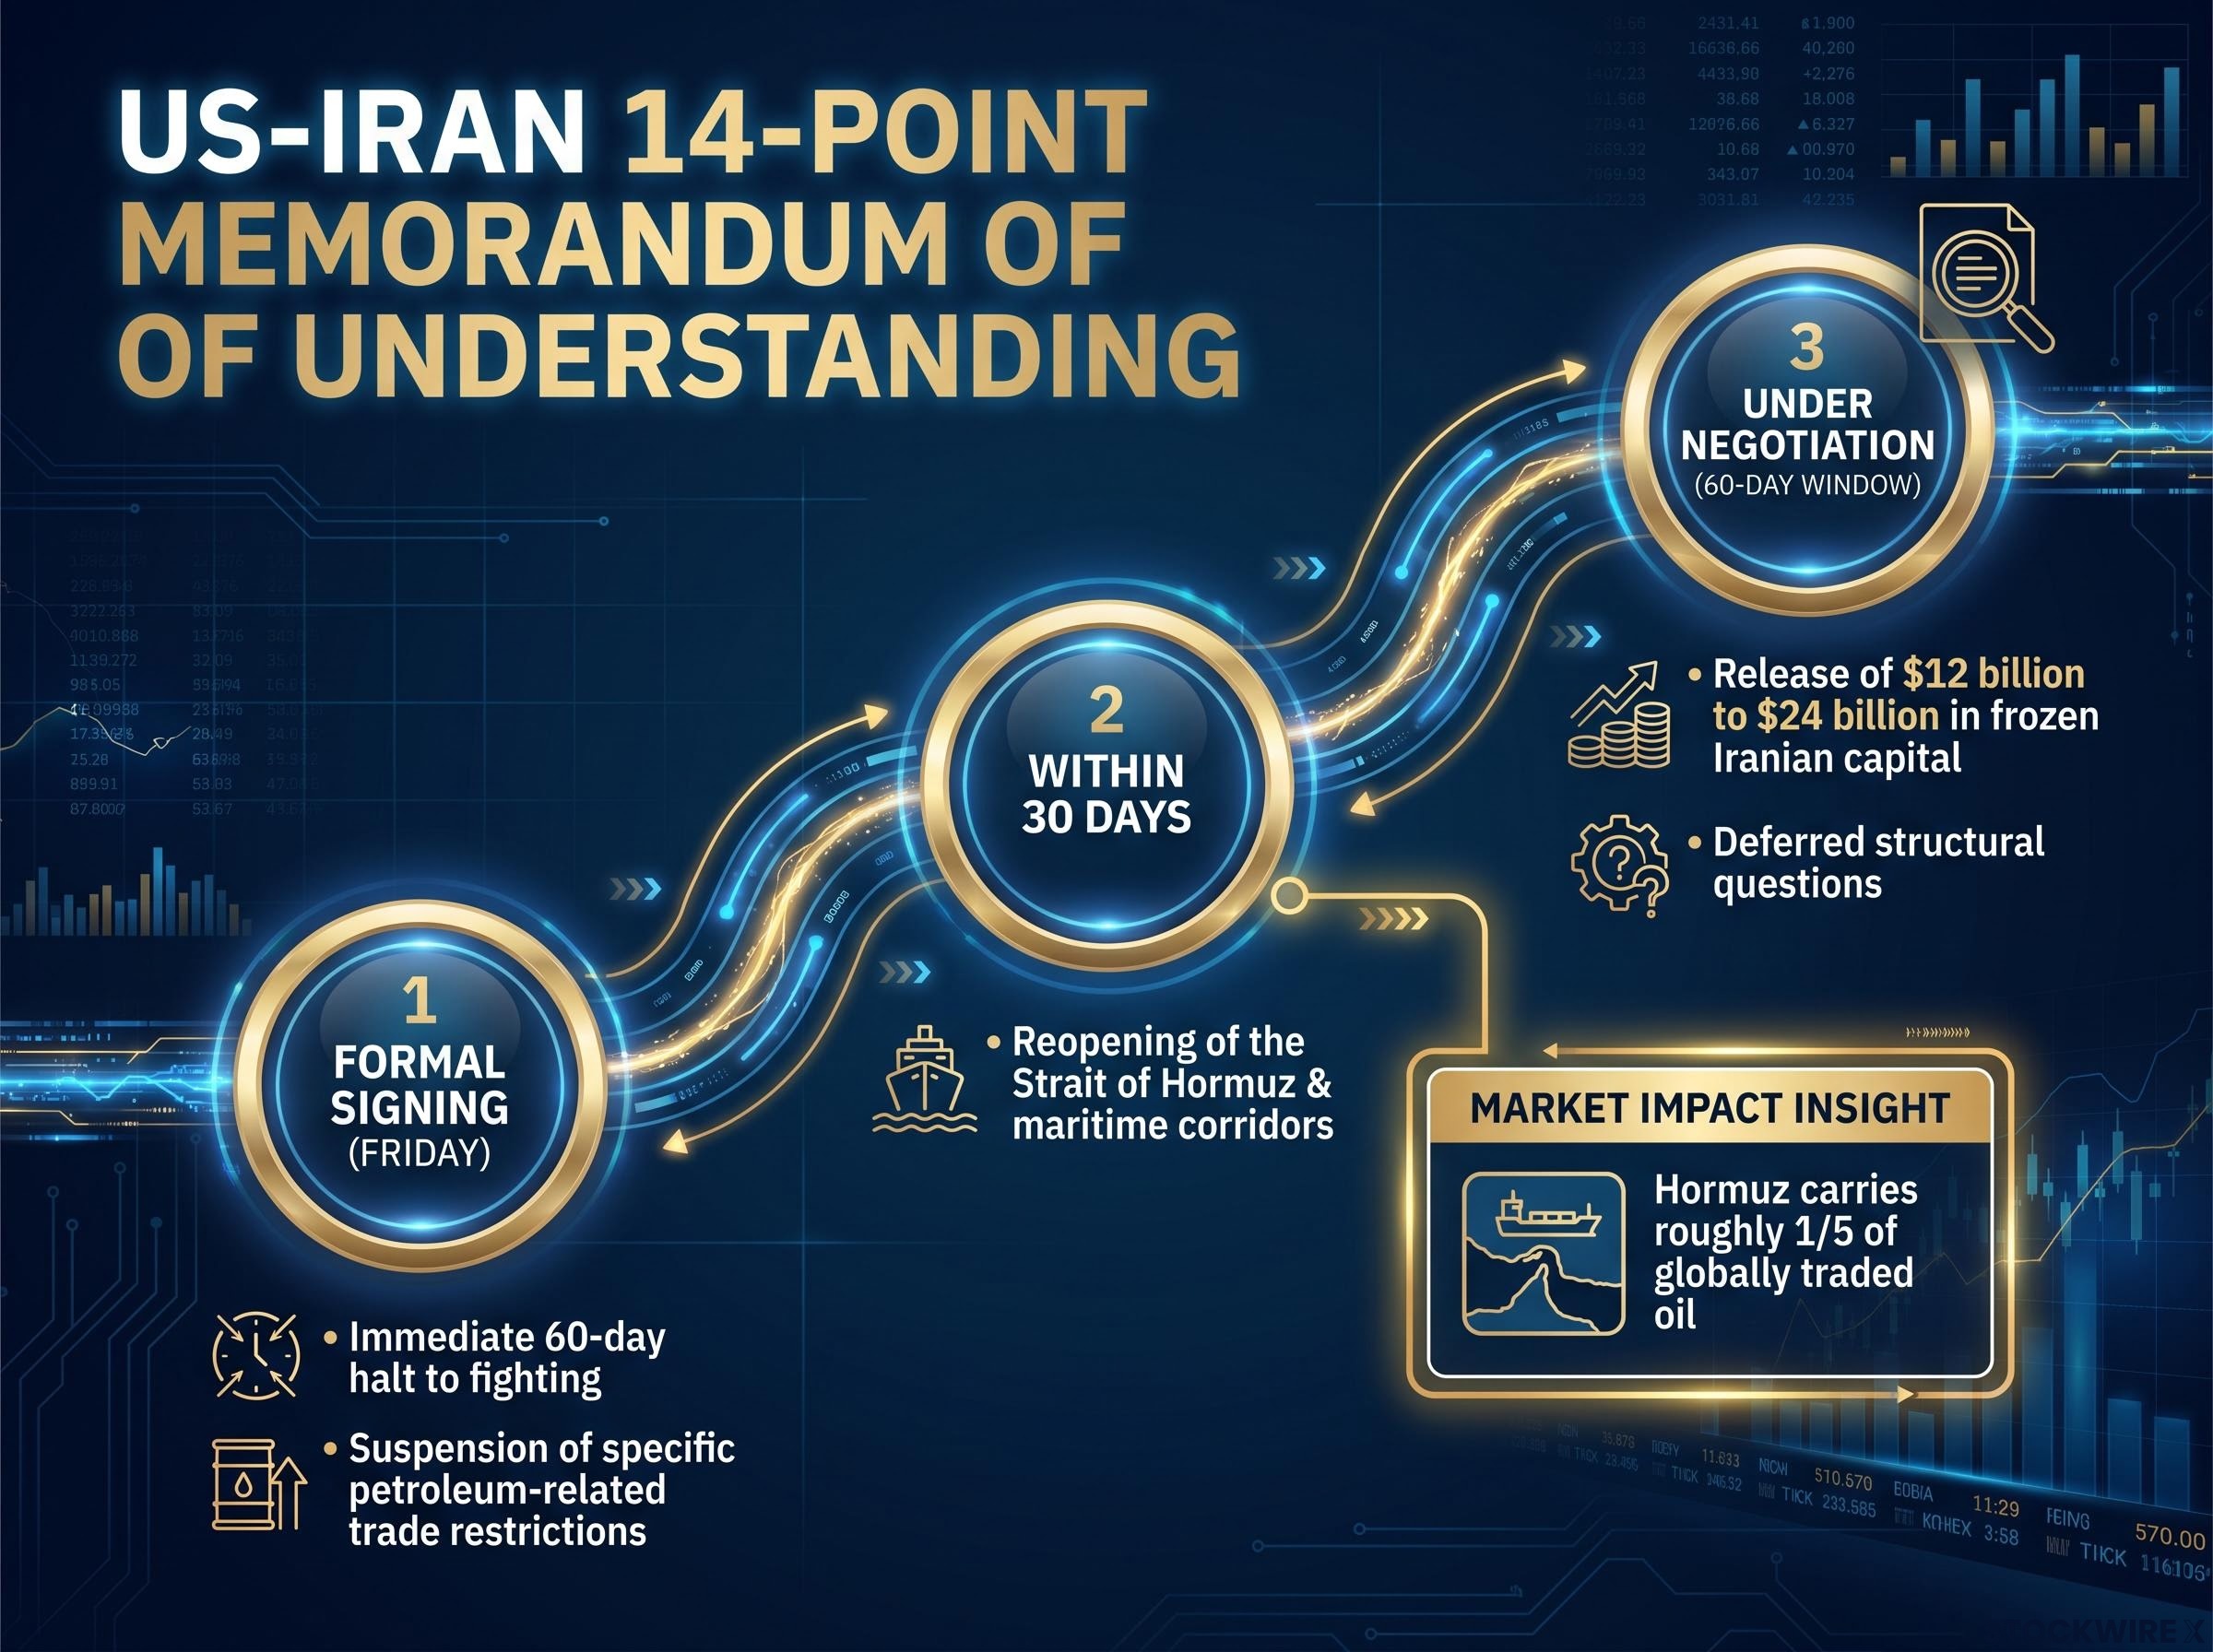
The Strait of Hormuz carries roughly one-fifth of globally traded oil under normal conditions. When disrupted, the costs extend well beyond headline crude prices. Shipping companies reroute around longer corridors, incur insurance surcharges, and pass higher effective costs through supply chains. The agreement’s 30-day reopening timeline, if implemented, would relieve pressure across four categories of businesses most directly affected:
EIA data on Hormuz oil transit volumes records the strait averaging 21 million barrels per day in 2022, roughly 21% of global petroleum liquids consumption, a concentration that makes even a partial disruption capable of producing outsized price dislocations across global energy markets.
The frozen capital release represents a separate transmission channel. When frozen sovereign or institutional assets re-enter the financial system, whether $12 billion or $24 billion, they represent real incremental buying power for risk assets. Governments and institutions deploy released capital into equities, credit, and trade finance. This is not a sentiment signal; it is a measurable increase in demand for financial assets.
The gap between the two channels matters. Oil futures repriced immediately, but physical supply normalisation lags. Actual vessel routing, cargo insurance rates, and supply flows through Hormuz take weeks to normalise once the agreement is signed.
The supply chain normalisation lag is not a minor caveat: Saudi Aramco has warned that full supply recovery could extend into 2027 even under a best-case diplomatic outcome, and the IEA estimates the cumulative disruption erased approximately 880 million net barrels from global markets, a deficit that physical production ramp-ups cannot reverse on a weeks-long timeline.
Analysts caution that while oil futures reacted immediately, physical relief for energy markets “could be slow to materialise,” a gap that separates the paper repricing from the operational reality.
A peace-driven rally is not uniformly positive for every holding in a diversified portfolio. The deal’s specific mechanics create divergent outcomes across sectors, and the asymmetry is structural rather than directional.
The industrial sector’s 14% gain from its recent low positions it as the leading beneficiary indicator, driven by shipping cost relief and lower energy input prices. Rate-sensitive growth assets, including technology and small caps, benefit through a different channel: if lower energy prices translate into softer inflation readings, the Federal Reserve faces less pressure to maintain restrictive policy. The 17 basis points of rate cuts currently priced before year-end could widen if that inflation-softening channel proves durable.
Energy producers sit on the other side of the trade. Persistently lower crude prices compress upstream margins even as the macro environment improves for most other sectors. Assets that rallied most sharply on momentum, particularly speculative aerospace and defence names, carry headline-reversal risk if implementation stumbles.
| Sector | Why It Benefits or Faces Headwinds | Key Risk |
|---|---|---|
| Industrials and cyclicals | Shipping cost relief, lower fuel inputs | Physical supply normalisation lags futures pricing |
| Airlines and logistics | Lower jet fuel costs, fewer route detours | Insurance surcharges may persist beyond ceasefire |
| Rate-sensitive growth (tech, small caps) | Inflation softening supports easier monetary policy | Fed remains hawkish if core inflation stays elevated |
| Emerging markets | Weaker dollar, lower oil import bills | Capital flows reverse if deal collapses |
| Energy producers | Lower crude prices compress upstream margins | Oil rebounds sharply if implementation fails |
Every durable repricing and every head-fake rally look identical in the first session. The following five cautions are not abstract pessimism; each identifies a specific gap between what the market has priced and what the evidence currently supports.
A prior failed negotiation attempt in late May 2026 illustrates precisely this dynamic: Brent crude fell nearly 5% to $98.87 per barrel when a preliminary framework emerged, then erased those gains almost entirely when Iran rejected the same framework over permanent Hormuz authority, compressing months of deal-driven price support in a single session.
The session data illustrates the pattern clearly. Outsized gains in aerospace (19.6%) and speculative technology names arrived without fundamental earnings revision; they were driven entirely by geopolitical de-escalation sentiment. Historically, narrow, momentum-heavy surges in high-beta and speculative names are prone to sharp reversals if headlines deteriorate or macro data disappoints.
This is not a bearish call. It is a position-sizing consideration. The magnitude of the initial repricing in concentrated names means those positions carry asymmetric downside if the 60-day window produces unfavourable developments.
The agreement’s value to investors is not determined at signing but over the implementation window. The following six signposts, ordered by confirmatory power, convert the geopolitical complexity into a manageable monitoring framework.
The structurally sound investor posture is calibrated exposure with defined exit signals, not all-in conviction. Maintain diversified exposure to benefit from risk-premium compression while avoiding over-concentration in names that have already spiked, adjusting only as the evidence base develops.
The 30-day maritime reopening timeline provides the first hard operational checkpoint. If vessel data confirms normalised flows through Hormuz on that schedule, the case for durability strengthens materially.
For investors wanting to translate the monitoring framework into concrete portfolio positioning, our comprehensive walkthrough of geopolitical portfolio construction covers strategic gold allocation targets from BlackRock and Vanguard, bond duration adjustments during conflict cycles, and the defence sector procurement pipeline created by NATO’s 2025 spending mandate, with a five-component resilience checklist designed to function before, during, and after geopolitical shocks.
The market’s immediate response was rational given the terms announced. A 14-point memorandum that addresses the Strait of Hormuz, sanctions, and frozen capital simultaneously removes enough tail risk to justify a broad repricing higher. The industrial sector’s 14% recovery from its March low, the safe-haven rotation, and the institutional shift back to a bullish posture all follow coherent logic.
The durability of that repricing, however, depends entirely on implementation evidence that does not yet exist. The two-track investor posture holds: benefit from genuine risk-premium compression in diversified cyclicals and industrials while remaining disciplined about momentum-driven, high-beta positions that have already run far on sentiment alone.
Friday’s signing and the 30-day maritime reopening window are the first two hard checkpoints. They will begin to reveal whether this is a durable structural shift or a 60-day reprieve.
Analysts characterise the memorandum as tentative, a framework that “pushes hard questions into this 60-day discussion period” rather than resolving them. The repricing is real; the confirmation is not.
This article is for informational purposes only and should not be considered financial advice. Investors should conduct their own research and consult with financial professionals before making investment decisions. Past performance does not guarantee future results. Financial projections are subject to market conditions and various risk factors.
The 14-point memorandum of understanding is a ceasefire agreement between the United States and Iran that includes a 60-day halt to fighting, reopening of the Strait of Hormuz within 30 days, suspension of petroleum-related sanctions, and release of approximately $12-24 billion in frozen Iranian capital, with hard structural questions deferred to a 60-day negotiation window.
The agreement sent crude oil to multi-month lows by pricing out worst-case supply disruption scenarios, drove the US industrial equity benchmark up approximately 2.1% to a record 1,519.18, and prompted at least one major investment bank to shift back to a bullish outlook within a single trading session.
Industrials and cyclicals benefit from shipping cost relief and lower fuel inputs, airlines and logistics operators gain from reduced jet fuel costs and fewer route detours, and rate-sensitive growth assets like technology and small caps benefit if lower energy prices soften inflation and reduce pressure on the Federal Reserve to maintain restrictive policy.
The primary risks include implementation failure during the 60-day negotiation window, a lag between futures repricing and physical oil supply normalisation through Hormuz, the Federal Reserve maintaining a hawkish posture despite lower energy prices, and sharp reversals in momentum-driven names that gained on sentiment alone without earnings revisions.
Investors should track verified vessel movements through the Strait of Hormuz, sustained oil price levels over several weeks, Federal Reserve communications on inflation forecasts, capital deployment patterns from unfrozen Iranian funds, formal signing confirmation scheduled for Friday, and progress on structural questions during the 60-day negotiation window.