
Every major economy that reported this week posted something to feel good about. That is exactly what makes the week so hard to read.
Between 7 and 11 September 2026, a concentrated run of economic releases arrived from the UK, the eurozone, Japan, and China. Together they offer an unusually clean snapshot of where the world’s largest economies sit against what markets expected of them. This was a comparative moment, not a headline one.
The temptation is to read the numbers and conclude that global economic growth looks broadly healthy. The more useful reading is that it looks different depending on where you stand, and that difference is the actual signal. Here is what the data actually shows about where global growth momentum is concentrated, and where it is not.
The UK’s manufacturing moment and what it reveals about recovery depth
UK factories delivered the upside surprise of the week. Manufacturing output rose 0.9% month-on-month in July 2026, and on an annual basis it climbed 2.6%, the fastest yearly rise since March 2024 and comfortably ahead of the consensus forecast of 2.0%.
+2.6% year-on-year, the fastest annual rise since March 2024, beating consensus forecasts of 2.0%.
The headline is genuinely strong. The detail is where the caution lives.
Two subsectors did most of the lifting. Manufacture of computer, electronic and optical products rose 5.2%, while basic pharmaceutical products and preparations added 3.4%. Across the sector, 8 of 13 subsectors recorded increases, so the gain had breadth. The magnitude, though, was concentrated in those two high-value areas.
That combination is what the data is telling you. The UK’s recovery now has real pockets of industrial strength rather than a purely services-led story. But two subsectors carrying the annual number is not yet enough to conclude that production has decisively turned. It is momentum with a narrow base, which is both more exciting and more fragile than the headline alone suggests.
UK GDP momentum drew immediate analyst attention, with Deutsche Bank quadrupling its Q3 2026 forecast from 0.1% to 0.4% quarter-on-quarter on 11 September 2026, a reaction that captures how much the July data shifted institutional expectations for the remainder of the year.
How manufacturing fits into the July GDP picture
Manufacturing sits inside a broader production container that grew more modestly. Total production output rose just 0.2% month-on-month in July and 0.6% year-on-year, still beating forecasts, but the manufacturing strength was partly offset by declines in mining and quarrying and in electricity and gas.
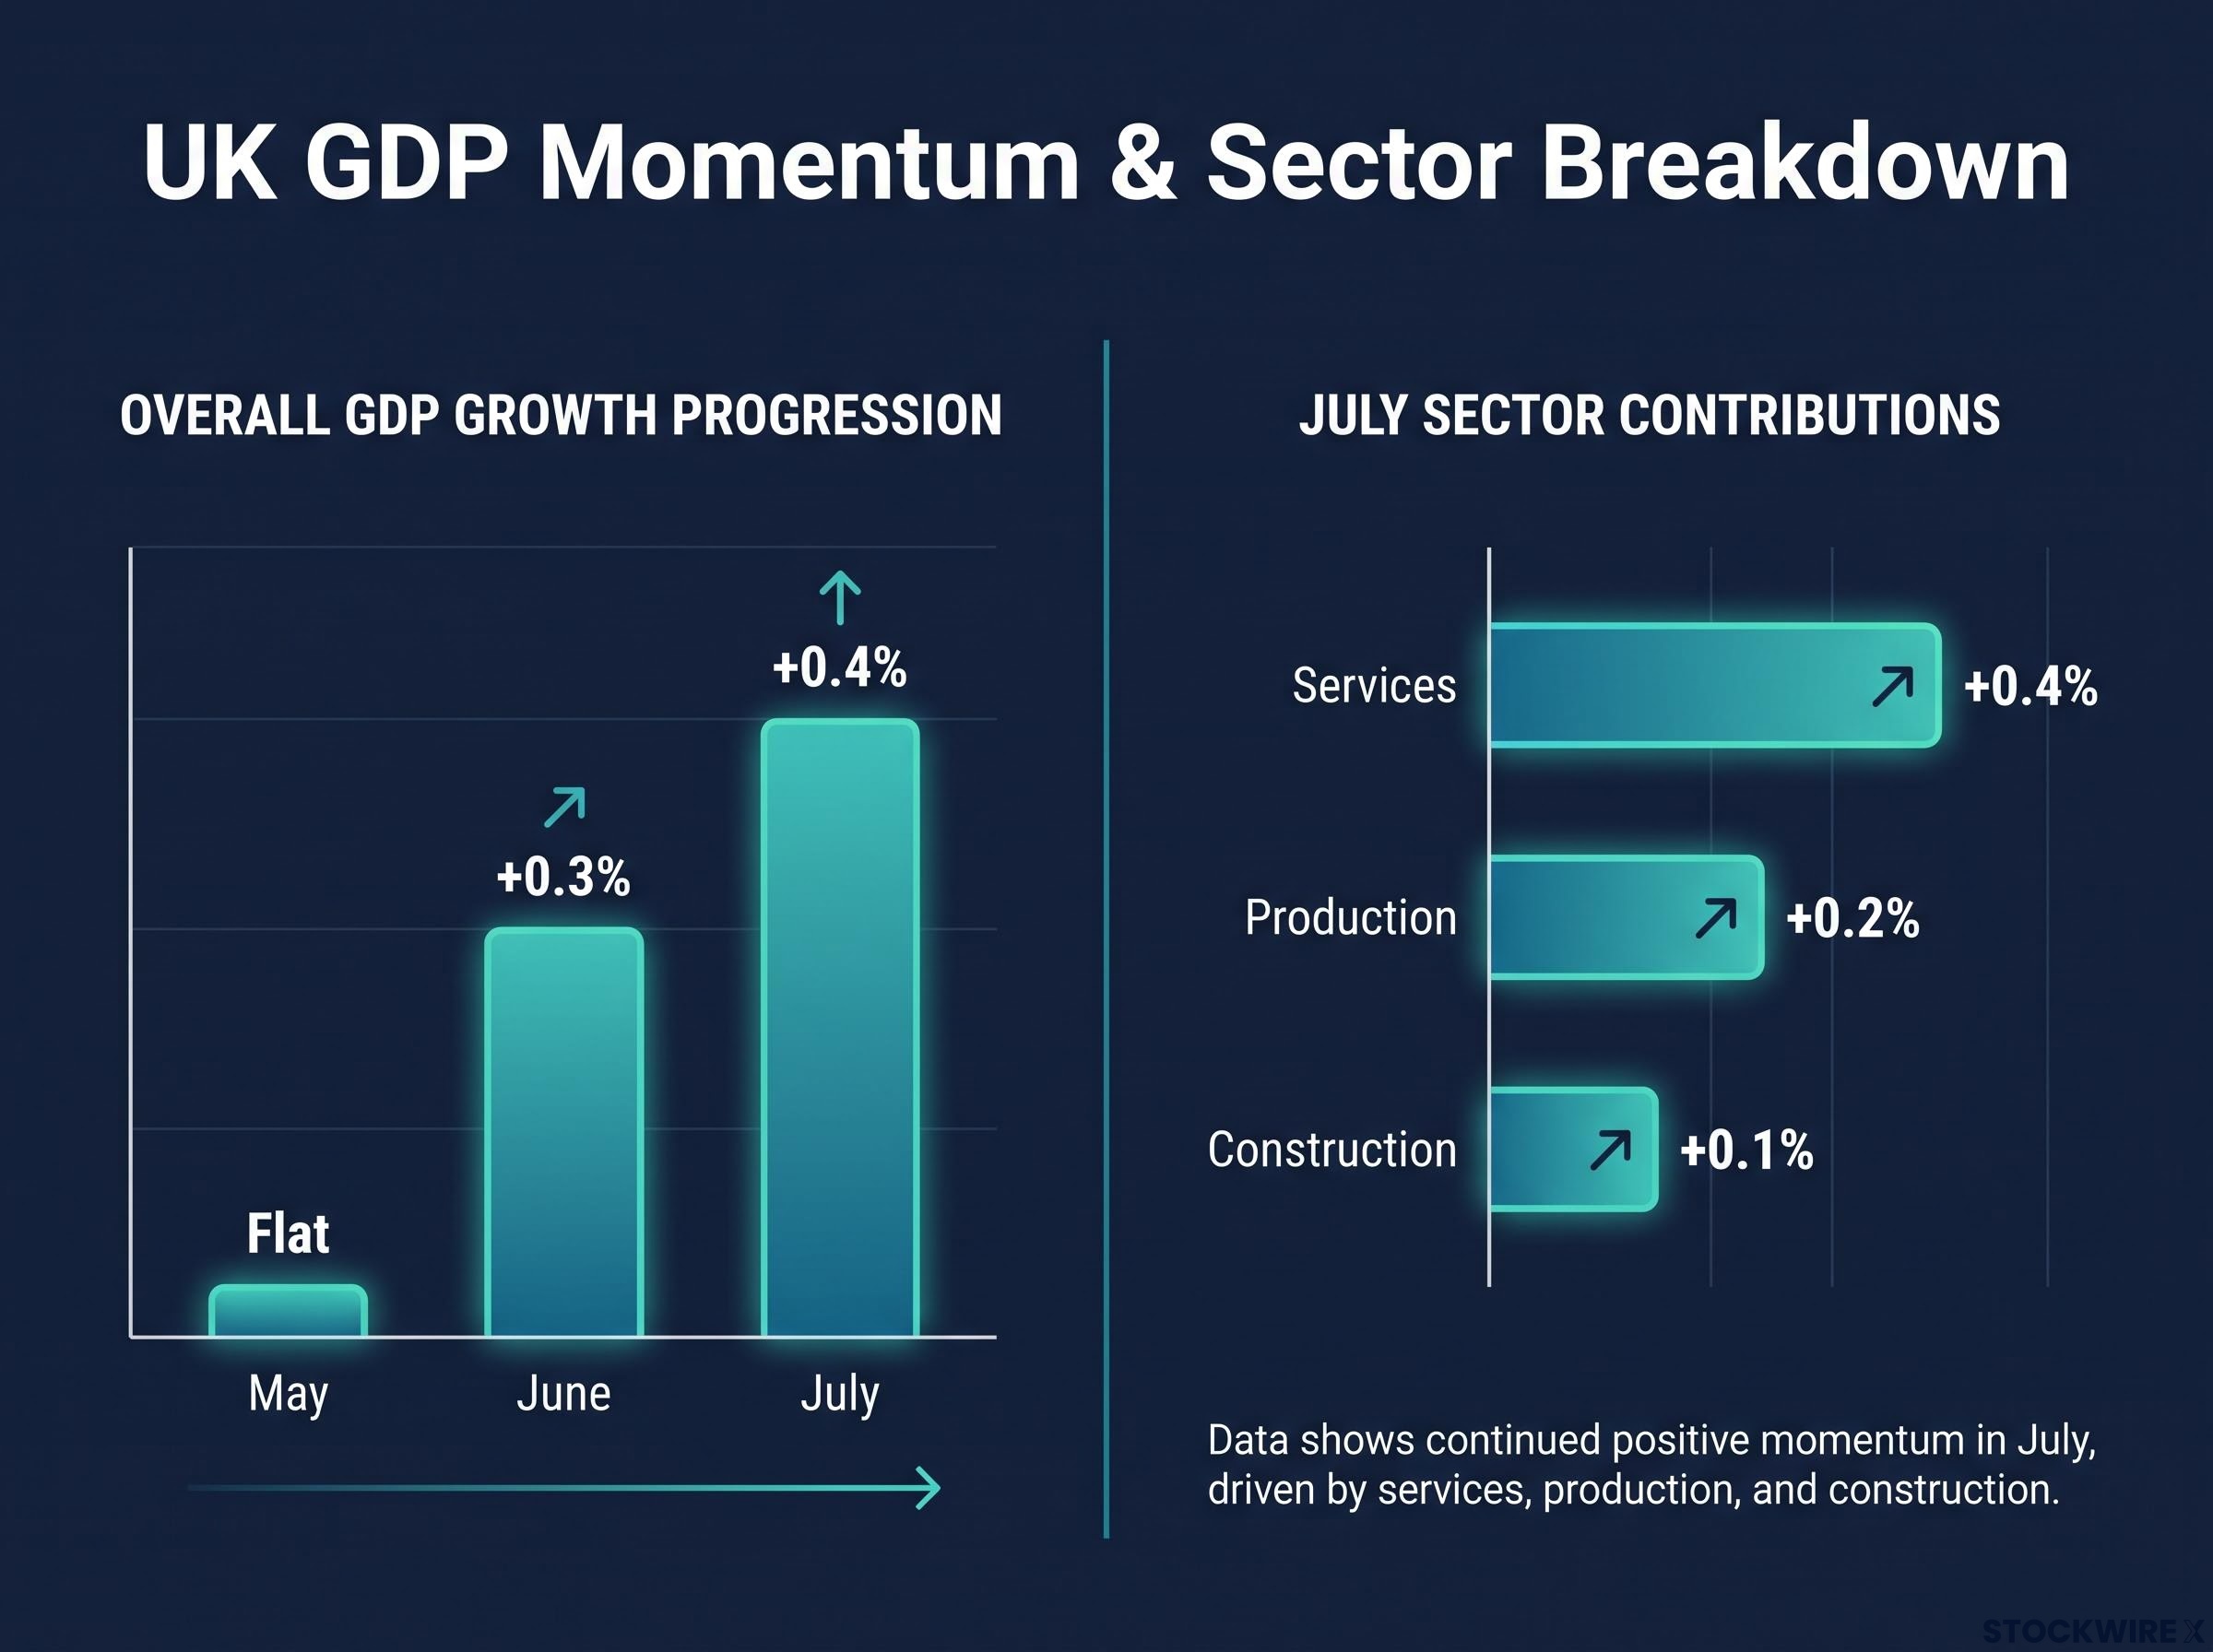
Step up to the whole economy and the picture holds. UK GDP grew 0.4% month-on-month in July and 1.6% year-on-year, with contributions across the three main sectors:
- Services: +0.4%
- Production: +0.2%
- Construction: +0.1%
The sequence matters more than any single month. GDP was flat in May, grew 0.3% in June, and reached 0.4% in July. That is a step-up in momentum building over three months, not a one-off spike. For anyone watching UK-exposed equities or sterling, a sustained production uptick would start to change the calculus on domestic cyclicals, which is why the narrowness of this particular gain is worth holding in mind.
The ONS monthly GDP estimate for July 2026 confirms the 0.4% monthly expansion and the sector-level contributions that underpin the three-month momentum sequence, with services, production, and construction each recording positive readings in the same period.
When big ASX news breaks, our subscribers know first
Europe’s double signal: upward GDP revision and another rate hike
The eurozone produced two signals in the same week that sit in deliberate tension. Growth was stronger than earlier data had shown, and the central bank responded by tightening further.
Start with the growth. The third estimate of eurozone Q2 2026 GDP came in at 0.6% quarter-on-quarter and 1.2% year-on-year, a clear upgrade from the initial read of 0.4% and 1.0%.
Eurozone Q2 2026 GDP revised up to 0.6% quarter-on-quarter and 1.2% year-on-year, from initial estimates of 0.4% and 1.0% respectively.
A revision of that size is not a rounding adjustment. It signals underlying momentum that the earlier data simply had not captured yet.
Then came policy. On 10 September 2026, the ECB Governing Council raised all three key interest rates by 25 basis points, effective 16 September 2026. Here is where the new structure landed:
| ECB rate | Previous level | New level | Effective date |
|---|---|---|---|
| Main refinancing operations | 2.40% | 2.65% | 16 September 2026 |
| Deposit facility | 2.25% | 2.50% | 16 September 2026 |
| Marginal lending facility | 2.65% | 2.90% | 16 September 2026 |
This was the second hike of 2026, following a move in June and a pause in July. The sequencing matters. A central bank that pauses and then resumes tightening is not reacting to weakness. It is pressing an advantage.
What that tells you is that the ECB is operating from a position of relative confidence in eurozone growth. The open question, and it is a genuine one, is how much further it can tighten before higher rates start to cool the very growth it is responding to. No accessible analyst commentary addressing the sustainability of hikes at 2.65% was available in sources dated on or before 14 September 2026, so that risk sits honestly as a known unknown.
For global equity investors, this pairing of stronger-than-expected growth alongside tighter policy is precisely the condition under which European financials and domestic cyclicals tend to attract renewed attention.
Markets are currently pricing close to 40 additional basis points of tightening before year-end, with BBVA Research forecasting a December ECB move to 2.75%, a projection that would push the deposit facility rate to its highest level in the current cycle and intensify the growth-versus-policy tension the ECB’s September decision opened.
What global trade signals look like when the headline beats but the detail misses
Asia produced the week’s most interesting analytical puzzle: positive absolute numbers that still disappointed. China’s trade data is the primary case.
Chinese imports rose 28.2% year-on-year in August 2026 and exports climbed 25.0%. Both are strong double-digit prints. Both also came in below what analysts had forecast.
Both Chinese imports and exports grew at double-digit rates year-on-year in August, yet both missed analyst forecasts.
That gap between the absolute strength and the expectation miss is the part worth thinking about. When a number grows a quarter year-on-year and still falls short, the shortfall is a statement about what the market had priced in.
Domestic demand does not obviously explain it either. China’s consumer price inflation reached 0.8% year-on-year in August, an acceleration on an annual basis but hardly a surge. Prices are moving; they are not running hot.
China’s domestic demand picture tells a more complicated story than the trade headline: DBS Group Research projects August retail sales at just 0.4% year-on-year against industrial production of 5.0%, a spread that helps explain why strong export growth co-exists with modest consumer inflation and persistent expectation misses.
Japan reinforces the same pattern from Asia’s other major economy. Japanese bank lending expanded 5.4% year-on-year in August, again positive but below market expectations. Here are the four Asia data points side by side:
- China imports: +28.2% year-on-year, below consensus
- China exports: +25.0% year-on-year, below market forecasts
- China CPI: +0.8% year-on-year, accelerating
- Japan bank lending: +5.4% year-on-year, below expectations
One caveat for transparency: independent verification of China’s August 2026 trade and CPI figures was not available through web research, and those numbers are sourced from FactSet.
What the pattern tells you is that market pricing had assumed a stronger rebound from the region than the data delivered. A double miss across China’s trade and Japan’s lending is more significant than either alone, because it raises a real question about whether Asian growth is genuinely accelerating or whether expectations have simply run ahead of it.
Japan’s revised growth and why GDP revisions matter more than they seem
Japan’s other release this week was a quieter but instructive one. Its second estimate of Q2 2026 GDP came in at 0.4% quarter-on-quarter and 0.9% year-on-year, up from the first estimate of 0.3% and 0.7%.
That upgrade is a useful anchor for understanding something many readers overlook: why GDP is published in multiple rounds at all, and why the first number is rarely the final word.
Why GDP estimates are published in rounds, and what changes between them
Initial GDP estimates are built on partial data. Statisticians do not have complete figures for trade, business investment, or services at the point of the first release, so they estimate. Later rounds fold in more complete administrative and survey data, which is why the number moves.
The direction of the move is not predictable. Revisions run upward and downward with roughly equal ease, depending on what the fuller data reveals. That is exactly why treating a first estimate as the definitive figure is a risky analytical habit.
This week made the point twice. Both Japan and the eurozone were revised upward in the same window:
| Economy | Initial estimate | Revised estimate | Direction |
|---|---|---|---|
| Japan (q/q) | +0.3% | +0.4% | Upward |
| Japan (y/y) | +0.7% | +0.9% | Upward |
| Eurozone (q/q) | +0.4% | +0.6% | Upward |
| Eurozone (y/y) | +1.0% | +1.2% | Upward |
Two upward revisions in a single week is worth sitting with. It tells you the global growth picture entering Q4 2026 may be modestly stronger than the first data flow suggested. When Q3 estimates begin arriving, that is a reason to treat the initial prints as provisional rather than final, and to expect the real reading to sharpen over subsequent rounds.
What this week’s data actually tells you about where global growth stands in September 2026
Pull the four stories together and a two-cluster picture emerges. It is not consensus, and forcing one would misread the week.
- Outperforming expectations: the UK, where manufacturing rose 2.6% year-on-year and beat consensus, and the eurozone, where GDP was revised up to 1.2% year-on-year.
- Positive but below forecast: China, where trade grew double digits yet missed, and Japan, where bank lending rose 5.4% but fell short.
Europe beat. Asia grew but disappointed. That is the shape of the week.
The China-Europe growth divergence that this week’s data reinforces has a precedent in the July 2026 reporting window, when China’s manufacturing and services PMIs both fell below the 50-point contraction threshold simultaneously while the eurozone posted a Q2 GDP beat, suggesting the split visible in September is not a one-week anomaly.
The ECB’s move to 2.65% is the one policy action worth carrying forward. It reads as a product of European confidence and as a future variable in equal measure: continued tightening will test the eurozone’s growth resilience in ways only Q4 data can reveal.
The Europe-versus-Asia split is not yet a trend. One week cannot confirm a global growth theme. But the divergence was consistent across both regions, which gives you a concrete frame to hold as Q3 2026 data arrives over the next six to eight weeks. Three variables are worth watching: whether the UK manufacturing uptick broadens beyond its two lead subsectors, whether Asia’s expectation gap narrows or widens, and whether the ECB’s tightening begins to show up in eurozone growth figures.
This article is for informational purposes only and should not be considered financial advice. Investors should conduct their own research and consult with financial professionals before making investment decisions. Past performance does not guarantee future results, and economic data is subject to revision.