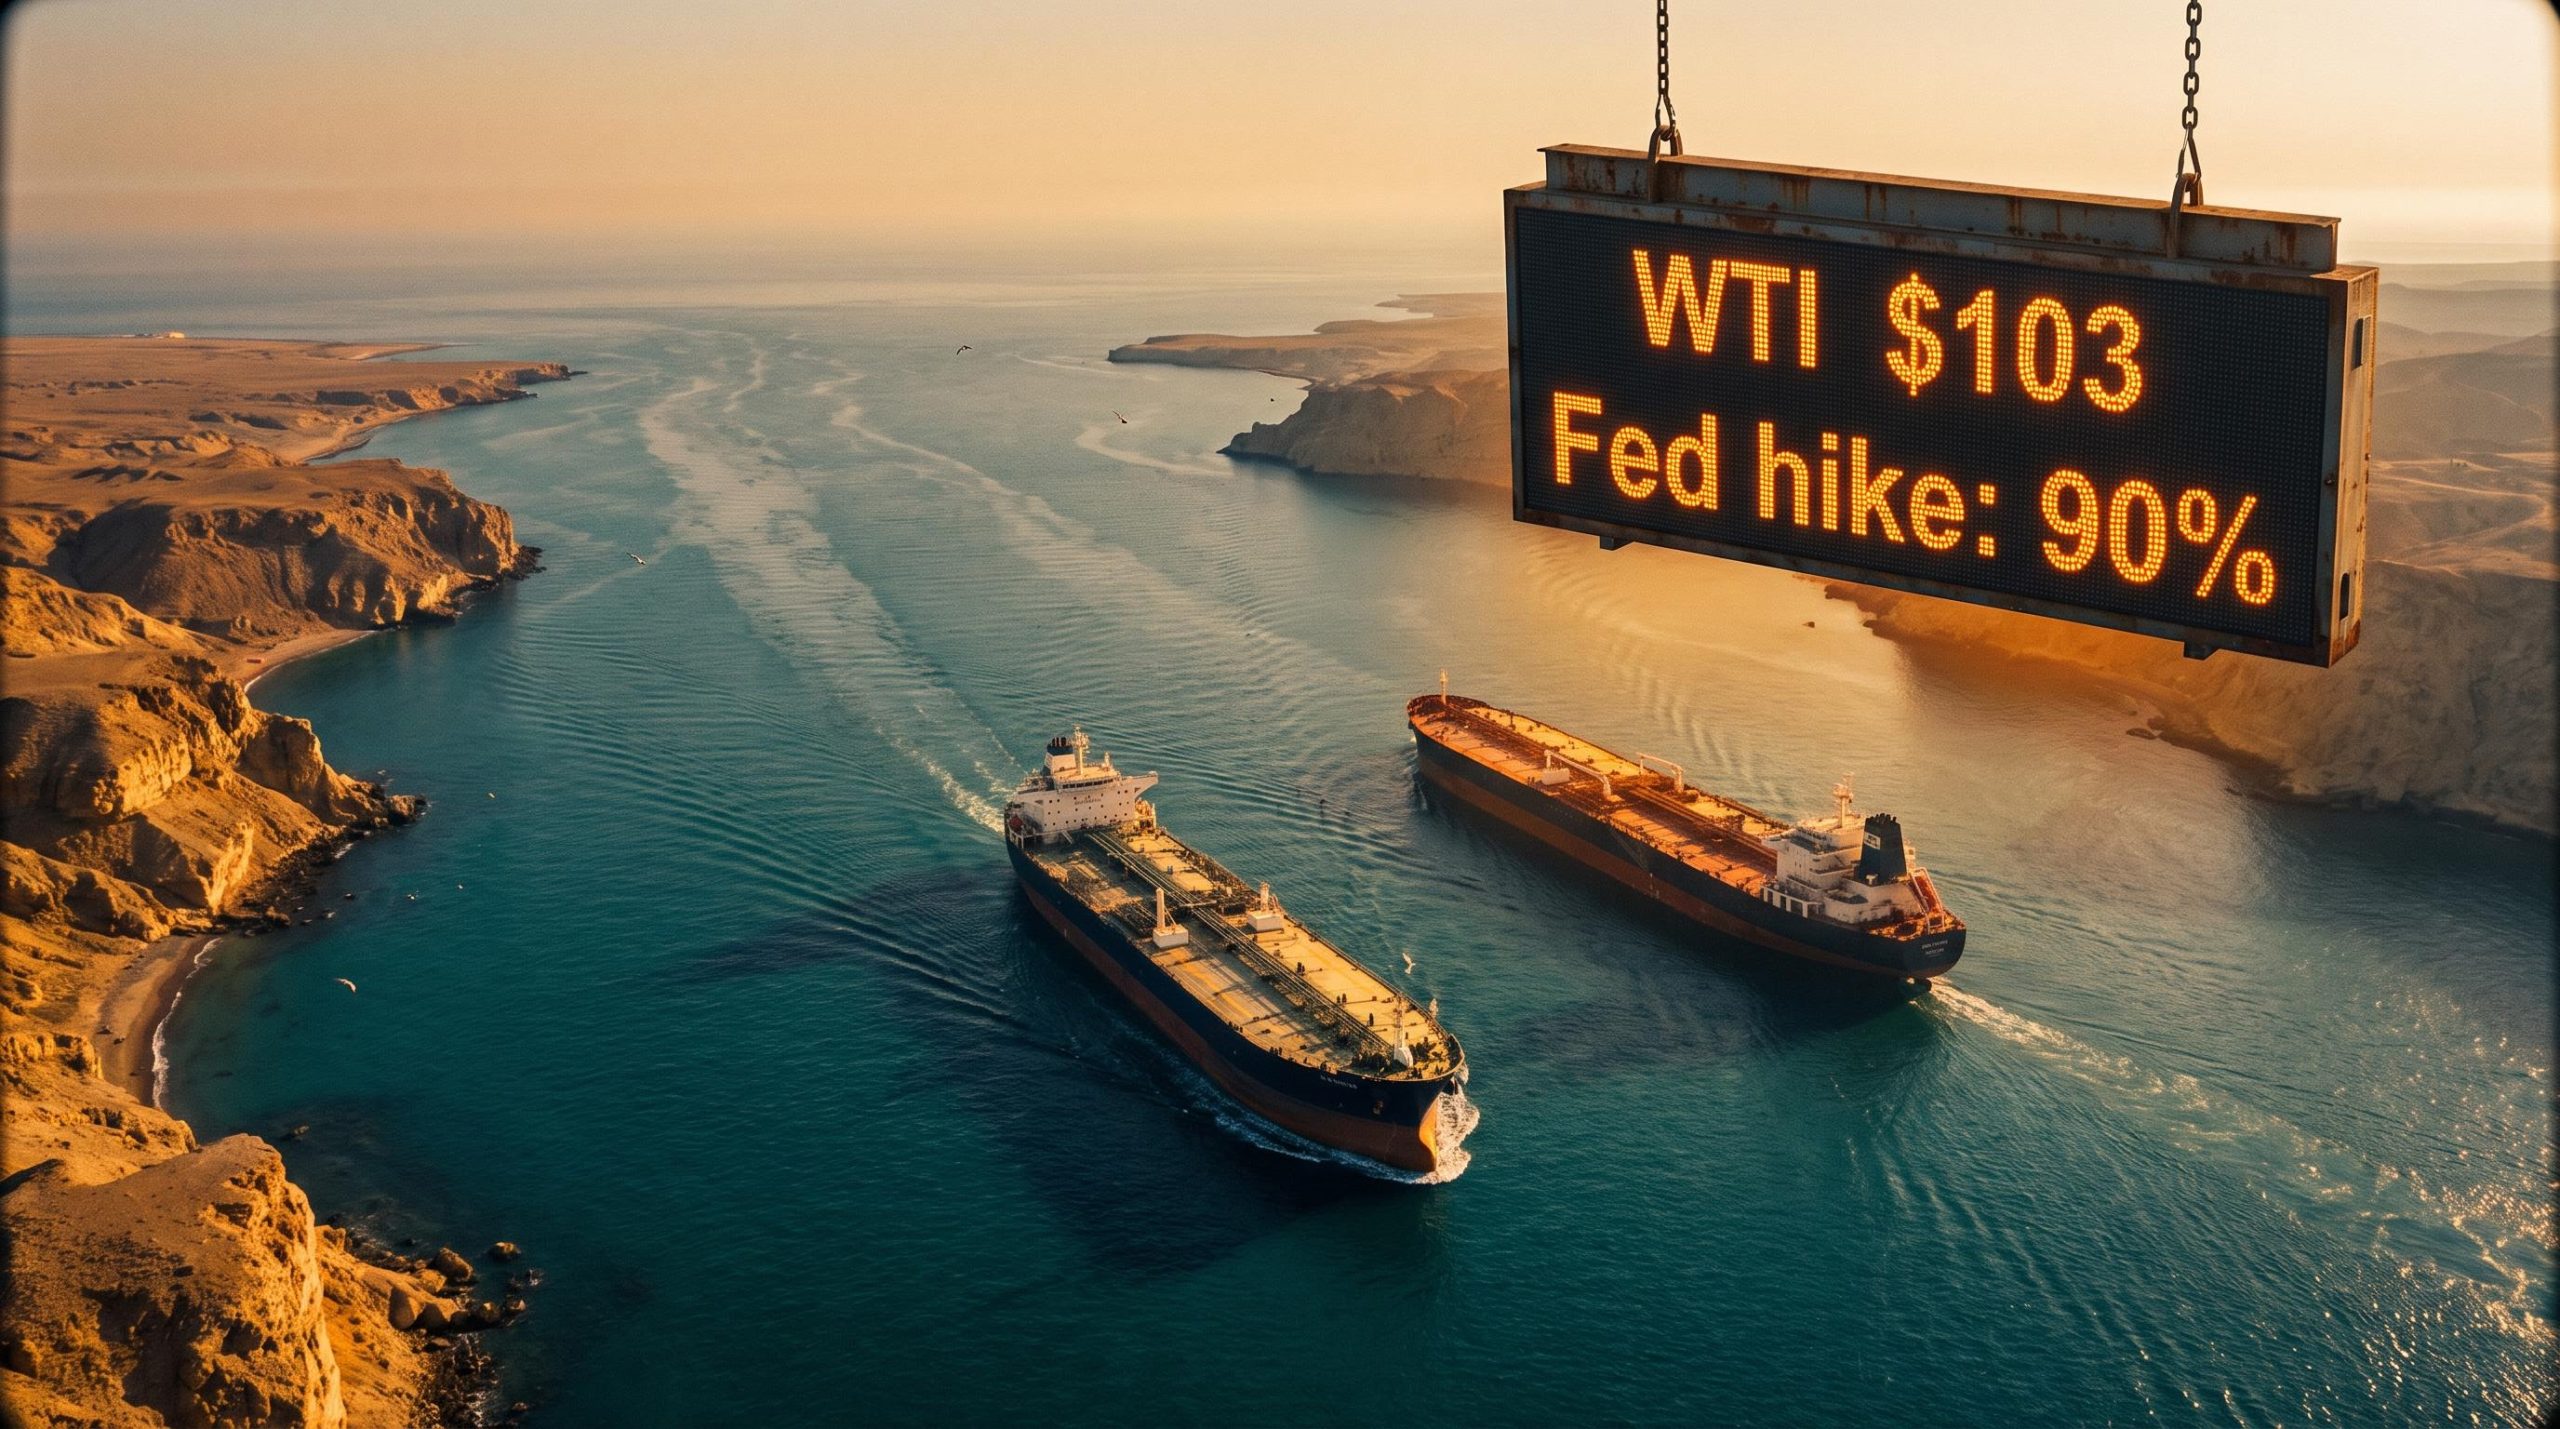
Most investors watch central banks to work out where oil is going. Right now that logic runs backwards. In mid-September 2026, markets are pricing a roughly 90% probability of a US Federal Reserve rate hike, and the trigger is not the labour market or core services inflation. It is the fact that WTI crude has crossed $103 a barrel.
That single data point reorders the usual assumption. Oil is not following monetary policy this cycle. It is setting it.
With WTI near $103 and Brent near $108, the pressure is spreading well beyond energy. It is dragging rate expectations higher across every major economy, pushing the Japanese yen toward the 154-155 level against the US dollar, and driving the 10-year US Treasury yield toward 5%. These are not three separate stories. They are one connected chain.
This piece maps that transmission chain end to end, so you can judge which pressure point is most likely to snap first, and which signal actually tells you when it does.
Why oil is running this tightening cycle, not following it
Start with what the market is pricing, and let the pattern make the argument. Traders are assigning a roughly 90% probability to a Fed hike at the upcoming FOMC meeting. That is not a reaction to shifting employment data. It moved in step with crude pushing above $100.
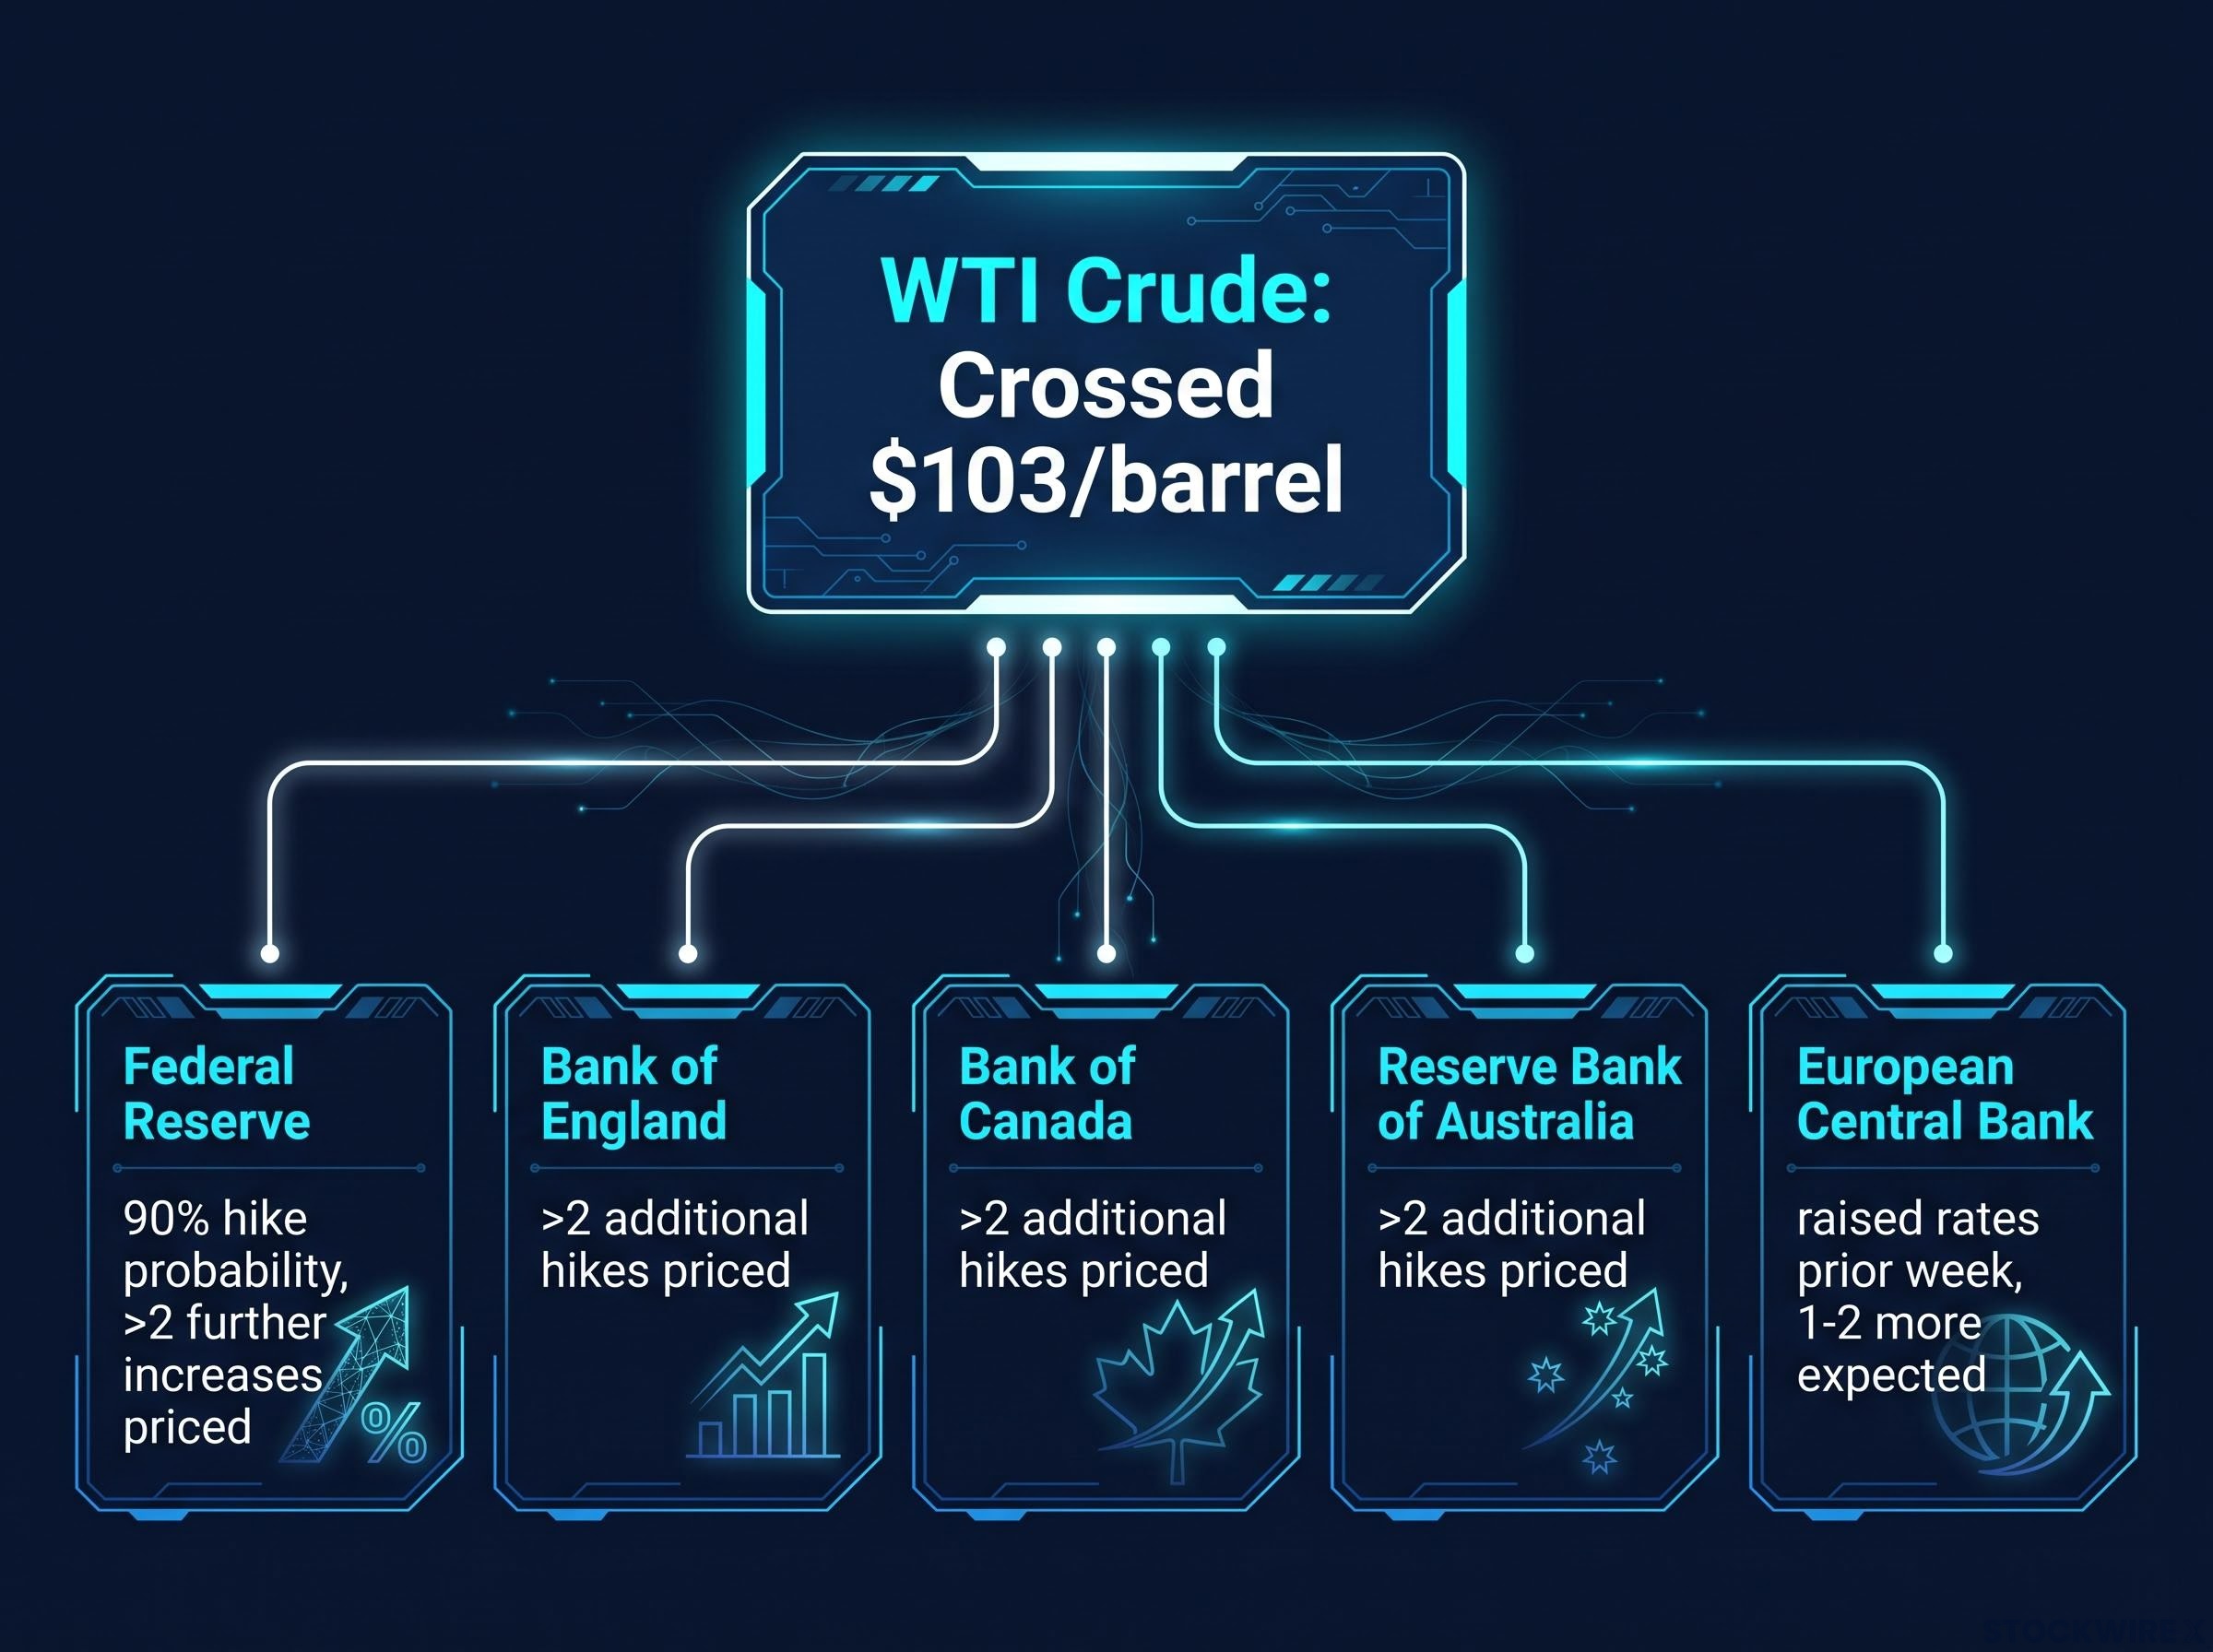
The synchronisation extends across the developed world. Rate futures now carry more than two additional hikes for several major central banks at once.
Goldman Sachs estimates roughly $14 per barrel of the current crude price is a geopolitical risk premium disconnected from underlying supply and demand fundamentals, which means the entire triple-digit price level can collapse within 24 hours of a credible de-escalation signal, a collapse that would immediately reverse the rate hike pricing driving policy globally.
- Federal Reserve: roughly 90% probability of a hike at the upcoming meeting, with more than two further increases priced.
- Bank of England: more than two additional hikes priced.
- Bank of Canada: more than two additional hikes priced.
- Reserve Bank of Australia: more than two additional hikes priced.
- European Central Bank: raised rates the prior week, with one to two more hikes expected before year-end.
When five central banks tighten in lockstep and the common variable is the oil price rather than any shared domestic condition, the direction of causality becomes clear. Energy is the forcing function. Policy is the response.
Christine Lagarde, President of the European Central Bank, gave the institutional confirmation of this mechanism when she warned that sustained high oil prices raise the risk of second-round inflationary effects, where an initial energy price shock feeds through into wider wages and prices.
The ECB monetary policy statement from September 10, 2026 formally identifies the Middle East conflict as a direct input to the inflation outlook, citing elevated energy prices and the risk of second-round effects on wages and broader prices as factors shaping the rate path.
Extended elevated oil prices increase the risk of second-round inflationary effects, according to ECB President Christine Lagarde.
The historical echoes are the oil shocks of 1973-1974 and 1979-1980, when energy spikes forced central banks into aggressive tightening. The difference now is that today’s central banks carry stronger anti-inflation mandates and have moved more decisively to stop expectations becoming entrenched.
What this tells you is that standard policy tools are operating in reactive mode. The path of rates from here depends more on what happens in the Strait of Hormuz than on anything said at the next FOMC press conference.
When big ASX news breaks, our subscribers know first
Two chokepoints, one supply crisis: the geopolitical mechanics driving the price
The supply story is a sequence of tightening constraints, and it helps to walk the geography in order. Iran holds direct influence over tanker traffic through the Strait of Hormuz, the narrow passage that carries a large share of the world’s seaborne crude. Shuttle transfers of oil were reportedly only permitted while Iran remained in active negotiations with Oman.
Those negotiations have stalled. A cancelled meeting signals that the tanker shuttle transfers keeping some crude moving may now be curtailed.
Then came the second front. Houthi forces entered the conflict in August 2026, handing Iran effective simultaneous leverage over both the Strait of Hormuz and the Red Sea. Vessel traffic through both the Strait of Hormuz and the Bab el-Mandeb Strait remains significantly depressed.
The forward market has taken note. Prediction market traders on Kalshi are pricing meaningful odds of further escalation into year-end.
Kalshi traders are pricing a 46% probability that WTI exceeds $115 by year-end, and a 35% probability it exceeds $120.
The Bab el-Mandeb escalation and the end of the Saudi bypass option
Here is where the risk calculus changes. The standard workaround for a Hormuz disruption is Saudi Arabia’s East-West pipeline network, which moves crude across the country to Red Sea export hubs, bypassing the Gulf chokepoint entirely.
Houthi attacks have targeted exactly that infrastructure, striking the East-West pipelines and Red Sea export terminals designed as the fallback. That leaves Saudi export capacity far more exposed than in previous conflict scenarios.
The market no longer has a credible Plan B for a Hormuz disruption. That is what separates this episode from earlier geopolitical oil scares, where a bypass route always existed.
Analysts have set out what normalisation would require: de-escalation in the Iran conflict, an end to the Houthi maritime blockade, the securing of Saudi pipelines, and the rebuilding of global inventory buffers. For you as a reader tracking price direction, the takeaway is that relief now demands diplomatic progress on at least two separate fronts, not one.
Why oil at $100 hits Japan harder than almost anywhere else
Japan carries a structural vulnerability that turns an oil shock into something far larger. As a major oil importer with minimal domestic production, its import bill rises mechanically with every dollar crude climbs. Those rising costs deteriorate the trade balance, which pushes directly down on the yen.
The government has made the squeeze worse. Japan instructed refiners to stop releasing strategic reserves through September and October, which forced those same refiners into the spot market to cover demand, tightening global supply further.
The yen has felt it, trading around 154-155 against the US dollar in mid-September 2026. And this is where a currency problem becomes a bond market problem.
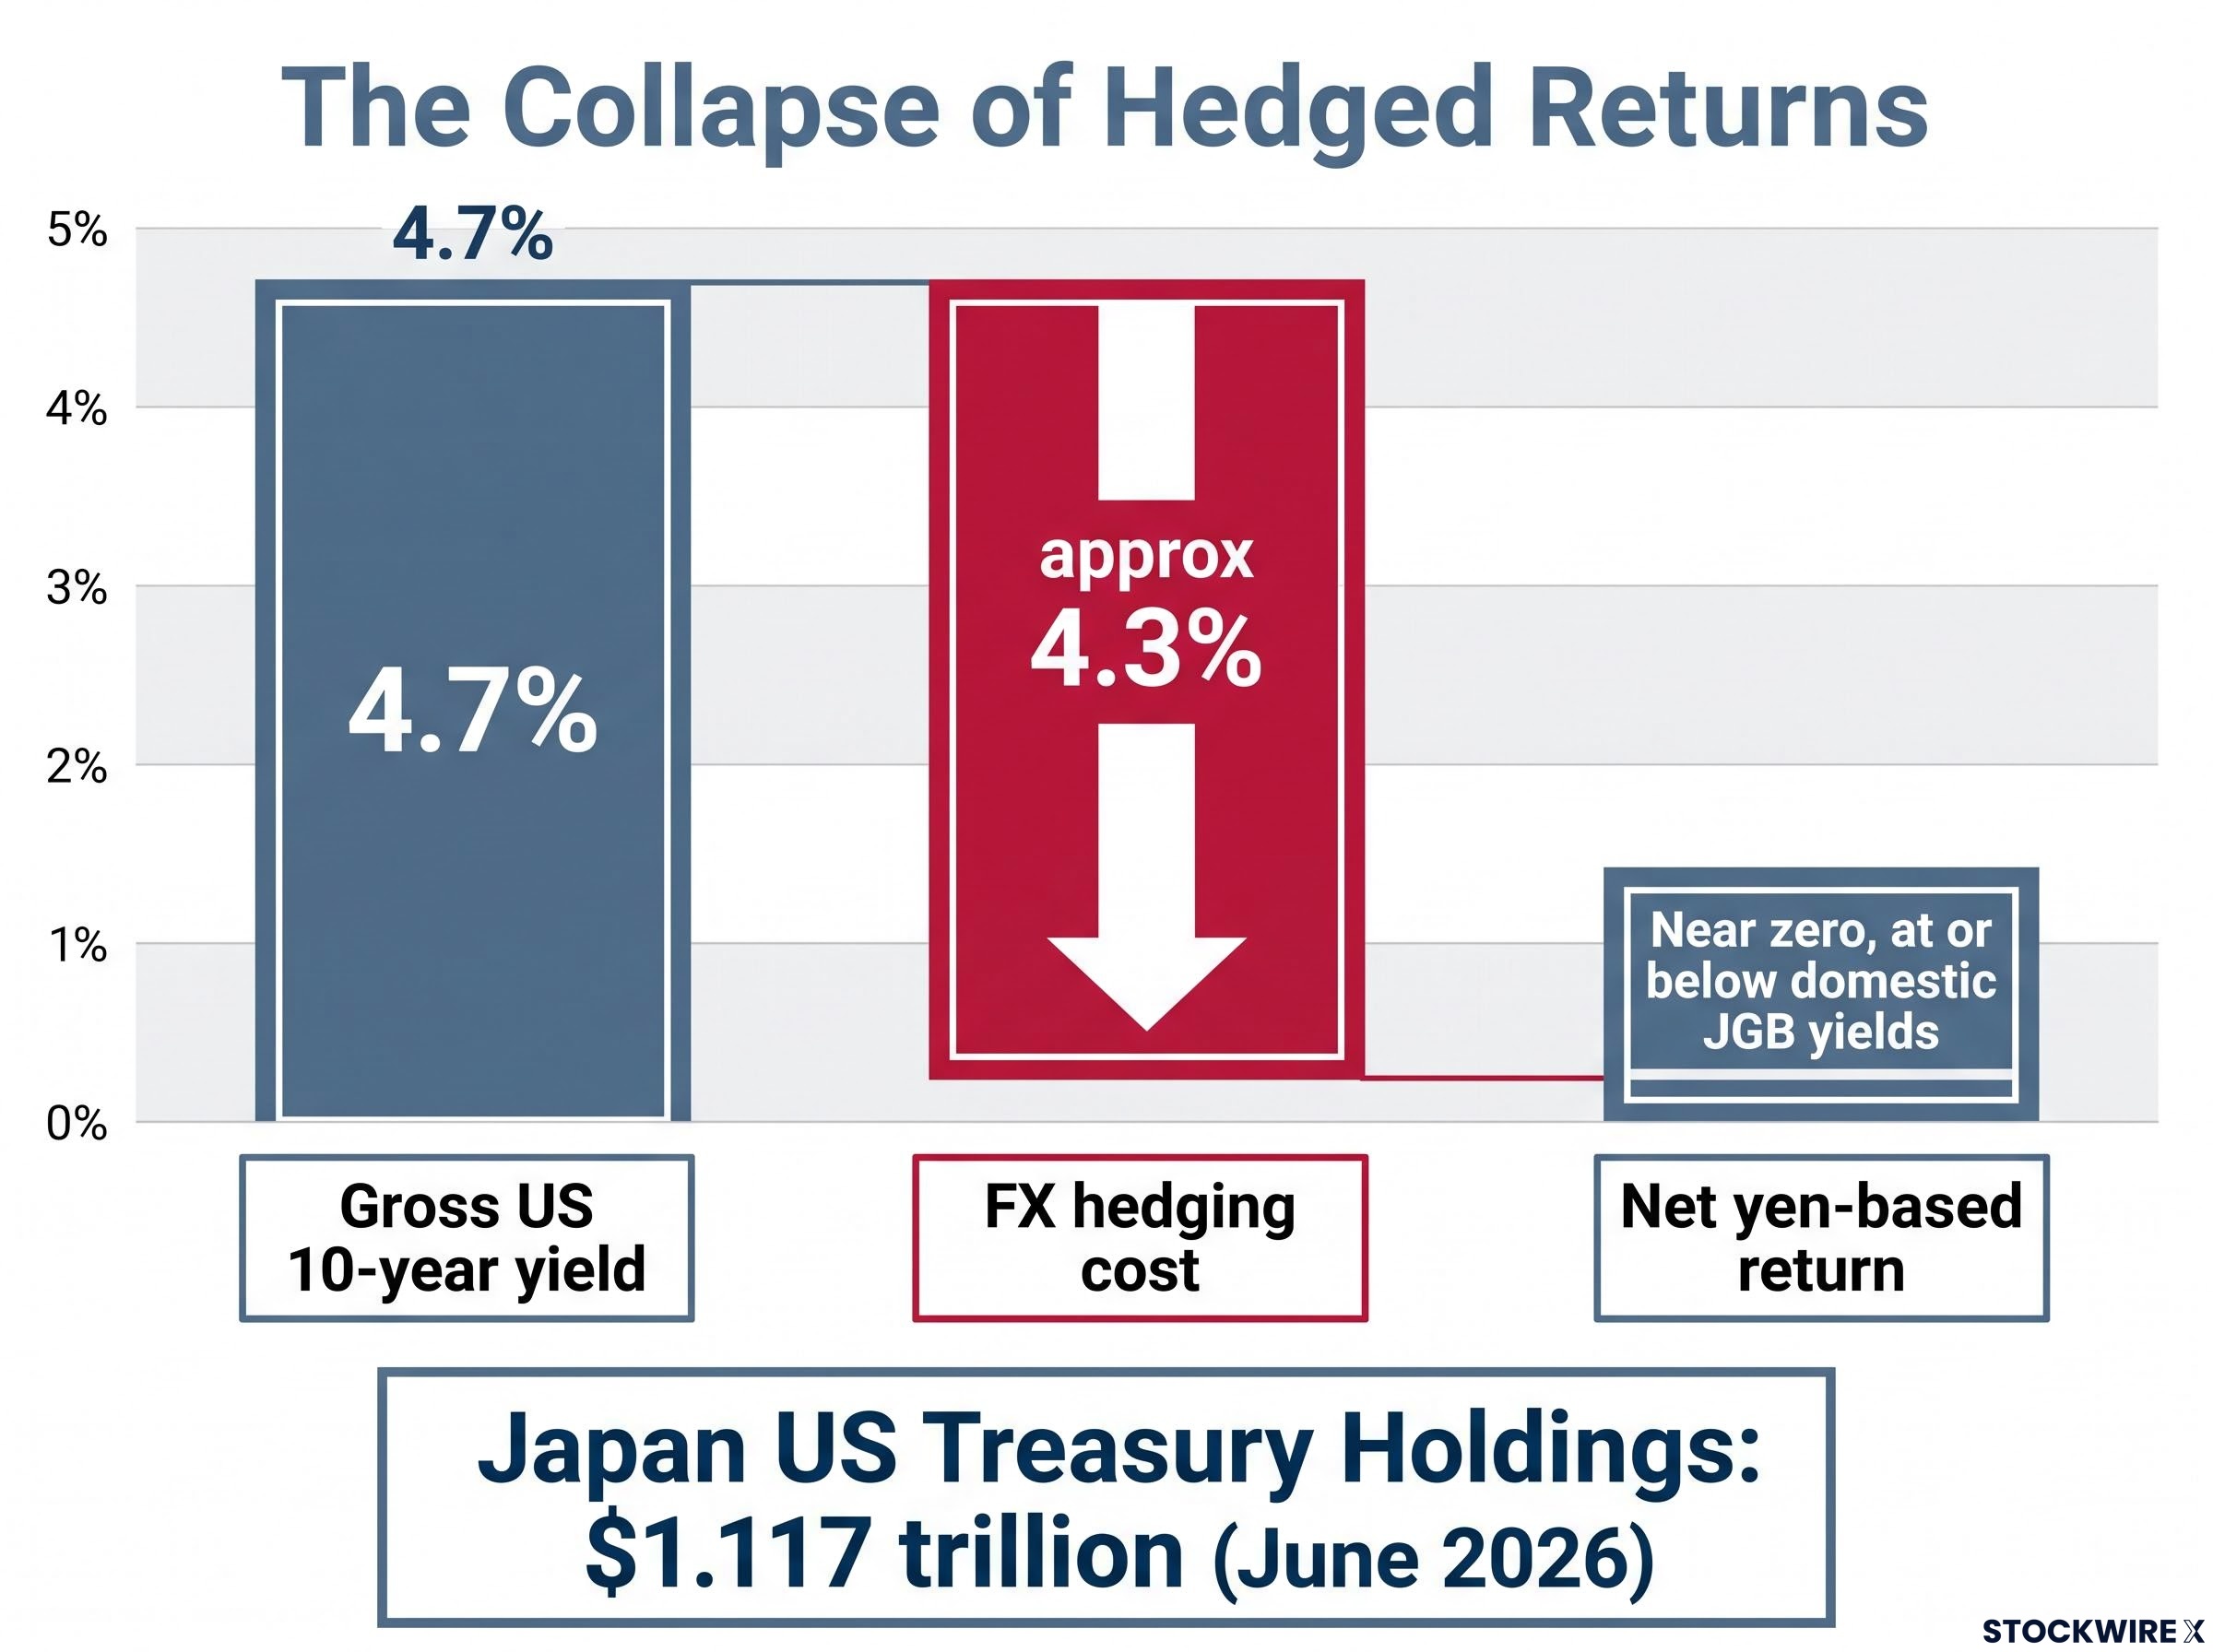
Japan is the largest foreign holder of US Treasuries, with roughly $1.117 trillion as of June 2026. The economics of holding those bonds have quietly collapsed for Japanese institutions, because of the cost of hedging the currency risk.
| Gross US 10-year yield | FX hedging cost for Japanese holders | Net yen-based return |
|---|---|---|
| 4.7% | approximately 4.3% | near zero, at or below domestic JGB yields |
An FX hedging cost is what a Japanese investor pays to protect a dollar-denominated bond against currency swings. At 4.3% against a 4.7% yield, that cost swallows almost the entire return, leaving a hedged US Treasury yielding no more than a Japanese government bond at home.
The transmission chain runs like this:
- Oil prices rise, lifting Japan’s import bill.
- The yen depreciates as the trade balance worsens.
- FX hedging costs climb alongside the currency stress.
- Those costs erode the net yield on hedged US Treasuries to near zero.
- The economic case to bring capital home, repatriation, strengthens.
Meanwhile the 10-year US Treasury yield has touched near 4.95-5.00% in mid-September 2026. What this tells you is that the repatriation pressure is structural, not a policy choice. When a hedged Treasury yields no more than a domestic bond, the case to sell it holds regardless of any government instruction.
The yen carry trade unwind adds a second structural layer beneath the hedging cost argument: with the Bank of Japan’s policy rate at a 31-year high of 1.0% and 10-year JGB yields briefly crossing 3.0% in early September 2026, the rate differential that made it rational to borrow cheaply in yen and buy US Treasuries has narrowed by more than 100 basis points over two years.
The Treasury feedback loop: how yen weakness becomes a US bond market problem
Scale up that repatriation incentive and you get a feedback loop with teeth. When Japanese institutions bring capital home, they sell US Treasuries and buy Japanese government bonds. That selling pushes the 10-year US yield higher, at the exact moment the US Treasury is already managing heavy debt issuance.
Now narrow to the specific position. Japan’s $1.117 trillion holding is not a marginal player. It is the largest foreign bid in the market, and its incentive to step back is growing.
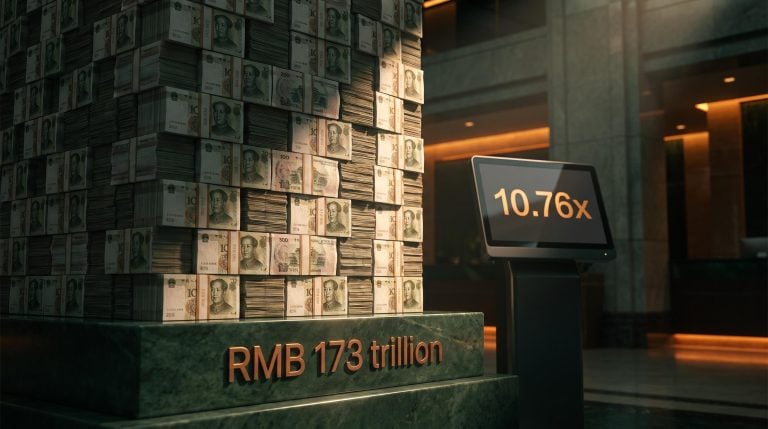
China compounds the problem rather than sitting beside it. Its Treasury holdings fell to $633.4 billion by June 2026, down more than 10-14% since early 2025 and roughly half its 2013 peak. The pace of selling accelerated over the three months into mid-September 2026.
| Holder | Treasury holdings (June 2026) | Direction of change |
|---|---|---|
| Japan | $1.117 trillion | Growing incentive to reduce as hedged returns collapse |
| China | $633.4 billion | Sustained selling, pace accelerating |
| Domestic and other private demand | Must absorb the gap | Increasingly relied upon to fund issuance |
The two largest foreign holders of US government debt are pulling back at the same time. That is the structural story beneath the yield move.
It is worth being precise about what is documented and what is not. The original reporting suggested the Japanese government had directed pension funds to consider selling Treasuries; subsequent checks of major outlets found no explicit publicly documented mandate, with any shifts described as slow-moving and within existing deviation bands. The stronger case rests on economics, not directive: the hedged return has simply evaporated.
GPIF reallocation toward domestic assets, signalled by Japan’s Finance Minister on 10 July 2026, introduced an institutional dimension to the repatriation story that operates alongside the hedging cost economics: even a 5-10 percentage-point portfolio shift by a fund approaching $2 trillion implies tens of billions in Treasury outflows spread across multiple years.
Large-scale Japanese Treasury selling would accelerate yield increases and complicate the US Treasury’s ability to stabilise the long end of the curve, according to investor Scott Bessent, a concern he raised before yields had reached 5%.
Here is the part that should reframe your thinking. The 10-year yield has reached near 5% before Japan has made any large-scale selling move. That tells you the current pressure is coming purely from the structural erosion of the hedged return, which means the headroom for further yield increases, if genuine repatriation begins, is significant.
For anyone holding long-duration assets or tracking sovereign debt, the real question shifts. It stops being “will the Fed cut?” and becomes “who buys the next auction?”
What breaks the feedback loop, and what the market says it will take
Resolution is best treated as a checklist, not a forecast. Analysts have named four conditions for supply to normalise, and the order in which they would need to begin matters:
- De-escalation in the Iran conflict, to restore reliable transit through the Strait of Hormuz.
- An end to the Houthi maritime blockade, to reopen the Bab el-Mandeb Strait.
- The securing of Saudi East-West pipelines, to restore the bypass route.
- The rebuilding of global inventory buffers, to replace the depleted safety margin.
These are simultaneous requirements, not sequential steps. Partial progress on one without the others is unlikely to relieve price pressure at current levels in any material way.
The inventory buffer is the tightest constraint of all. Governments have little firepower left to smooth a spike:
Strategic reserve limitations have been central to this crisis since its earliest phase, with IEA data from Q2 2026 showing global inventories drawing at more than double any previously recorded pace, while emergency SPR releases of approximately 280 million barrels failed to halt the drawdown, a dynamic that explains why the inventory buffer is now the tightest constraint on any resolution timeline.
- US strategic reserves sit near 280-285 million barrels, close to their estimated operational floor of 150-200 million barrels.
- Asian government reserves are strained, with governments reportedly reluctant to keep releasing them.
- Japan’s halt on refiner reserve releases has already pushed those refiners into the spot market as the marginal buyer.
Demand offers little relief either. China’s August 2026 crude imports came in at roughly 37.93 million tonnes, about 7.14 million barrels per day, up 6.2% month on month but still around 40% below pre-Iran-war levels. Demand is recovering, not collapsing, which keeps a floor under prices.
So what actually breaks the cycle? The original source estimates the trigger sits in equity markets rather than diplomacy.
A decline of approximately 10% in US equity markets is estimated as the level likely to prompt a US policy reversal, which would in turn ease oil price pressure.
The variables worth tracking are two diplomatic fronts, one military resolution, and one inventory timeline. Monitoring those tells you more about where oil goes next than any single FOMC statement will.
The variable that changes everything and the one that probably does not
Separating signal from noise here is the whole game. The market will be tempted to read a central bank pause or cut as resolution. It is not. A pause addresses the symptom, higher rates, while leaving the supply constraint driving oil entirely untouched.
The variable that genuinely resets the dynamic is a diplomatic breakthrough on either the Strait of Hormuz or the Bab el-Mandeb situation. That is the input that actually loosens supply. Everything else is second-order.
Pull the three dynamics together. Oil at $103 is the policy forcing function, driving the 90% Fed hike probability. Japan, with the yen at 154-155 and $1.117 trillion in Treasuries, is the transmission mechanism carrying the shock into sovereign bond markets. China’s steady liquidation, down to $633.4 billion, is the structural backdrop that leaves the near-5% 10-year yield uniquely exposed.
One domestic catalyst could interrupt the loop without any diplomatic resolution: a roughly 10% equity market decline, the level estimated to force a US policy reversal. And a useful cross-check that the burden is landing across Asia, not just Japan, is the pressure on the Indian rupee and India’s underperforming stock market this year.
The leading indicators worth watching:
- Strait of Hormuz tanker traffic volumes.
- Bab el-Mandeb Houthi activity.
- The USD/JPY exchange rate.
- 10-year US Treasury auction demand metrics.
If you take one thing from this, take this: in the current environment, the stability of the US Treasury market depends more on events in the Strait of Hormuz than on anything in Washington. That is a different risk framework than most fixed-income investors were operating with six months ago.
This article is for informational purposes only and should not be considered financial advice. Investors should conduct their own research and consult with financial professionals before making investment decisions. These statements are speculative and subject to change based on market developments. Past performance does not guarantee future results.