
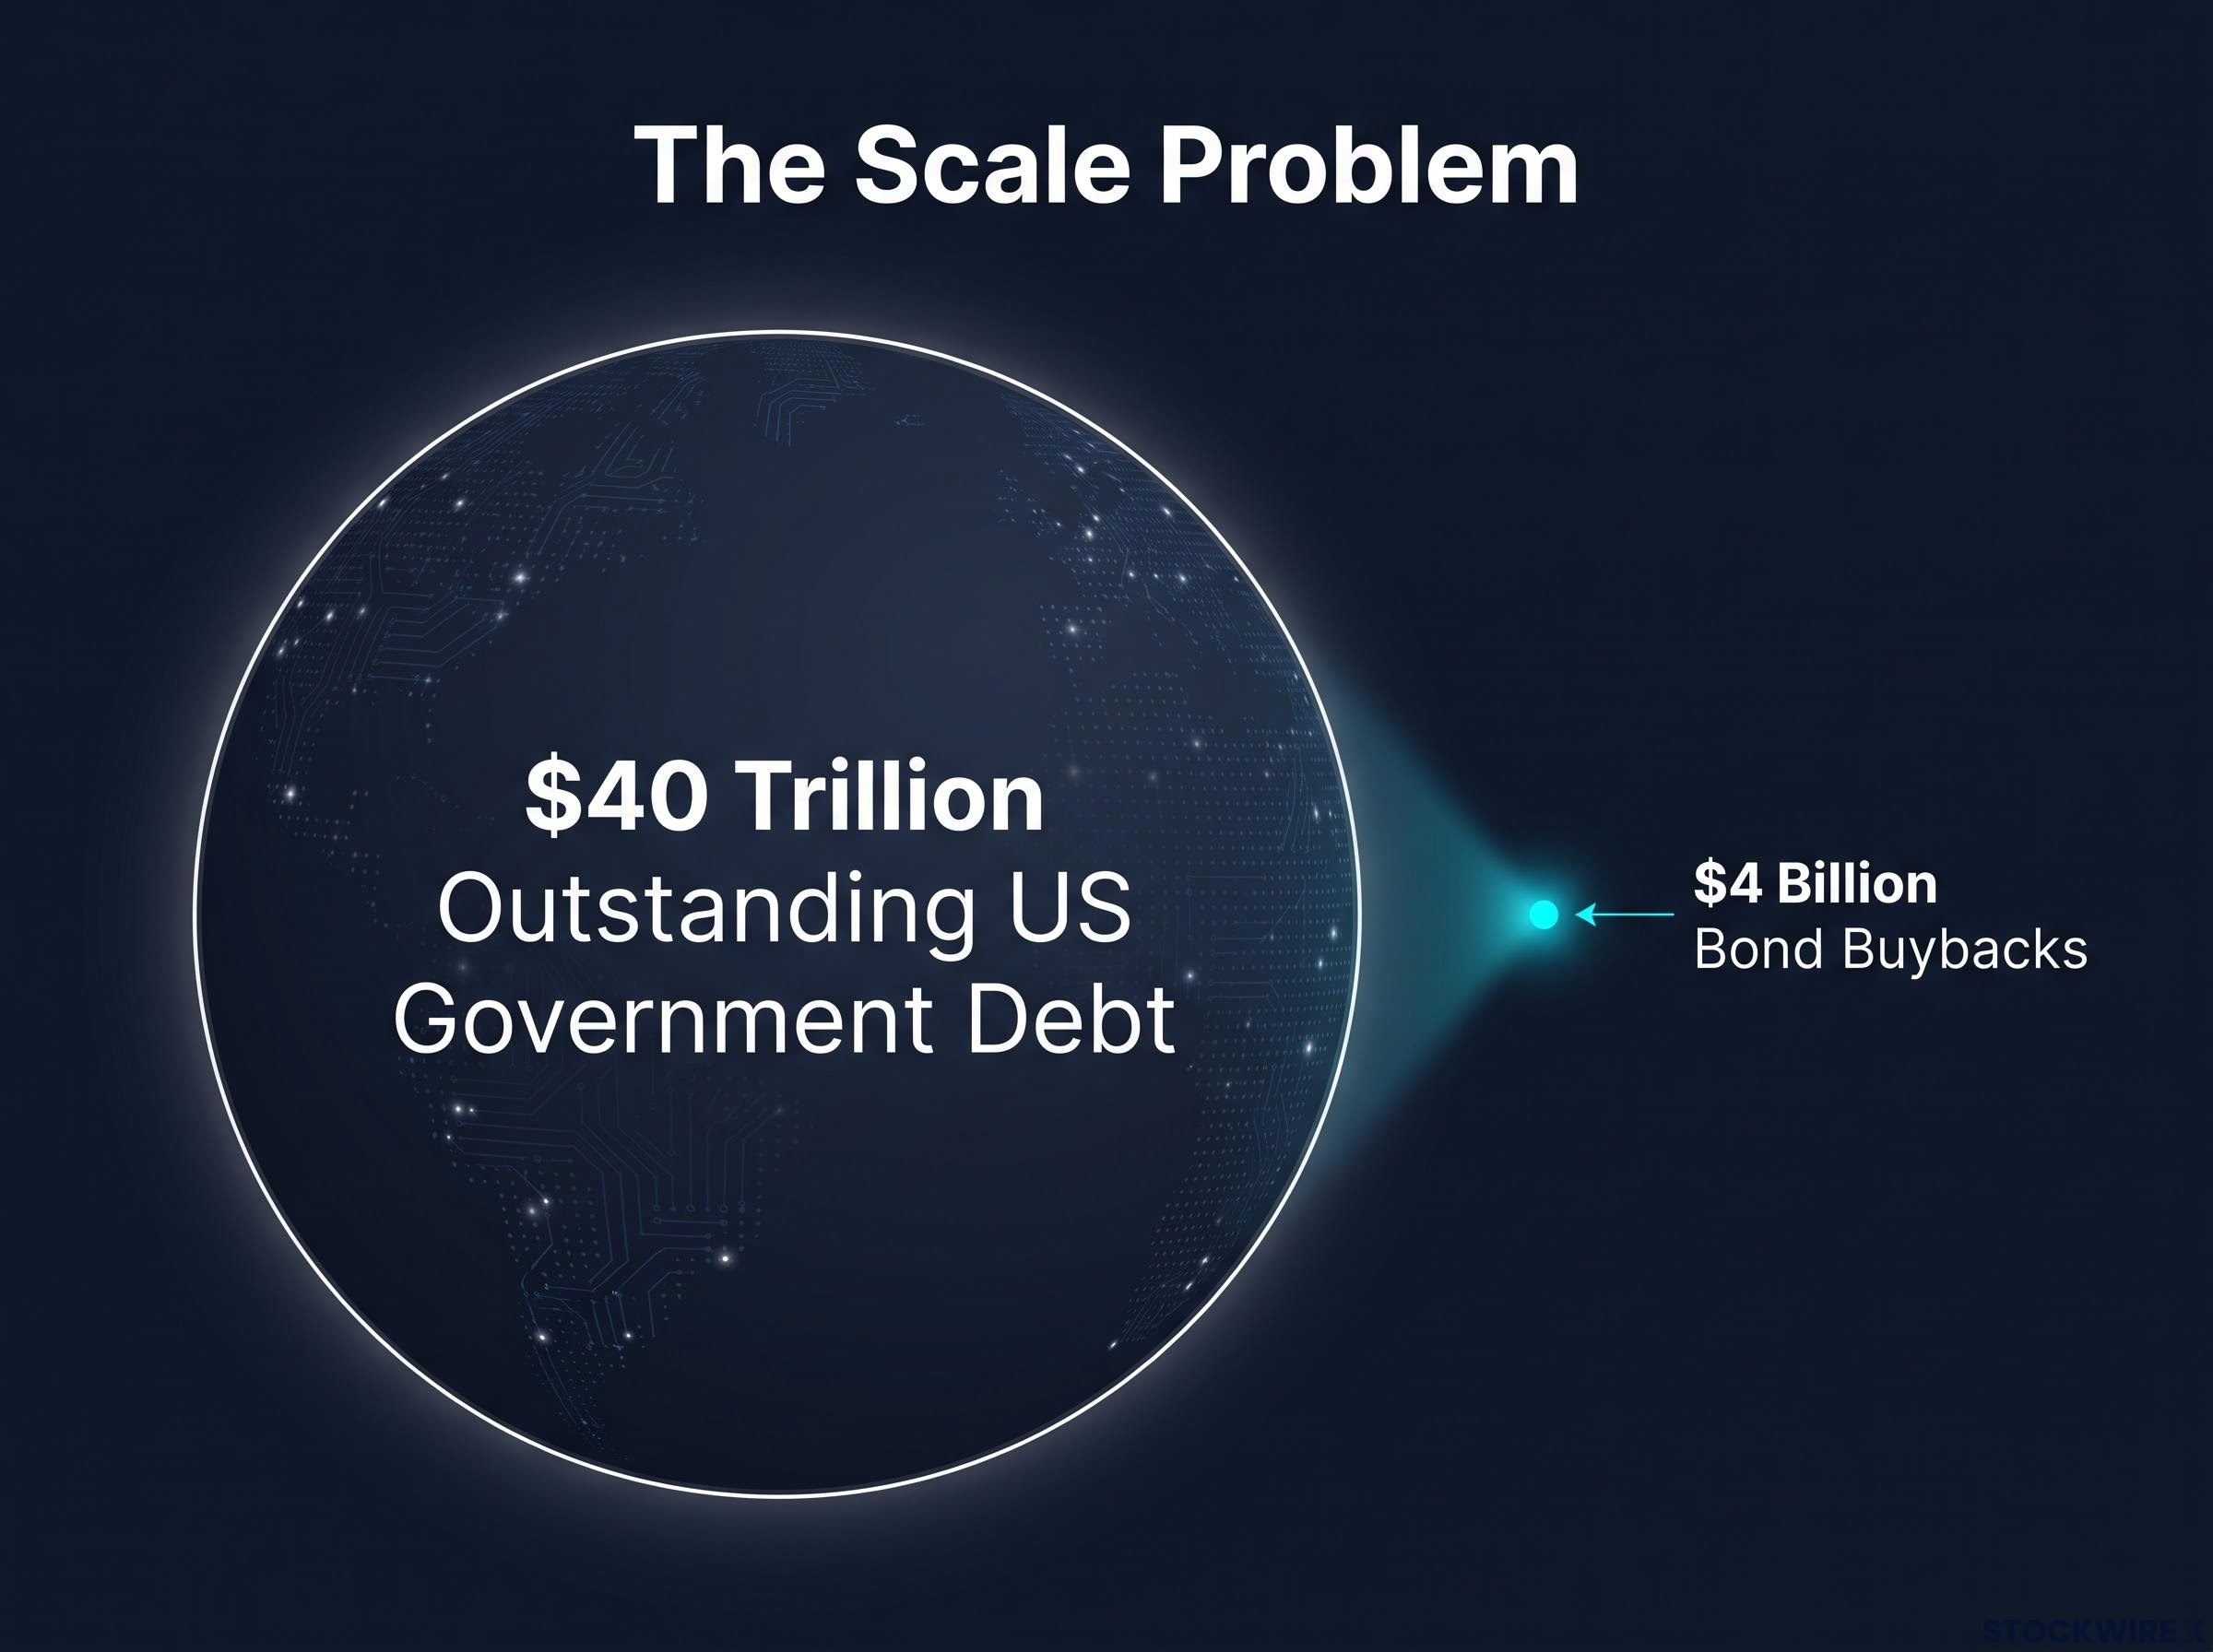
Comparing $4 billion in bond buybacks against the full weight of $40 trillion in outstanding US government debt exposes the scale problem at the heart of Treasury Secretary Scott Bessent’s most consequential policy experiment: an attempt to lean on long-term yields without ever committing to hold them at a specific level.
Bessent has moved the US Treasury into its most interventionist posture in decades. Through doubled buyback caps, issuance composition shifts, and currency-adjacent manoeuvres, Treasury is actively working to suppress long-rate volatility, all without announcing formal targets or enlisting the Federal Reserve. This is happening while the 30-year Treasury yield sits close to 5.25% and the S&P 500 is priced at around 21x forward earnings, a pairing that makes the relationship between bonds and equities acutely consequential for every portfolio carrying duration exposure.
Here is the framework for understanding what Bessent is doing, why it falls short of formal yield curve control, and what it means for positioning across bonds and equities. The practical stakes are specific: the trajectory of the S&P 500’s next major move, toward 8,700 or toward 6,700, hinges more on the behaviour of the long end of the curve than on any individual earnings revision.
What Bessent is actually doing at the long end of the curve
Start with the buybacks. In mid-August 2026, Treasury announced it would “at least double” its per-operation buyback cap on longer-dated Treasuries, raising the ceiling from $2 billion to at least $4 billion. Operations are scheduled from 9 September through 4 November 2026, targeting 10-, 20-, and 30-year issues. The stated rationale is liquidity support and market functioning.
Treasury’s official buyback announcement confirms the new maximum per-operation size, the September-November operational window, and the stated rationale of providing greater liquidity support in longer-dated nominal sectors, giving markets a documented policy basis to evaluate rather than just a signalling posture.
Then look at how Treasury plans to replace those repurchased bonds. Analysts expect the long-dated securities removed from circulation to be replaced with shorter-term bills, effectively reducing supply pressure at the 20- to 30-year end of the curve without Treasury ever announcing a yield target. It is duration removal dressed as routine issuance management.
Then factor in the less visible channels. In at least one episode, Treasury chose to conduct intervention in euros rather than dollars, a decision that observers read as revealing anxiety about the domestic long end of the yield curve. Separately, selling pressure on long bonds eased after coordinated action around the Japanese yen, pointing to a bond stabilisation effort running through more than one channel at once.
The three intervention channels work in parallel:
- Buybacks: Direct repurchase of long-dated Treasuries at doubled per-operation caps, removing duration from the market
- Issuance composition: Replacing long bonds with shorter-term bills, tilting supply away from the maturities where yields are most politically sensitive
- Currency-adjacent actions: Euro-denominated intervention and yen-related coordination that indirectly stabilise long-end pricing
At $4 billion per operation against $40 trillion in outstanding debt, the buyback programme’s scale is modest relative to the market it is trying to move. One commentator called it a “drop in the bucket.” The intent behind the action carries more weight than its mechanical footprint.
The accumulation of these moves tells you that Treasury has constructed an informal policy framework with multiple levers, none of which constitutes a binding commitment, but all of which are directionally aligned toward suppressing long-rate volatility. The 30-year yield fell from above 5.3% to approximately 5.19% on the announcement, then rebounded to roughly 5.22% within a day. That sequence, the dip and the fade, is itself the clearest evidence of where signalling value ends and mechanical limitation begins.
Institutional selling of long Treasuries by managers including PIMCO, BlackRock, and Schroders has been accelerating even at yields above 5.2%, driven by persistent inflation compressing real returns and a CBO deficit trajectory that requires private investors to absorb a growing supply pipeline at progressively higher yields.
When big ASX news breaks, our subscribers know first
Why this falls short of formal yield curve control, and why the distinction matters
Formal yield curve control (YCC) has a specific historical precedent. In the 1940s, the Federal Reserve pegged T-bill rates at 0.375% and capped long-term yields at approximately 2.5% to help finance wartime debt. The mechanism was an unlimited purchase commitment: the Fed stood ready to buy whatever volume was necessary to defend those targets. The ceiling was binding because the institution behind it had infinite firepower.
| Attribute | Formal YCC (1940s Fed) | Bessent’s informal approach (2026) |
|---|---|---|
| Yield targets | Explicit caps at specific maturities | No published targets or caps |
| Purchase commitment | Unlimited; “whatever it takes” | Finite; scheduled operations with capped sizes |
| Fed participation | Fed was the primary actor | No evidence of Fed involvement |
| Exit mechanism | Formal policy unwinding required | Operations simply expire (November 4, 2026) |
Three features that define informal management versus binding control
The distinction rests on three features, each of which carries a direct implication for how much confidence to place in any implied yield ceiling:
- No explicit targets: Without a published cap, Treasury retains flexibility but sacrifices the credibility that comes with a binding commitment, meaning markets can test the boundary without consequence.
- Finite operations: Buybacks are scheduled and capped, so their effect is self-limiting; once the 4 November window closes, the mechanical support disappears.
- No Fed participation: Without a central bank backstop and its unlimited balance sheet, Treasury’s ability to defend any implied ceiling depends entirely on the size of its discretionary programme, which the market has already shown it can absorb.
The absence of a formal commitment and Fed involvement means you should treat any implied yield ceiling as probabilistic rather than structural. This is a policy preference with discretionary backing, not an institutional constraint with unlimited firepower. Misreading that distinction when the 30-year is near 5.25% and equities sit at 21x forward earnings carries real portfolio consequences: you end up underpricing duration risk and placing too much faith in the stability of the long end.
The 5.25% long bond and its grip on equity multiples
With the 30-year Treasury yielding close to 5.25%, risk-free fixed income presents a direct competitive challenge to equities priced at roughly 21x forward earnings, given that the earnings yield implied by that multiple is now barely above what bonds offer without any of the associated risk.
Real yield pressure on equities operates through a mechanical channel that is independent of earnings revisions: as the real 30-year yield approaches 3%, the discount rate applied to future cash flows rises, compressing the present value of long-duration growth stocks even when nominal earnings estimates remain unchanged.
The equity market’s current composition sharpens that tension. All eleven GICS sectors posted positive trailing one-year returns at the time of analysis, a breadth signal that looks healthy on the surface. But the Magnificent 7 mega-caps are churning sideways rather than leading, which means the rally’s leadership base is narrowing at precisely the moment bond competition is intensifying.
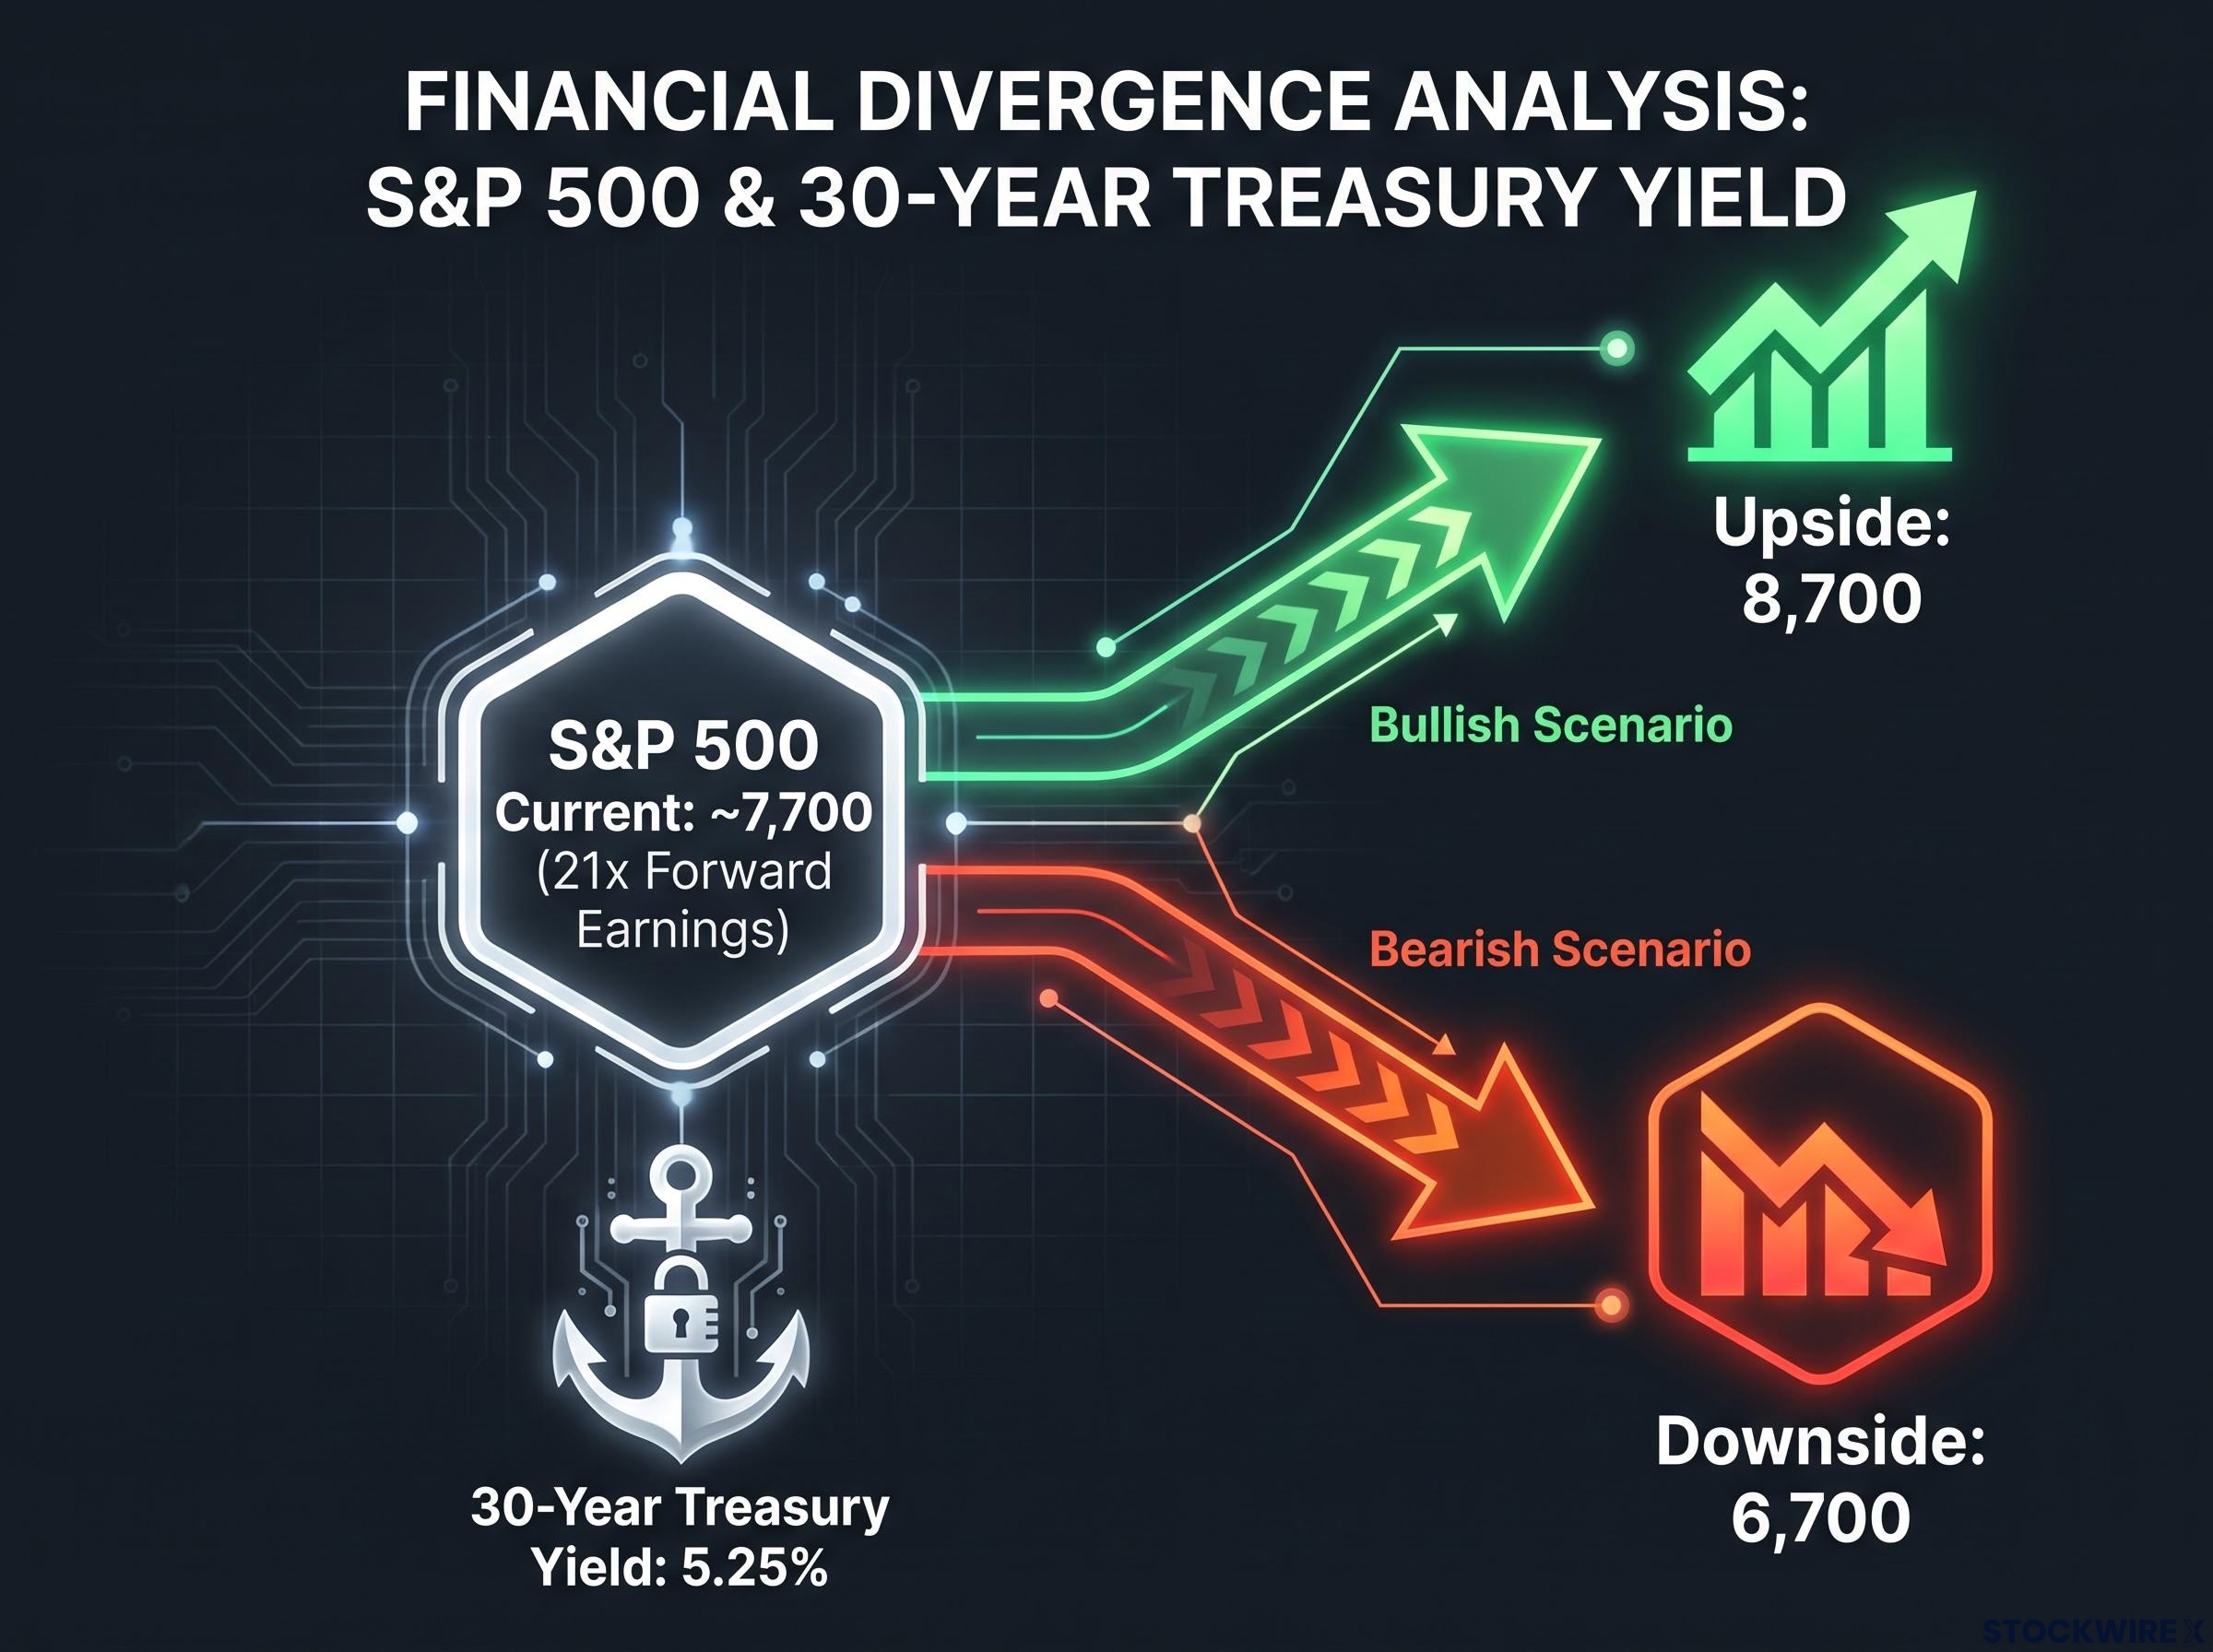
From its current level around 7,700, the S&P 500 faces a binary range: does the index push toward 8,700 on the upside, or retest 6,700 on the downside? The answer to that question is being written at the long end of the curve, not in corporate earnings reports.
Three forces are now simultaneously driving the long end:
- Fundamental macro data and inflation expectations, which set the baseline for where yields should trade absent intervention
- Fed policy via rate expectations, which shapes the front end and cascades into term premiums
- Treasury buybacks and issuance decisions, which add a new, discretionary variable that makes long-duration pricing more path-dependent and headline-sensitive
When the 30-year yield is near 5.25% and equities trade at 21x earnings, the cushion between current valuations and a hostile equity risk premium is thin. Any sustained drift higher in yields compresses that cushion rapidly, and Treasury’s capacity to prevent that drift is the central variable for equity bulls to monitor.
How to read Treasury interventions as an investor
The initial yield move following the buyback announcement tells you exactly how to calibrate expectations. The 30-year fell from above 5.3% to approximately 5.19%, then rebounded to roughly 5.22% within a single session. That rapid fade is your practical proof that signalling value and mechanical impact are not the same thing.
Three adjustments to how you process Treasury communications will reduce the risk of being whipsawed by announcement-driven yield moves that fade within sessions:
- Read buyback announcements as probabilistic ceilings, not hard caps. Bessent’s interventions raise the political and tactical cost of pushing long yields sharply higher, but the operations are modest relative to total outstanding debt. A yield dip on a buyback announcement may be a signal of willingness, not a durable backstop. Evaluate for durability before treating it as an entry signal.
- Prefer the belly of the curve over the long end for Treasury exposure. Because buybacks target the 10-, 20-, and 30-year segment directly, the 5- to 10-year belly is less exposed to both the volatility of informal management and the policy misfires that could result if Treasury’s operations lose credibility.
- Monitor policy credibility as a leading indicator of term premium risk. If markets come to view buybacks as cosmetic given the scale of outstanding debt, term premiums at the long end may rise to price fiscal risk, inverting the intended effect.
Market commentary has already characterised Bessent’s interventions as “rearranging deckchairs” absent structural fiscal change. That language captures the credibility risk in a single phrase: if the operations do not produce lasting yield effects, the market will begin pricing Treasury’s limitations rather than its intentions.
The read for you is straightforward. Size duration positions based on the mechanical reality of what buybacks can accomplish, not on the signalling language that accompanies them.
Why Bessent’s approach tests the boundaries of central bank independence
Treasury’s buyback programme operates in a domain traditionally reserved for extraordinary monetary policy. The Fed has historically intervened directly in the bond market only in crises, and there is no sign it intends to join Bessent’s efforts. That institutional separation creates a friction that markets will eventually price.
Yield curve steepening dynamics add a counterintuitive layer to Bessent’s intervention calculus: wider term spreads improve bank net interest margins and loosen credit supply conditions, meaning Treasury’s effort to suppress long-end volatility may simultaneously be stimulating credit creation in ways that complicate the Fed’s inflation mandate.
For now, some of the channels through which that friction could escalate remain quiet. The housing sector’s absence of speculative excess removes one systemic risk that could otherwise trigger Fed overtightening, which would directly conflict with Treasury’s yield preferences. But the structural tension between a Treasury actively managing long yields and a Fed with a separate mandate does not require a housing bubble to surface.
Bessent’s public framing of a “big toolkit” and continued willingness to act without Fed involvement signals that the administration views this as a Treasury prerogative. If the Fed’s priorities and Treasury’s actions diverge materially, you should expect the long end to price an institutional risk premium that no volume of buybacks can easily offset. That governance friction is itself a source of yield volatility, and it does not appear in standard bond market commentary often enough.
The geopolitical overlay and its inflationary tail
Commodity market disruption linked to Hormuz shipping risk introduces an inflationary tail scenario that could compel the Fed to put its price stability mandate ahead of any tacit alignment with Treasury’s efforts to hold long yields down. If energy-driven inflation re-accelerates, the Fed faces a choice between tolerating higher long-end yields and actively tightening into a Treasury that is simultaneously trying to suppress them. That divergence would be the most direct test of informal yield curve management’s limits.
What the long bond tells you from here, and what it does not
The analytical value of this framework is not in predicting whether yields go to 5.5% or 4.8%. It is in knowing which observable signals will confirm or invalidate the informal management thesis as it plays out through the remainder of 2026.
Yields as the primary policy lever have displaced equity market signals in Washington’s decision calculus, a structural shift that Wolfe Research, Apollo, and Mohamed El-Erian each identified earlier in 2026 as the reason bond market stress now produces faster White House responses than comparable S&P 500 drawdowns.
Three markers are worth tracking in real time:
- Whether 30-year yields sustain above 5.3% despite active buybacks. That was the pre-intervention level at which Treasury chose to act. If yields hold above it during the September-November operations window, the market is overpowering Treasury’s tools.
- Whether Treasury escalates buyback volumes beyond the announced cap. An increase would signal policy intensification and suggest the initial programme proved insufficient, changing the calculus on how seriously to take the implied ceiling.
- Whether the Fed makes any public statement on long-end dynamics. Silence maintains the current ambiguity. Any comment, whether supportive or distancing, would reprice the institutional coordination question immediately.
The core analytical conclusion holds: informal yield curve management creates a probabilistic resistance zone at the long end, not a ceiling. That distinction determines whether equities at 21x earnings are priced appropriately for the rate environment or are carrying undisclosed duration risk.
Whether the S&P 500 advances toward 8,700 or retreats toward 6,700 will depend primarily on whether Bessent’s tools can keep the long end anchored in a range that current equity multiples can survive. The buyback window closes 4 November 2026. That is your near-term policy horizon.
This article is for informational purposes only and should not be considered financial advice. Investors should conduct their own research and consult with financial professionals before making investment decisions. Past performance does not guarantee future results. Financial projections are subject to market conditions and various risk factors.