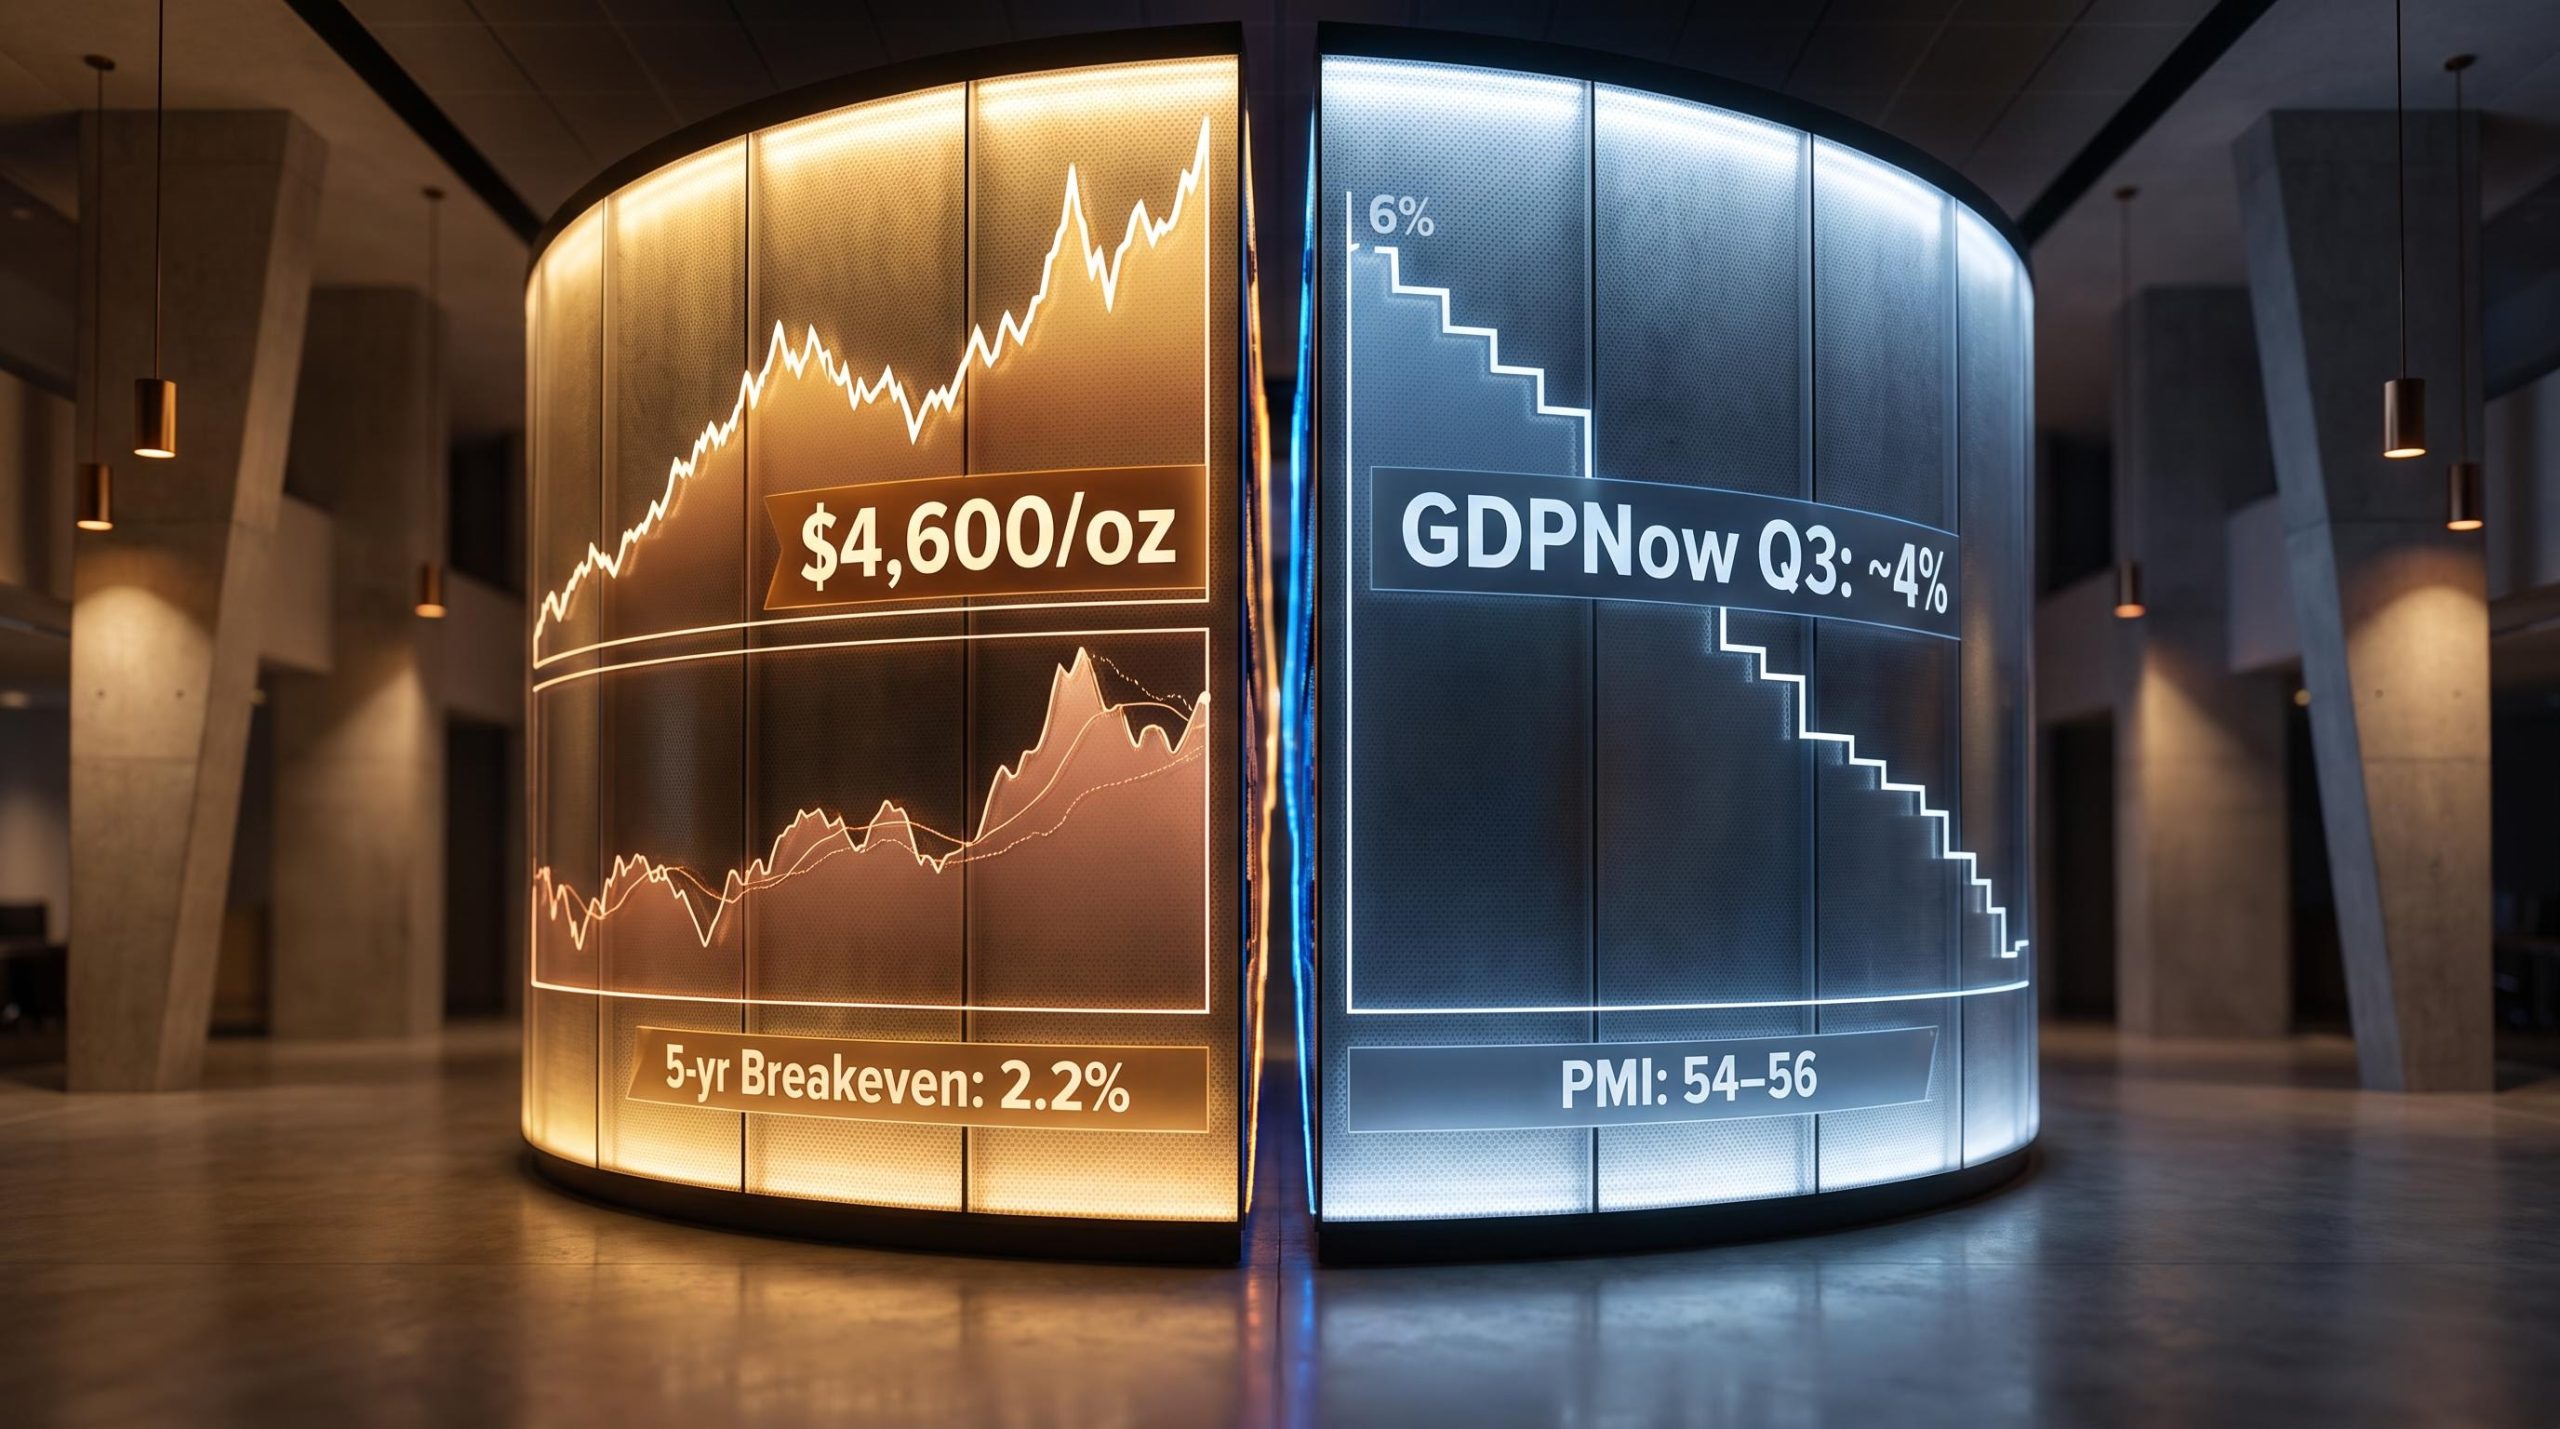
Copper is near all-time highs. Gold just staged a 600-point recovery from its mid-year trough. The S&P Global US Composite PMI beat every Wall Street estimate in July 2026. And yet the Atlanta Fed’s GDPNow model has been steadily downgrading its Q3 growth projection over the past three weeks, sliding from around 6% to 4% as successive data releases came in.
These are not random data points. They are five distinct market and macro signals that should, in theory, tell a coherent story about where the US economy is heading in the second half of 2026. They are not telling that story. They are telling at least two, possibly three, and the contradictions between them are where the real information sits.
Here is what the combination of gold, copper, PMI, GDP tracking, inflation breakevens, and housing starts actually tells you when you read them as a system rather than in isolation, and here is how to weight them against each other the next time you sit down with your portfolio.
What gold at $4,600 is actually pricing in
Gold is trading at approximately $4,600 per troy ounce as of 21 August 2026. The instinct is to call it an inflation hedge. The data says otherwise.
The full 2026 arc matters. Gold opened the year near $5,400, then shed roughly $1,400 across a period of 90-120 days before finding a floor near $4,000. From there it added 600 points back in a tight 20-40 day window to reach where it trades today. Notably, that rebound unfolded against a backdrop of climbing real yields, a circumstance under which conventional analysis would predict gold to weaken.
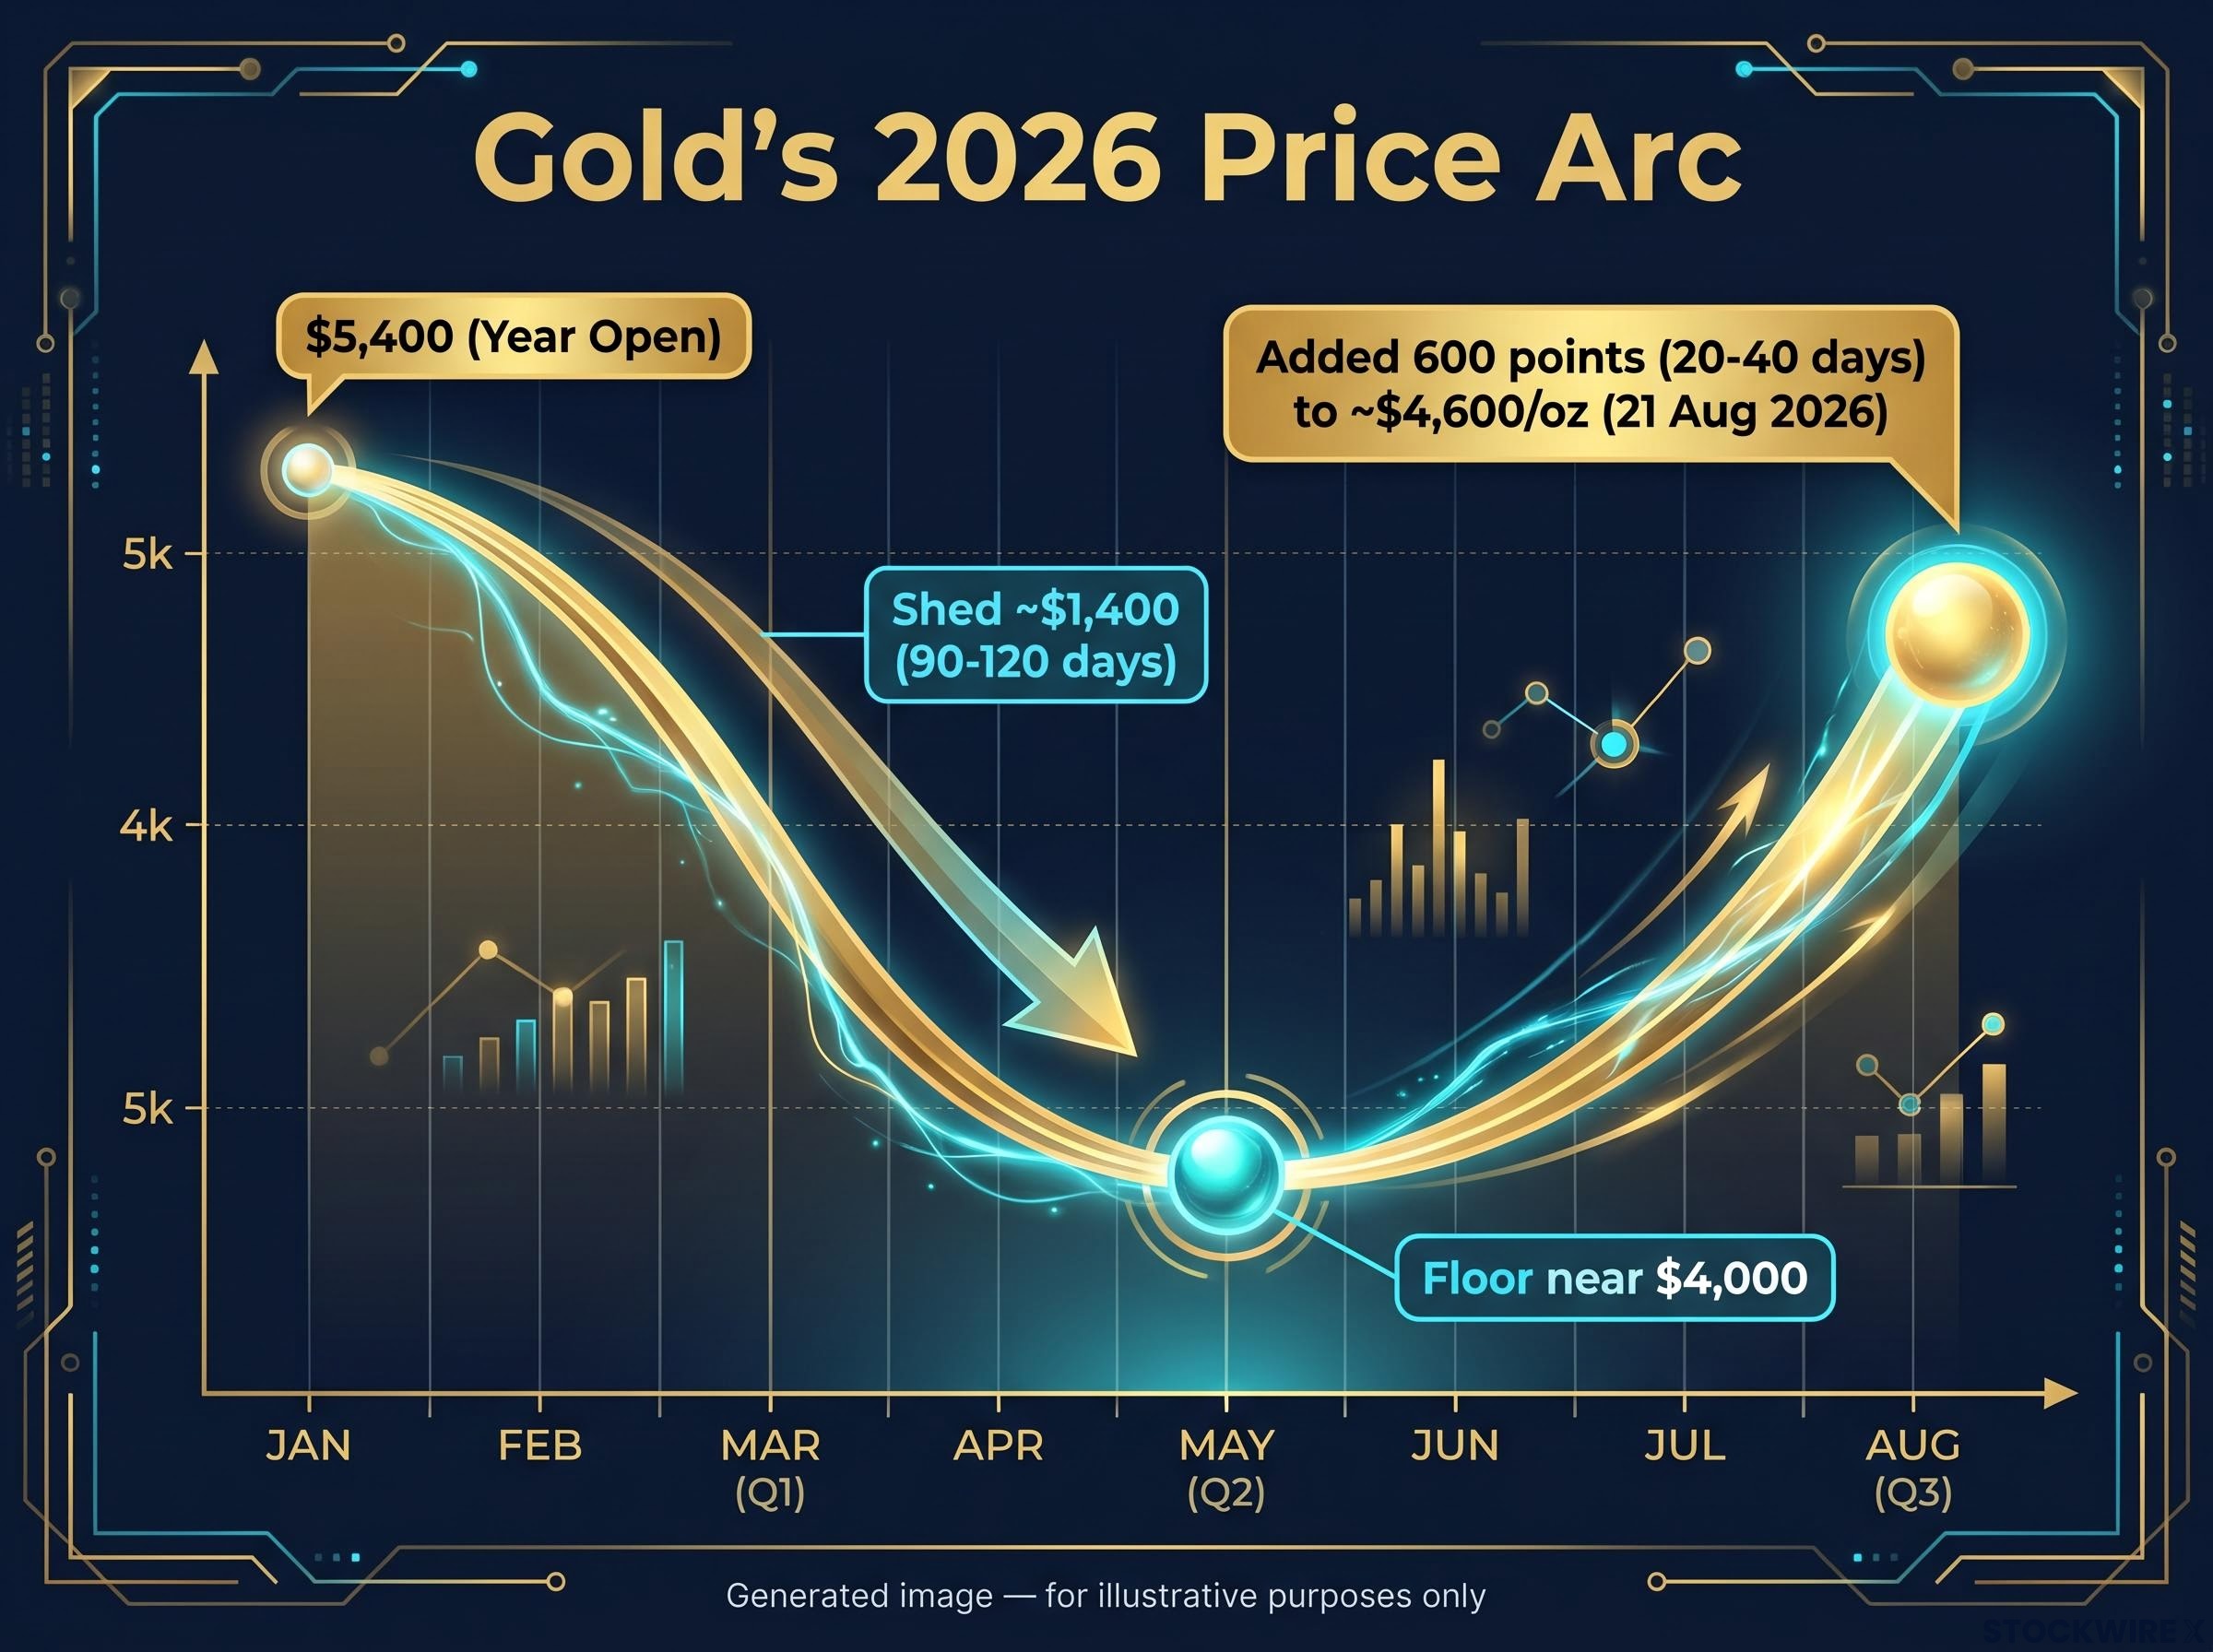
Gold at $4,600/oz vs. the 5-year breakeven inflation rate at approximately 2.2-2.3%. The divergence is the signal.
The 5-year breakeven, the spread between nominal Treasury yields and TIPS yields of the same maturity (a market-derived measure of expected average inflation over the next five years), is sitting near its yearly lows. If gold were simply pricing near-term inflation, it would be tracking breakevens down. It is not. A $4,600 gold price sitting alongside a 2.2% breakeven is a sign that the market is treating fiscal and monetary credibility as the primary concern rather than a near-term CPI spiral. That distinction changes how you should think about what gold is hedging in your portfolio.
Three reasons sophisticated buyers are still holding at these prices
- Reserve diversification. Central banks and sovereign wealth funds have been building gold positions as part of a broader effort to reduce reliance on USD-denominated assets, a trend that continues regardless of interest rate movements.
Central bank reserve diversification has accelerated sharply since the 2022 freezing of Russian sovereign assets, with sovereign institutions now buying gold at roughly 1,000 tonnes annually, double the pace of the prior decade, a structural bid that operates largely independent of short-term rate movements or CPI fluctuations.
- The fiscal relief-valve thesis. A persistent belief that policymakers will ultimately manage sovereign debt loads by tolerating higher long-run inflation rather than accepting sustained austerity or very elevated real rates. Gold prices this as a multi-year expectation, not a quarterly trade.
- Purchasing-power insurance as a structural position. Gold’s refusal to fall during rising real yields suggests buyers are holding it as long-duration protection against purchasing-power erosion, distinct from a cyclical bet on the next CPI print.
Retail investors who buy gold expecting it to track monthly CPI releases are likely misreading the signal. At $4,600, gold is a long-duration bet on fiscal policy reliability, which carries different portfolio implications than a short-term inflation trade.
When big ASX news breaks, our subscribers know first
Copper near $6.60 and what it rules out
Copper is trading at approximately $6.60 per pound in mid-August 2026, consolidating in a $6.58-$6.70 band after setting record highs above $6.80-$6.90 earlier this month. The five-year uptrend stretching back to approximately 2021 remains intact.
What makes copper’s current price analytically useful is not the absolute level but the spring 2026 divergence. While gold and silver softened, copper held firm, a signal market participants read as evidence that industrial demand, not safe-haven flows, was supporting commodity markets. That divergence narrows the range of plausible economic scenarios considerably.
Copper’s price is the market signal that is hardest to fake. It requires physical demand from factories, construction sites, and infrastructure projects. Elevated copper does not lie about real activity the way sentiment surveys sometimes can.
Three distinct demand pillars are supporting prices at these levels:
- Ongoing global manufacturing activity, particularly in Asia
- Construction demand across residential and commercial segments
- Electrification-related infrastructure build-out, from EV charging networks to grid upgrades
For a US retail investor watching recession headlines, copper at these levels is among the most compelling empirical arguments available that real economic activity, the kind measured in things being manufactured, wired, and built, remains intact. Copper has historically moved ahead of official recession calls, and its current price elevation gives good reason to treat any near-term recession thesis with considerable scepticism.
The copper supply deficit underpinning current prices is projected at roughly 520,000 metric tonnes for 2026, more than double the prior year’s shortfall, driven by three simultaneous supply failures including a Chinese sulphuric acid export halt and a force majeure at Freeport-McMoRan’s Grasberg mine with restart pushed to early 2028.
Reading the PMI-GDPNow gap as a bifurcation signal
The S&P Global US Composite PMI for July 2026 printed near 54-56, the strongest private-sector expansion reading since late 2025, with the services component clearing the highest Wall Street estimate on the upside. At the same time, the Atlanta Fed’s GDPNow estimate for Q3 2026 has stepped down from approximately 6% earlier in the summer to approximately 4% by mid-August, with successive weekly updates trimming the figure as softer data arrived.
The Citi Economic Surprise Index fell substantially across the same period, a sign that the incoming data flow had been running consistently below what analysts had pencilled in.
| Indicator | Reading | Period | Direction | What it measures |
|---|---|---|---|---|
| Composite PMI | ~54-56 | July 2026 | Up (strongest since late 2025) | Private-sector activity, services-led |
| GDPNow (Q3) | ~4% | Mid-August 2026 | Down (from ~6% peak) | Model-based GDP tracking |
These two indicators are not contradicting each other. They are mapping different parts of the same economy.
Why services strength and housing weakness can coexist
The PMI’s strength is driven primarily by services and business-to-business activity, sectors that are less directly sensitive to interest rate levels. Consumer and business spending on intangibles continues regardless of mortgage rate movements.
Rate-sensitive sectors tell a different story. Housing, transaction-heavy financial services, and some capital expenditure categories respond to higher rates with a long lag. They are now bearing the accumulated weight of restrictive monetary policy, and that drag is what pulls GDPNow lower even while sentiment surveys stay buoyant.
The PMI-GDPNow gap is not a data error to dismiss. It is a map of exactly where the economy is holding and where it is not. If you understand which sectors your holdings are exposed to, this gap tells you whether your portfolio sits on the strong or the weakening side of the bifurcation.
What inflation expectations are actually telling you in mid-2026
Start with the number most investors already know. Headline CPI fell to 3.5% year-over-year in June 2026, with a -0.4% month-over-month print, the largest monthly decline since April 2020. Core CPI eased to 2.6% year-over-year. On the surface, inflation looks like a fading problem.
But CPI is backward-looking. It tells you what prices did last month. Professional investors watch a different instrument: breakeven inflation rates. A breakeven is the spread between a nominal Treasury yield and a TIPS (Treasury Inflation-Protected Securities) yield of the same maturity. It tells you what the bond market expects average inflation to be over a given period, five years, ten years, or longer.
Inflation expectations across major consumer surveys were running between 3.5% and 6.2% for the year ahead as of late June 2026, well above pre-pandemic norms, creating a structural fragility that sits in tension with the anchored 5-year breakeven the bond market is projecting and helps explain why gold has not simply followed breakevens lower.
The 5-year breakeven sits at approximately 2.2-2.3% as of mid-August 2026, near its yearly lows and well below the approximately 3.6% peak of March 2022.
5-year breakeven at approximately 2.2-2.3% today vs. approximately 3.6% at the March 2022 peak. The bond market’s inflation anxiety has more than halved.
Three structural forces are suppressing medium-term inflation expectations:
- Housing market stagnation. Roughly four years of depressed housing turnover have created a structural cap on shelter CPI, one of the largest weights in the inflation basket.
- AI-driven productivity gains. Across industries, AI-generated efficiencies are bearing down on operating costs. Every major technological shift in history has ultimately acted as a deflationary force, and the current wave of AI adoption fits that pattern.
- Ongoing restrictive Fed policy. Higher rates continue suppressing demand-side inflation pressures across rate-sensitive spending categories.
WTI crude has partially recovered to approximately $86 per barrel as of 21 August 2026, but breakevens did not rise alongside crude’s rebound, a signal the bond market views current energy price volatility as transitory rather than inflationary.
Taken together, a 5-year breakeven near 2.2% and a gold price of $4,600 reveal two markets focused on distinctly different concerns. The bond market’s inflation gauges point to contained near-term price pressure, while gold reflects lingering doubt about long-run fiscal credibility. Recognising that separation is essential to avoid treating these two instruments as interchangeable hedges when they serve fundamentally different purposes in a portfolio.
This article is for informational purposes only and should not be considered financial advice. Investors should conduct their own research and consult with financial professionals before making investment decisions.
Housing starts and the rate-sensitive drag hiding inside the GDP numbers
Now the corrective. July 2026 housing starts fell 12.4% month-over-month to an annualised rate of 1.239 million units, down 13.5% from a year earlier. Single-family starts dropped 9.9% to 808,000 units, the lowest pace since late 2022.
| Category | July 2026 rate | MoM change | YoY change |
|---|---|---|---|
| Total housing starts | 1.239M annualised | -12.4% | -13.5% |
| Single-family starts | 808,000 units | -9.9% | Lowest since late 2022 |
This is not a housing crash. It is a slow structural drag that has persisted for approximately four years, constraining activity across multiple downstream channels:
- Construction employment, where fewer starts mean fewer jobs and hours
- Furnishings and durable goods spending, suppressed by lower transaction volumes
- Transaction-related financial services, including mortgage origination, title insurance, and real estate brokerage
- Shelter CPI, where depressed turnover structurally caps rent and price escalation
This is the mechanism that connects housing weakness to the successive GDPNow downgrades. Rate-sensitive sector softness pulls a model-based GDP estimate lower even when survey-based PMI stays elevated. A housing market running at multi-year lows in single-family starts is not recession, but it is a sustained drag on employment, consumer spending, and shelter costs that will keep appearing in GDP revisions for quarters to come. The economic bifurcation will not resolve quickly.
A practical dashboard for navigating contradictory macro signals
Six indicators. Each one illuminates a different dimension of economic risk. Read together, they form a coherent system.
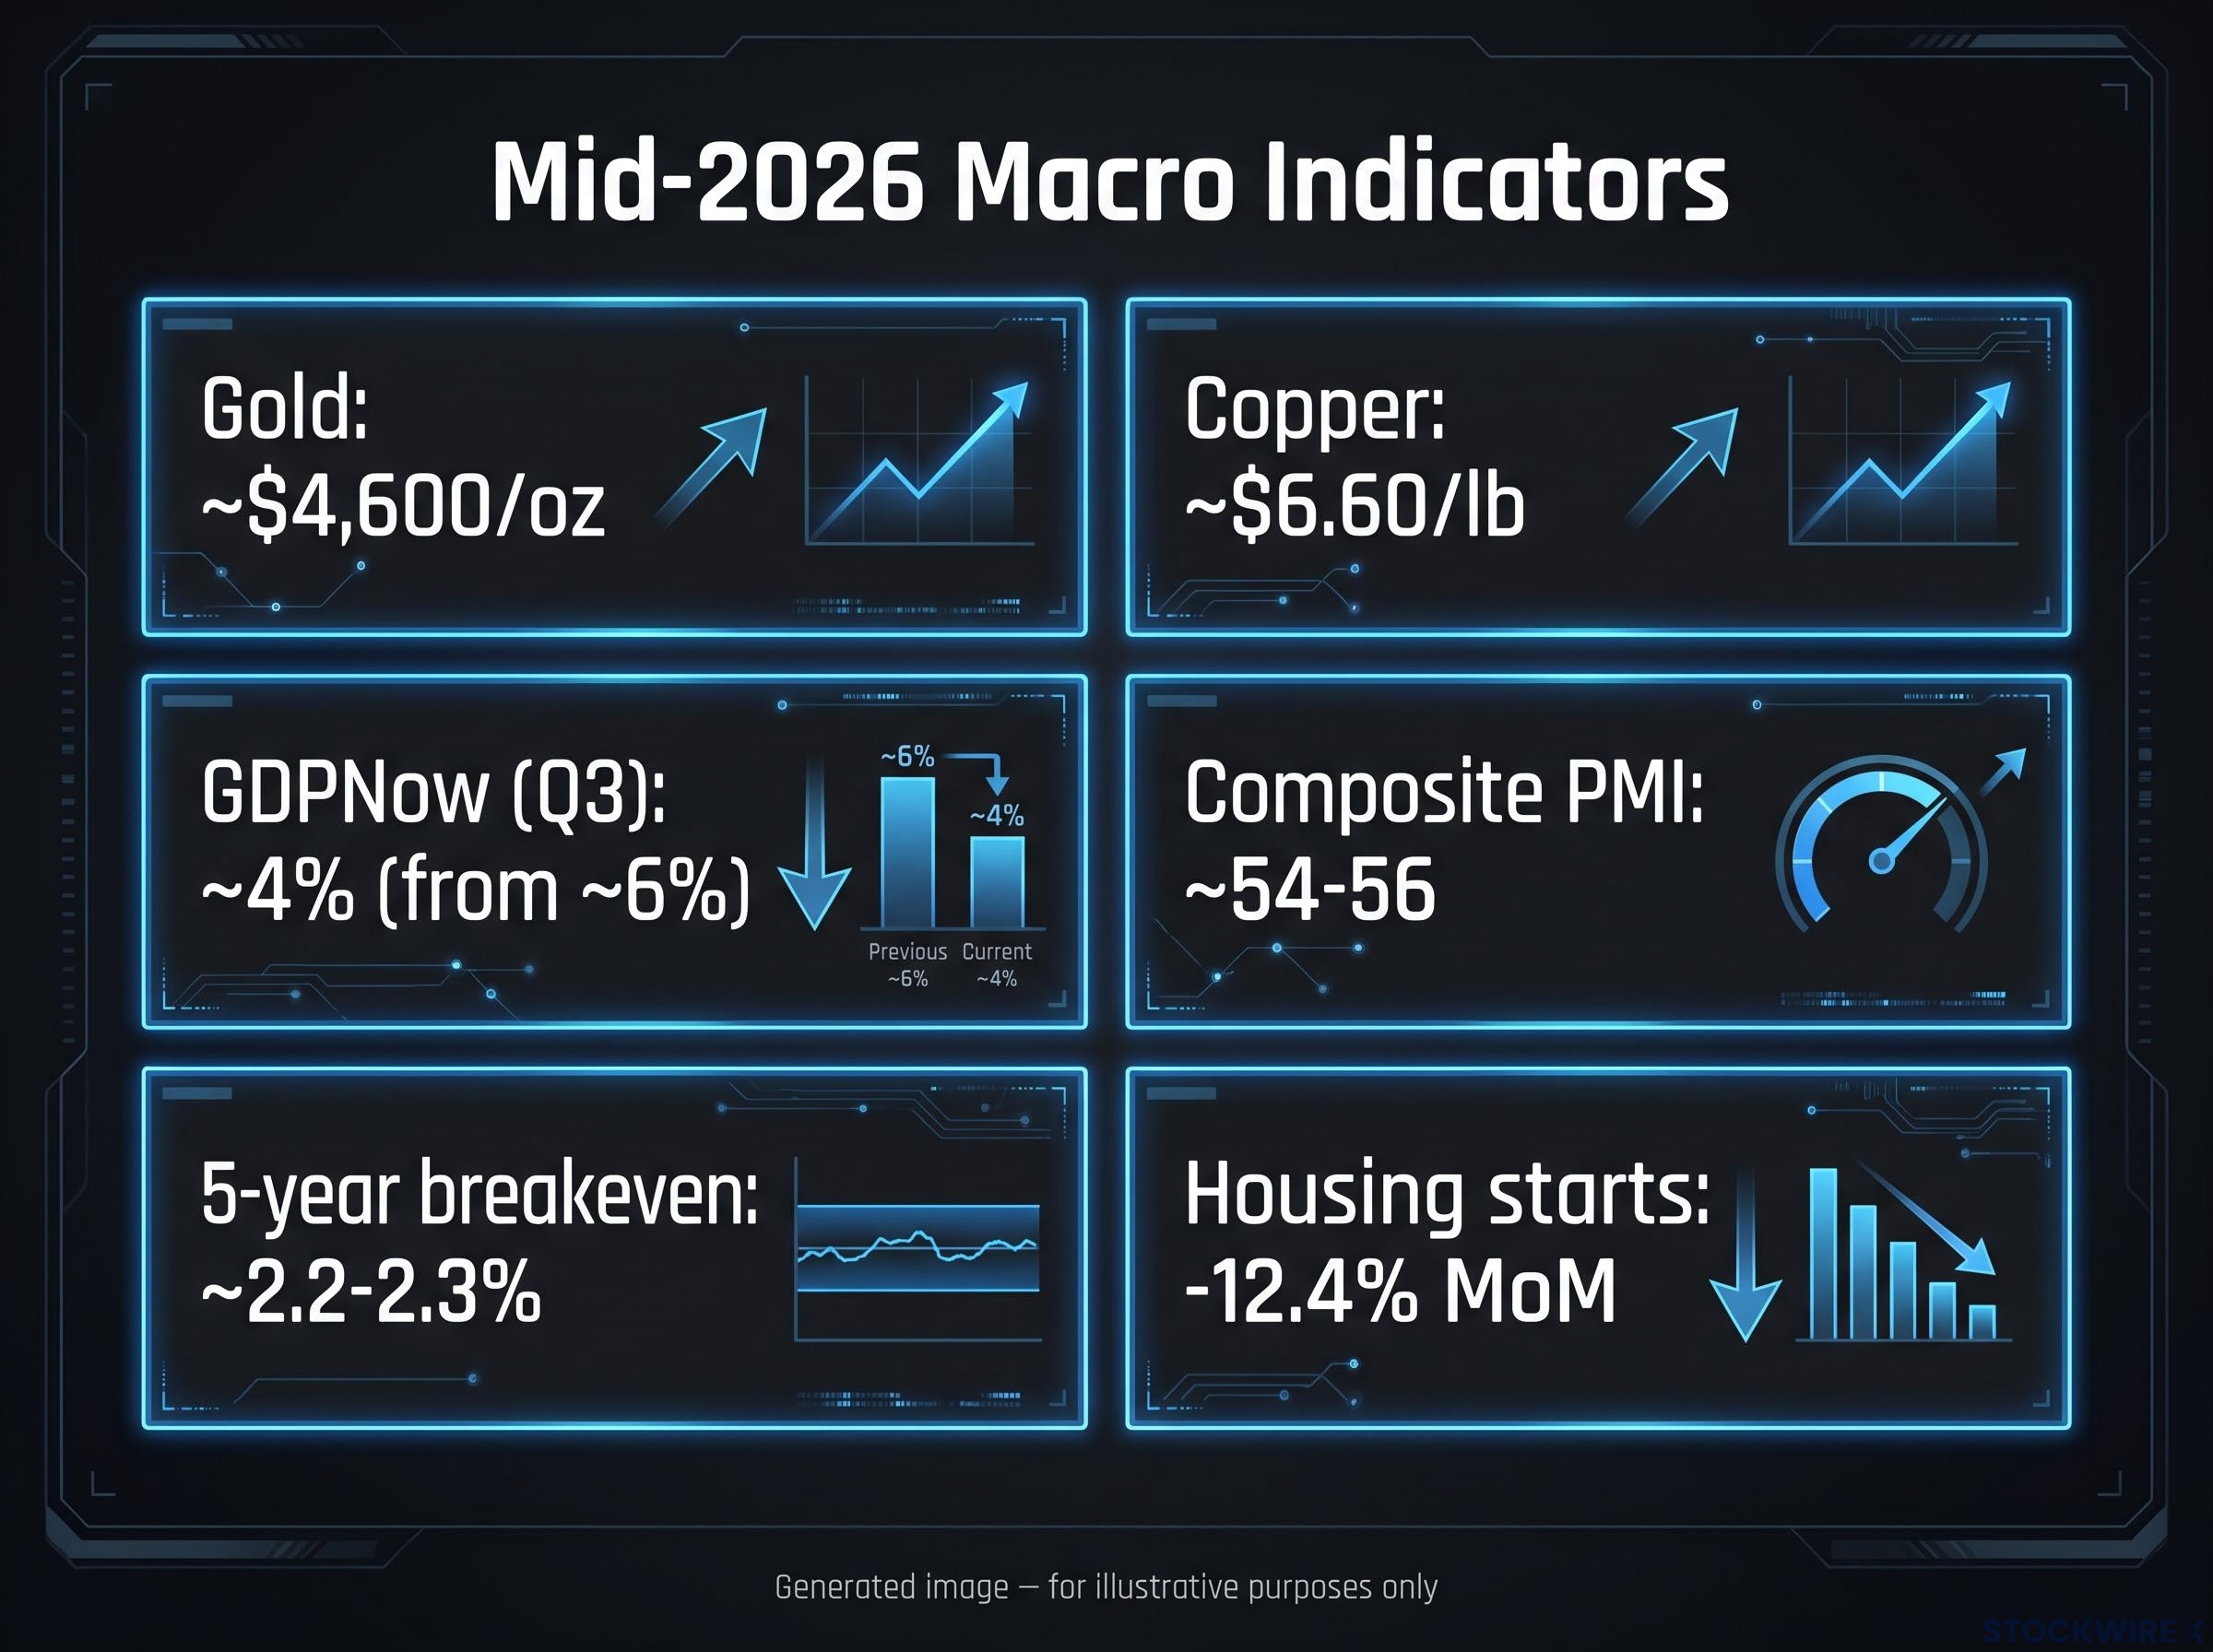
| Indicator | Current reading | What it measures | Current signal |
|---|---|---|---|
| Gold | ~$4,600/oz | Fiscal/monetary trust; long-term purchasing-power risk | Elevated; persistent hedging demand against fiscal uncertainty |
| Copper | ~$6.60/lb | Real-time global and US industrial health | Near all-time highs; real economy still expanding |
| Composite PMI | ~54-56 | Private-sector activity, services-led | Expansion; strongest since late 2025 |
| GDPNow (Q3) | ~4% | Near-term GDP trajectory | Decelerating from ~6%; rate-sensitive drag confirmed |
| 5-year breakeven | ~2.2-2.3% | Medium-term inflation expectations | Near yearly lows; moderate inflation priced |
| Housing starts | -12.4% MoM | Rate-sensitive sector health | Significantly weak; lowest single-family pace since late 2022 |
Three monitoring relationships turn this table into a decision tool:
- The PMI-GDPNow gap as a bifurcation gauge. If GDPNow stabilises or rises toward PMI levels, services-led strength is being confirmed across the broader economy. If PMI rolls over toward GDPNow, rate-sensitive weakness is spreading into sectors that were previously holding.
- Gold vs. breakevens as a paired fiscal-vs-inflation risk read. Gold up while breakevens stay flat means the market is pricing fiscal risk, not CPI risk. Both rising together is the signal that inflation expectations are genuinely shifting upward.
- Copper as the leading warning indicator. Copper’s continued elevation is the single strongest argument against recession pricing. Sustained copper weakness would be an early warning that industrial demand is cracking before it shows up in employment or GDP data.
The combined reading of these six indicators describes an economy still expanding but under asymmetric pressure. Your exposure to rate-sensitive sectors determines whether the current macro environment is working for or against your portfolio.
What the bifurcation means for the second half of 2026
The data leaves three messages that do not require hedging or qualification.
Growth is positive but uneven. Copper and PMI argue against recession. Housing and GDPNow revisions argue against uniform strength. Both readings are accurate because they are measuring different parts of the same economy.
Inflation anxiety has faded in the bond market but not in gold. Breakevens are anchored near yearly lows. Gold remains elevated at $4,600. The gap between them is a fiscal trust signal, not a CPI signal, and the distinction matters for how you position.
The dominant risk is policy trajectory and sector rotation, not an imminent downturn. The open question is whether fiscal policy choices will eventually undermine the inflation anchoring that breakevens currently reflect. That is the unresolved variable gold is pricing and bond markets are not. Its resolution will determine whether the bifurcation narrows or widens through Q4 2026 and into 2027.
- Gold vs. breakevens: The fiscal trust gap. When gold stays elevated while breakevens decline, it signals that the market is protecting against long-run policy credibility risk rather than the next monthly CPI release.
- Copper vs. GDPNow: Real activity vs. model drag. Near-record copper with declining GDP estimates tells you the weakness is concentrated in rate-sensitive sectors, not broad-based.
- PMI vs. housing starts: Services strength vs. rate-sensitive drag. A mid-50s PMI alongside multi-year-low housing starts tells you the economy is running at two speeds, and your sector exposure determines which speed you are experiencing.
The US economy is growing. The question is whether the framework holding it together can sustain the pressure long enough for rate-sensitive sectors to stabilise. Gold at $4,600 is asking you to take that question seriously. The breakeven market says it is not worried yet. Monitoring both, together, is how you stay ahead of whichever answer arrives first.
For investors wanting to model how the institutional bid fits into a portfolio allocation decision, our deep-dive into structural gold demand covers the Asian ETF inflow data and JP Morgan figures showing the average allocation shift from roughly 1% pre-2020 to 2-2.5% currently.
Past performance does not guarantee future results. Financial projections are subject to market conditions and various risk factors.