
The Reserve Bank of New Zealand raised its Official Cash Rate for the second meeting in a row on 2 September 2026, and the New Zealand Dollar fell.
That is the puzzle sitting at the centre of the NZD/USD picture right now. A central bank tightened policy, and its currency weakened in the hours that followed. The pair has since settled into a tight consolidation near 0.5880, caught between an RBNZ that is hiking but hedging its future path, and a US labour market print that blew past what economists expected.
Neither of those forces has resolved, which is precisely why the pair is stuck. One side pulls the Kiwi up on rate differentials; the other pulls it down on Fed strength.
Here is what this analysis gives you: the specific technical levels that will define the next move, the reason an RBNZ hike can weaken the currency, and the single upcoming data release that the institutional strategist community is genuinely watching to break the deadlock.
The technical picture: a pair that refuses to commit
Look at the price structure and the story tells itself. The pair is consolidating in the 0.5880 zone in early September 2026, a reading confirmed across XE, MarketWatch, and Investing.com. It is not drifting; it is pinned between layered support below and a stacked wall of resistance above.
Momentum is doing nothing to help either side. The Relative Strength Index (RSI), a gauge that measures whether an asset’s recent price moves are stretched in one direction, is sitting near 48 on the one-hour chart.
RSI near 48 A reading of 50 is neutral. At 48, momentum has not committed to buyers or sellers. The chart is genuinely undecided, and that ambiguity is the analytical point.
Where the floor sits
The support structure is layered, which is what makes the current zone meaningful. On the one-hour chart, rising trendline support sits near 0.5876, backed by the 100-period Simple Moving Average (SMA) at 0.5872, with a deeper intraday floor at 0.5856. The 4-hour chart widens the cushion, marking a support zone across 0.5840-0.5880.
Step back to the medium-term view and the 200-day SMA at 0.5830 becomes the reference line institutional desks watch. Below that lies a confluence support zone spanning 0.5780-0.5820, where the annual pivot at 0.5787, the monthly pivot at 0.5814, and the 21-week moving average at 0.5818 cluster together. That is the level where the structural bear case would have to be tested, not the daily noise.
What it would take to turn the chart bullish
The upside is where the pair’s reluctance shows most clearly. Clearing resistance is not a single hurdle; it is a sequence.
| Level type | Price (approx.) |
|---|---|
| Descending trendline resistance | 0.5884 |
| 200-period SMA (1-hour) | 0.5902 |
| Horizontal resistance barrier | 0.5903 |
| Monthly R1 | 0.5971 |
| Macro descending trendline | 0.5980-0.6000 |
For the picture to turn genuinely bullish, buyers must clear the descending trendline near 0.5884, then the 200-period SMA at 0.5902, then the horizontal barrier at 0.5903, in that order. What this tells you is that no single catalyst gets the job done. A clean breakout requires consecutive level clearances, which matters when you are sizing risk ahead of a data event. Failure to break above 0.5903 on any catalyst keeps the broader bearish pressure intact.
When big ASX news breaks, our subscribers know first
A “dovish hike” and what it tells you about RBNZ credibility
The RBNZ raised the OCR by 25 basis points to 2.75%, and the Kiwi sold off. That is the paradox worth sitting with, because the reason had nothing to do with the decision and everything to do with how it was delivered.
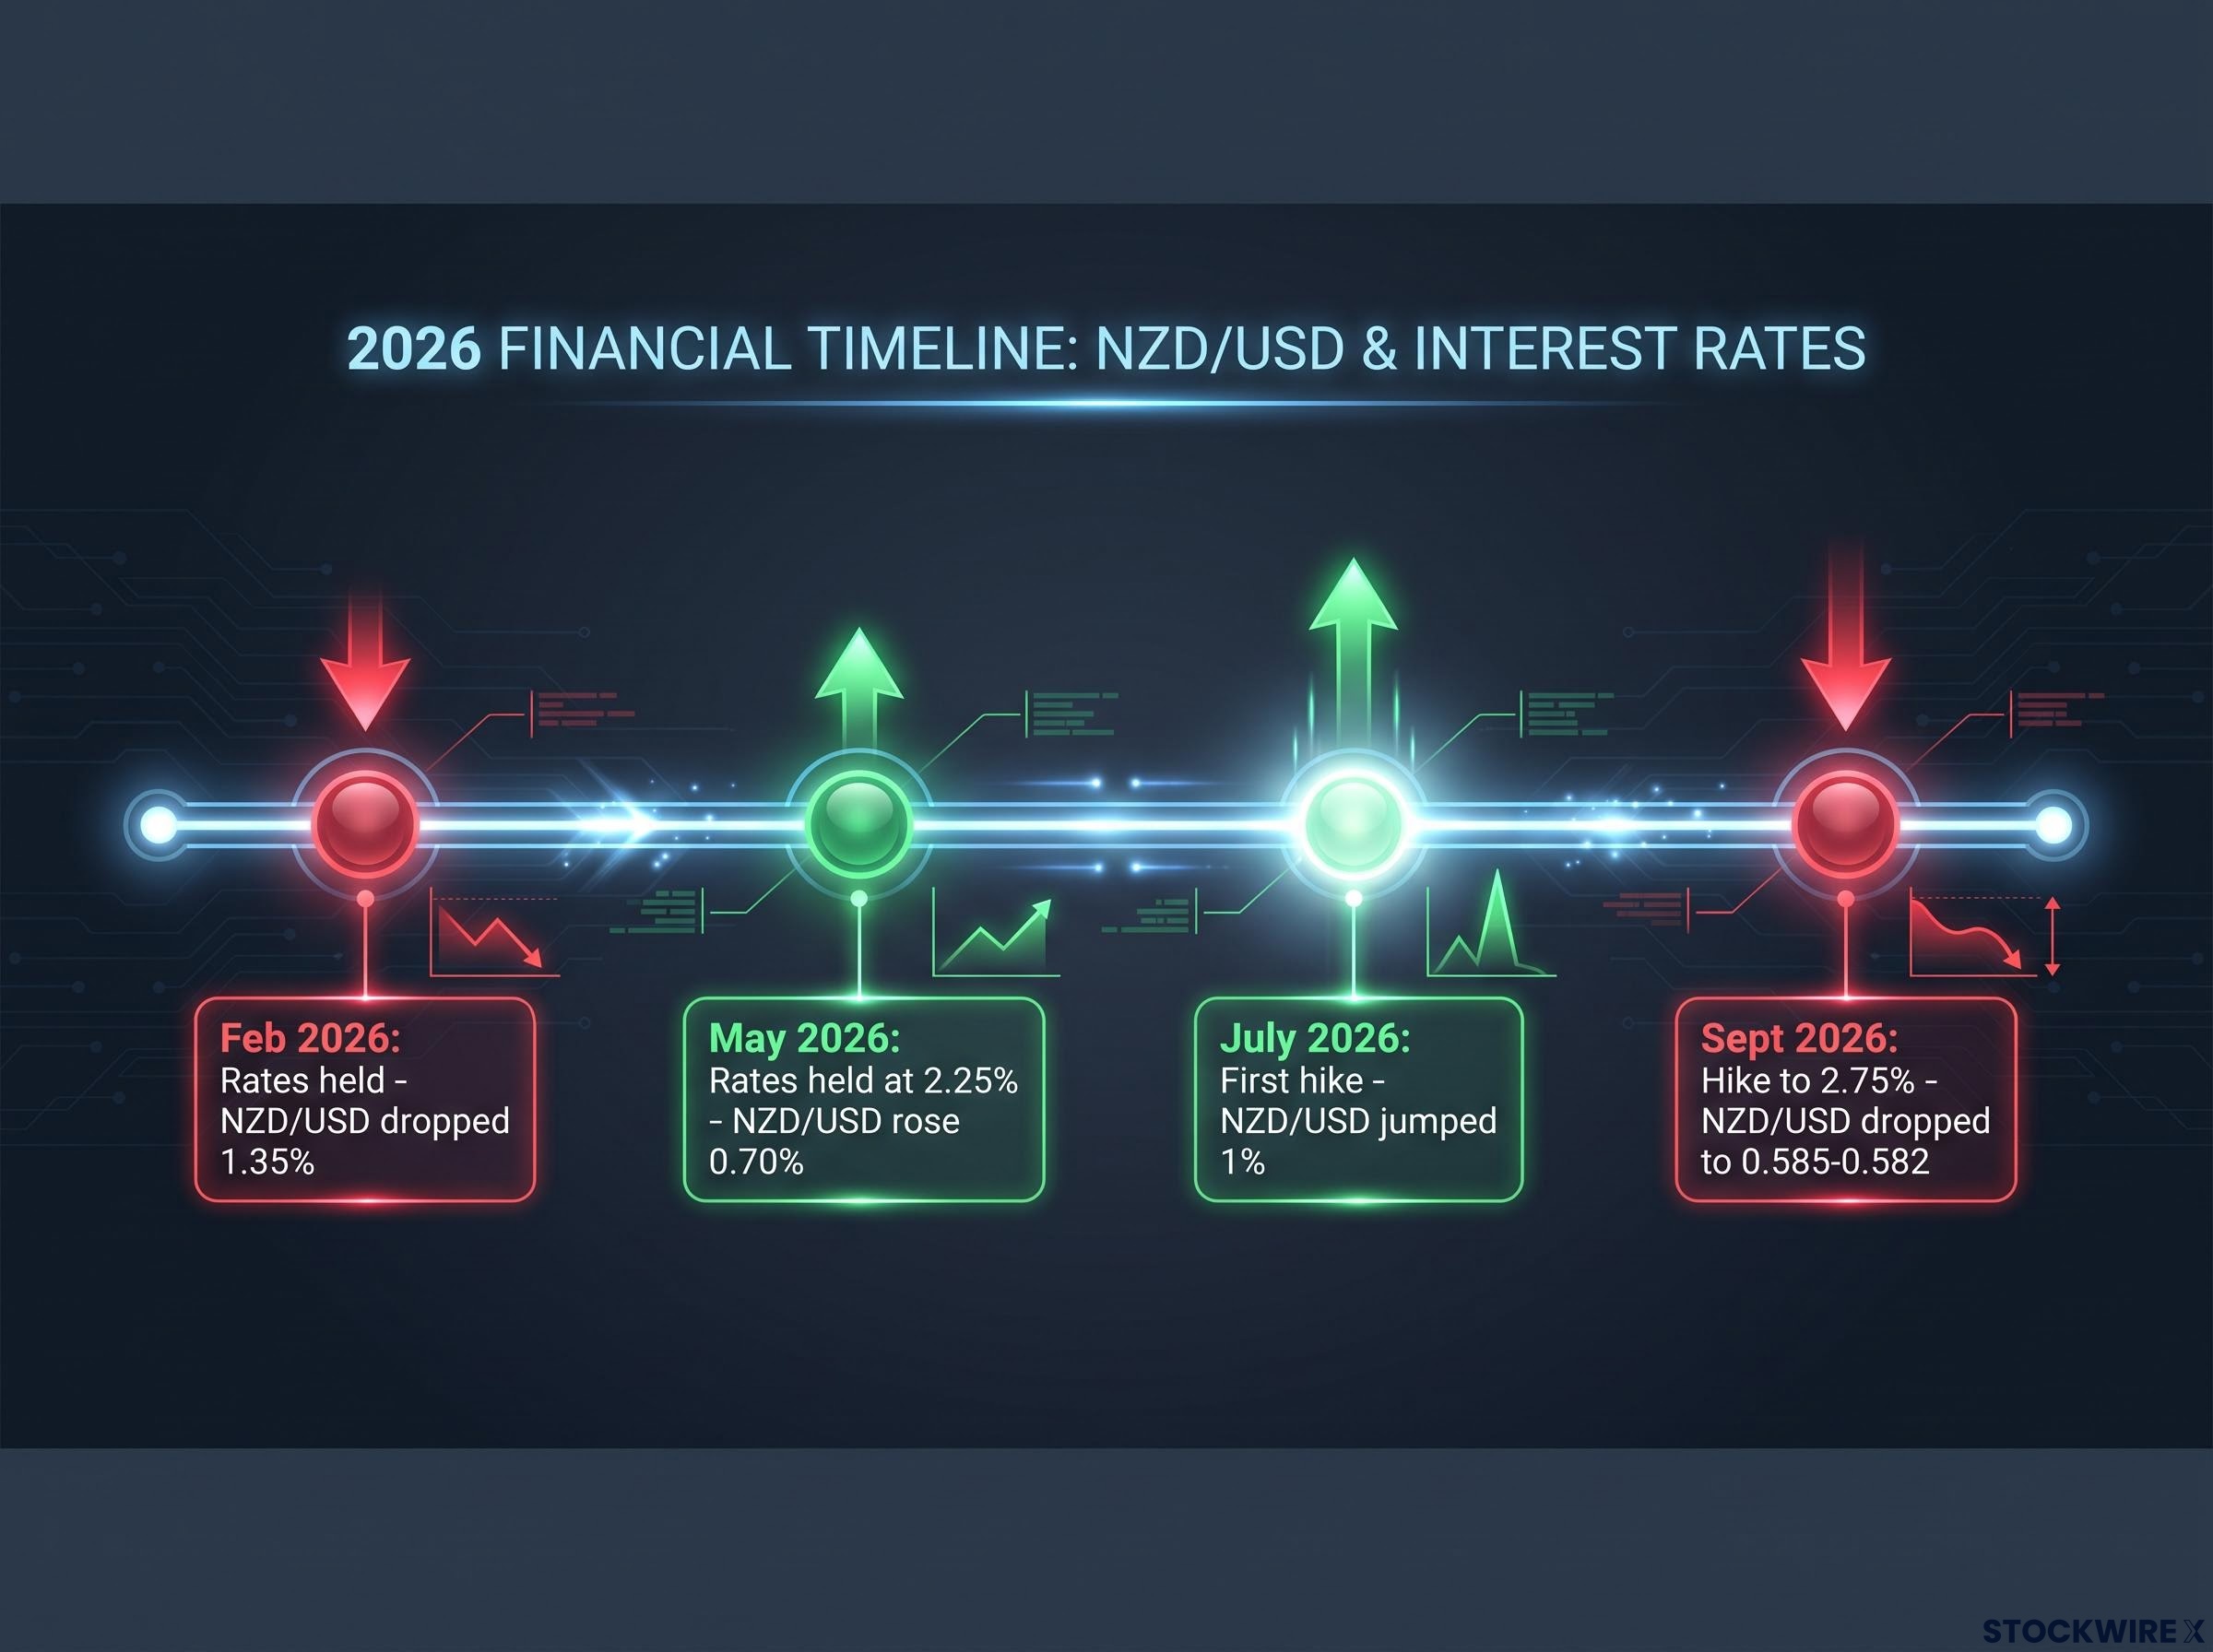
The 2 September 2026 move was reached by unanimous consensus, with no formal vote required. Yet the guidance signalled a likely pause in October, and the pair dropped into the 0.585-0.582 range almost immediately. Markets read it as a “buy-the-rumour, sell-the-fact” reaction: the hike was already priced, and the cautious tone about what comes next did the damage.
This is not a one-off. The RBNZ’s recent record shows a consistent pattern where framing overrides the rate move itself.
- February 2026: rates held, but the hike timeline was pushed out. The pair dropped 1.35% as markets cut hike probabilities from 90% to 75%.
- May 2026 “hawkish hold”: rates held at 2.25% in a split 3-3 vote, paired with aggressive tightening warnings. NZD/USD rose roughly 0.70% toward 0.5870.
- July 2026 first hike: the first increase in three years signalled a normalisation cycle beginning, and the pair jumped around 1%.
- September 2026 “dovish hike”: a second consecutive hike to 2.75%, undercut by an October pause signal, sent the pair toward 0.585.
The pattern is unmistakable. The market is not trading the OCR level; it is trading the credibility of the forward guidance.
RBNZ forward guidance snapshot October pause expected. Potential 25 bp hike to 3.00% in December. Neutral OCR estimated at 3.00-3.50%, implying tightening persists into 2027. Westpac projects a peak rate of 4.00% by September 2027.
Institutional views split on how hard to lean into this. ANZ brought forward its first-hike expectation to December 2026, arguing domestic inflation is too high to consider easing. ING warns the opposite risk: market pricing of roughly 95 basis points of hikes by June 2027 looks, in its words, too hawkish relative to the RBNZ’s own projections.
The read you should take is simple. Judging an RBNZ meeting by its rate-decision headline will mislead you every time. What the committee says about the next meeting is the variable that moves the currency, and that is the lens to apply to December.
What the NFP print actually changed (and what it did not)
The August payrolls number was not a small beat. It was a rout of the consensus.
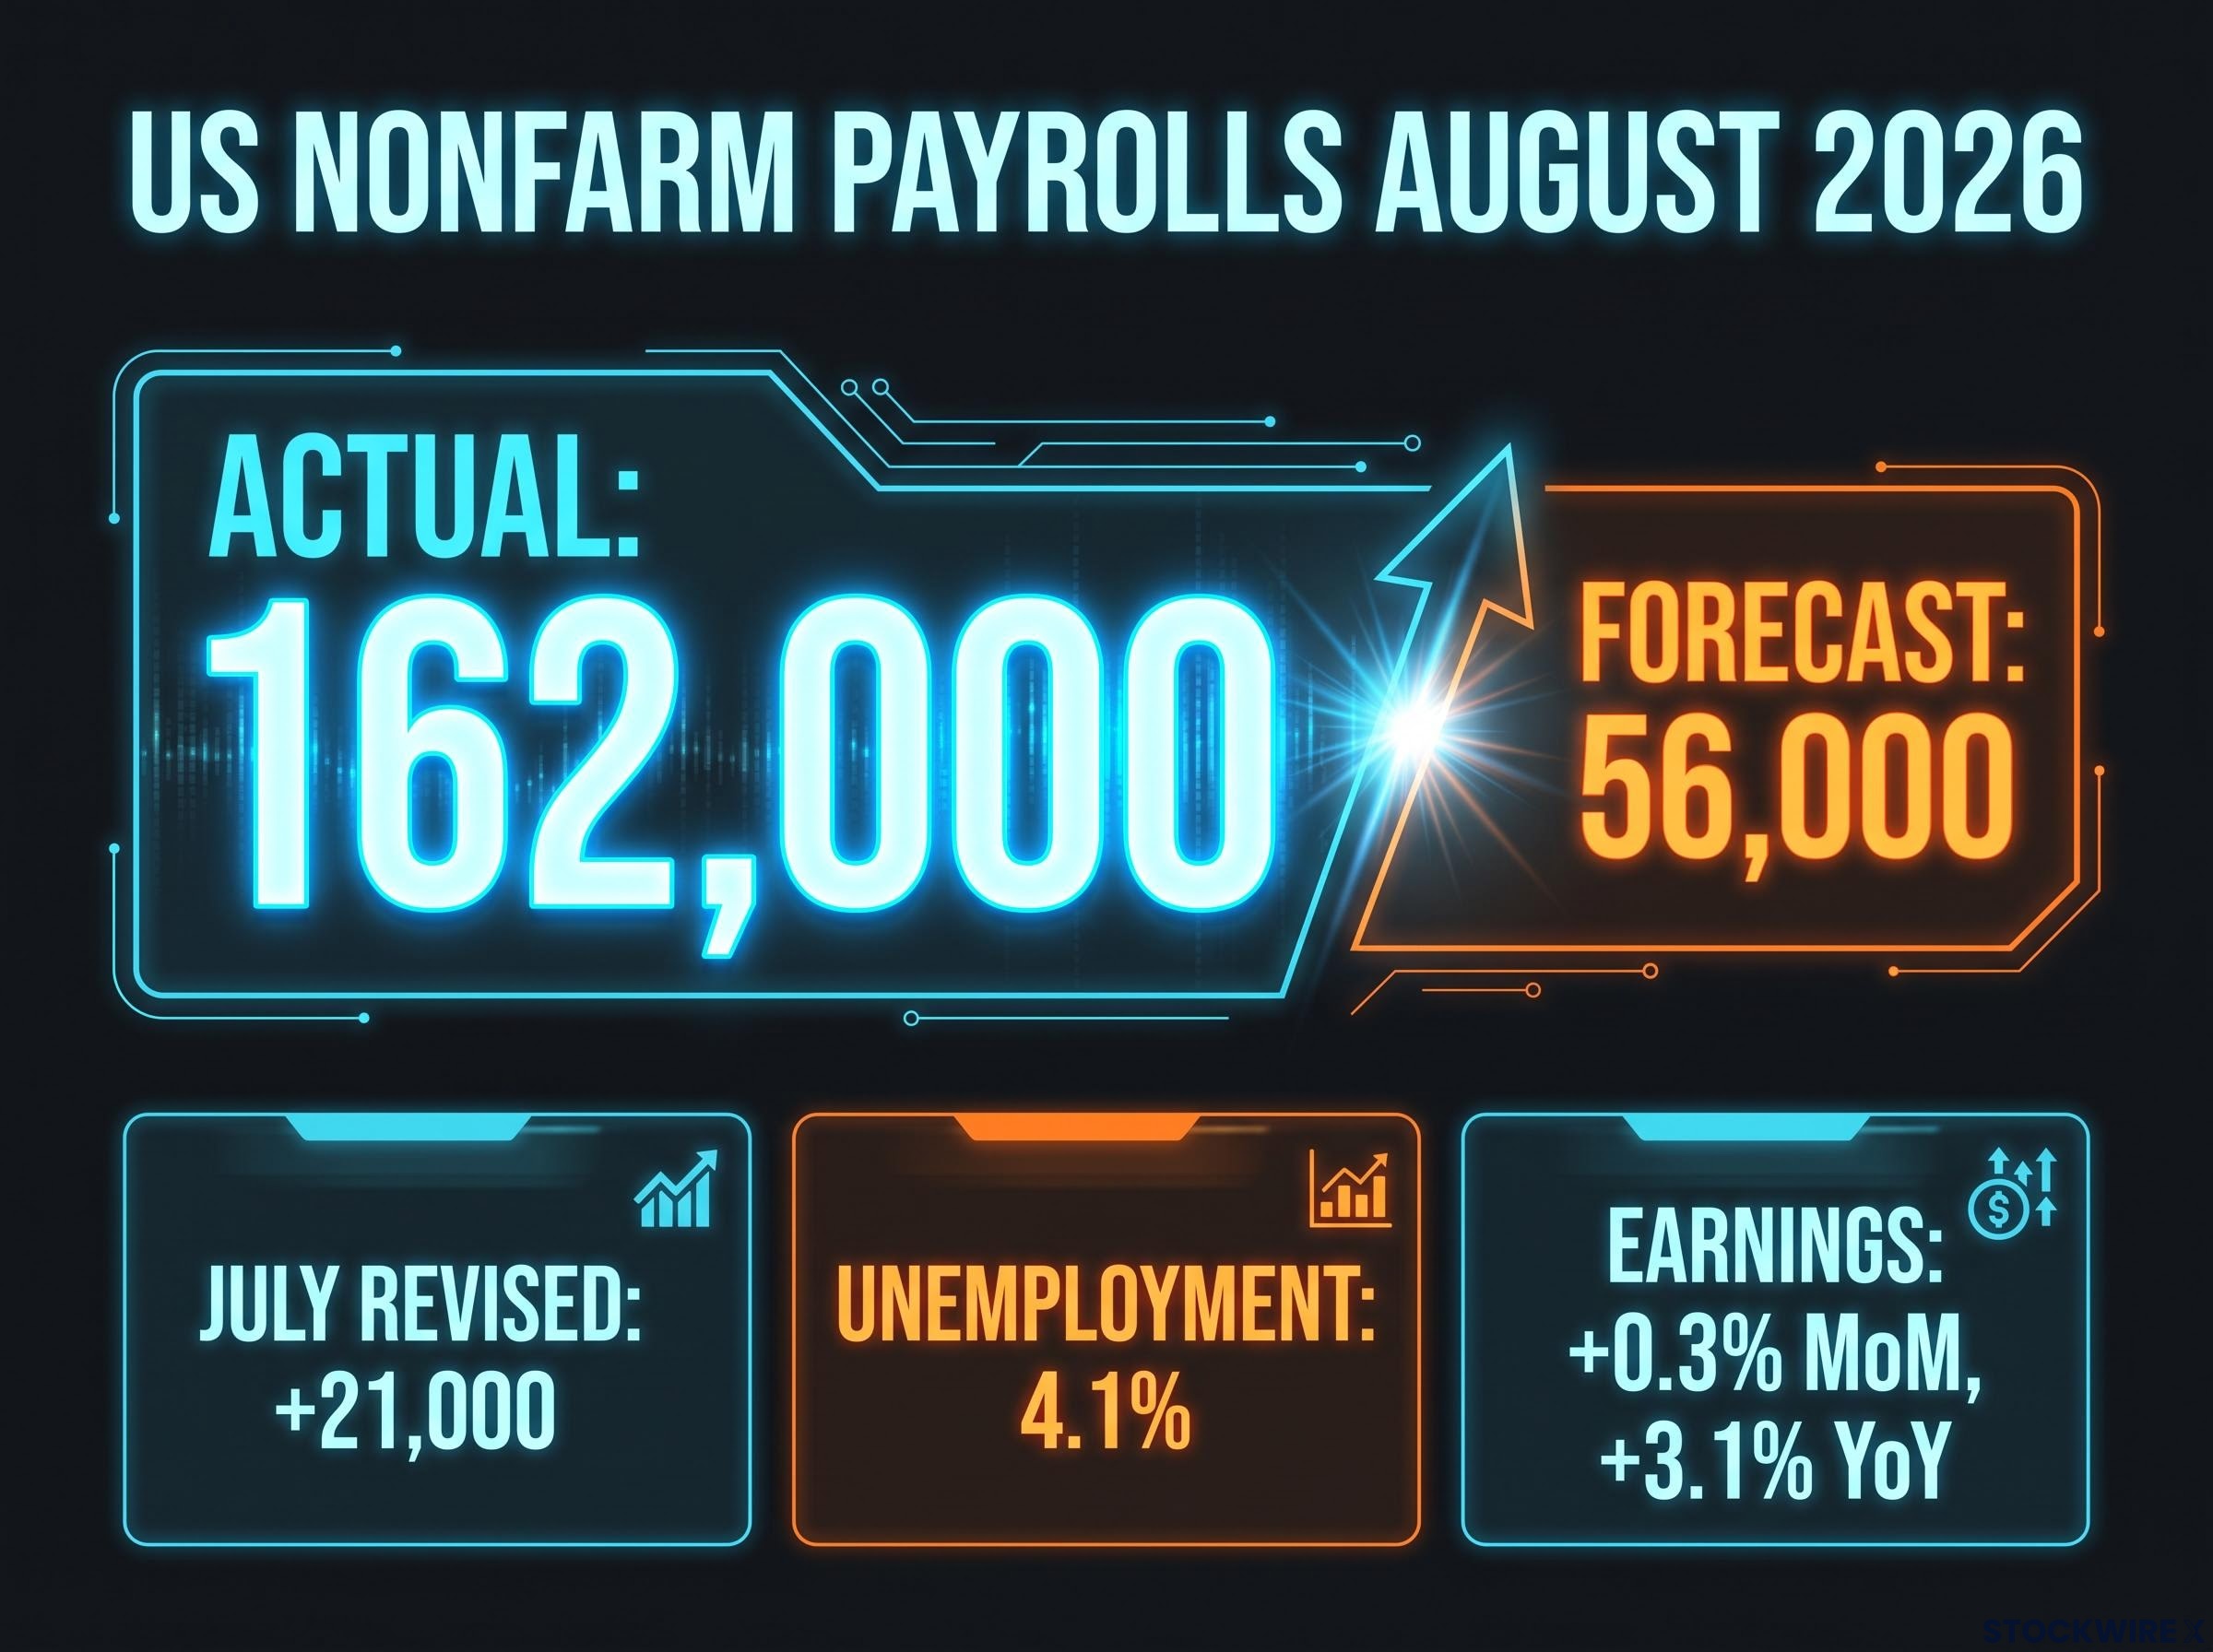
US nonfarm payrolls, August 2026 162,000 actual versus a consensus forecast of approximately 56,000. July’s figure was also revised upward by 21,000.
That is nearly triple what economists expected, and it handed the US Dollar fresh support at exactly the moment the Kiwi was already on the back foot. The supporting detail reinforced the strength rather than undercutting it.
- US Unemployment Rate held steady at 4.1%.
- Average hourly earnings rose 0.3% month-on-month and 3.1% year-on-year.
- Gains concentrated in food services, drinking places, and local government education, while the information sector shed jobs.
Here is the distinction that matters. The print confirmed one thing conclusively: the US labour market is resilient. It did not confirm the thing that actually drives the Fed, which is whether that labour strength forces further tightening. That remains inflation-conditional.
Goldman Sachs has flagged this directly, noting a moderate US CPI print could deter the Fed from additional hikes even against a solid jobs backdrop. The strong labour data tightens the interest-rate differential that structurally weighs on the Kiwi, but it does not settle the Fed’s next move.
This is why the strong data has not simply crushed the pair. The NZD/USD correlation with US note futures is currently running between 0.77 and 0.80, meaning the Kiwi trades closely to US rate expectations in the short term. If those expectations soften, the pressure eases.
The institutional community reflects that tension. BNZ lowered its year-end NZD/USD target from 0.63 to 0.59, citing stronger US momentum, and Bank of America maintained a “sell” recommendation into mid-2026. ING, by contrast, argues that if the Fed disappoints hawkish market pricing, the Kiwi has room to recover.
What this means for you is a shift in focus. The NFP beat sharpened the rate differential, but the Fed’s next step still hinges on inflation. The upcoming US CPI release is now the single most important data point on your calendar.
The NZD as a “dual-beta” currency: China, risk sentiment, and the structural overhang
Even if the RBNZ and the Fed both behave exactly as expected, the outlook carries a third layer of risk that headline-driven traders routinely ignore.
The Kiwi is what analysts, including commentary consistent with State Street Global Advisors, describe as a “dual-beta” currency. That means it is sensitive to two forces at once: the policy divergence between the RBNZ and the Fed, and broader global risk appetite. Three vectors define its behaviour.
- RBNZ/Fed policy divergence: the interest-rate story that dominates the news cycle.
- China and commodity exposure: dairy prices and China’s economic performance, given the Kiwi’s status as a higher-yielding risk currency.
- Global risk sentiment and geopolitical shocks: the risk-on, risk-off cycle that can override everything else.
The correlation with US note futures at 0.77-0.80 tells you the pair now trades more like a US rates proxy than a traditional commodity currency in short windows. That is a meaningful shift for anyone who still thinks of the Kiwi purely as a dairy-driven currency.
When macro overrides the central bank
The uncomfortable part is that macro forces can swamp the domestic story entirely. Geopolitical shocks and broad risk-off conditions have historically triggered capital outflows from the Kiwi, overriding positive domestic data or a hawkish RBNZ move outright.
China is the underappreciated variable here. Stronger-than-expected China PMI data can temporarily buoy the Kiwi, but institutional outlooks warn that softening global demand could force the pair toward the lower bounds of the 0.58-0.62 target range. Dairy prices and China PMI readings function as leading indicators for institutional positioning, not just background colour.
The takeaway for your risk management is direct. If global risk sentiment sours or China data disappoints in the weeks ahead, NZD/USD can test support levels that no RBNZ hike can offset. Hold that scenario alongside the central bank narrative, not instead of it. BNZ’s revised 0.59 target is the anchor for that downside case.
What the upcoming CPI print means for the path forward
Everything above resolves at one number. The ambiguity built through the technical structure, the RBNZ’s dovish framing, and the NFP beat all point to the same trigger: the upcoming US CPI release.
The reason is the conditional nature of that jobs print. Strong labour data hands the Fed the option to keep tightening, but only if inflation cooperates. CPI is the confirmation, and it forks the path cleanly in two directions.
| Scenario | CPI outcome | Fed implication | NZD/USD impact |
|---|---|---|---|
| Soft print | Inflation moderates | Reduced hike expectations (Goldman Sachs view) | Recovery toward 0.5903-0.5938 resistance |
| Hot print | Inflation persists | Reinforced tightening path | Tests 0.5840-0.5880, risks break to 0.5780-0.5820 |
A soft CPI print would relieve the rate-differential pressure that has weighed on the Kiwi, opening a path back toward the 0.5903-0.5938 resistance cluster. Goldman Sachs has argued exactly this, that a moderate reading could stay the Fed’s hand even after strong jobs data. ING adds that if the Fed disappoints hawkish market pricing, the Kiwi could recover part of its losses.
A hot print does the reverse. It reinforces the differential, pushes the pair into the 0.5840-0.5880 support zone, and risks a break toward the confluence support at 0.5780-0.5820.
With the RBNZ expected to pause in October, there is no fresh policy impetus from the New Zealand side until December at the earliest. That leaves the near-term direction entirely in US hands.
So the decision framework is quantitative, not vague. Whether you hold, reduce, or add to NZD/USD exposure should hinge on your view of the CPI print, with BNZ’s 0.59 target as the realistic downside anchor if both US inflation and global sentiment work against the Kiwi at once.
This article is for informational purposes only and should not be considered financial advice. Investors should conduct their own research and consult with financial professionals before making investment decisions. Past performance does not guarantee future results. Financial projections are subject to market conditions and various risk factors, and these statements are speculative and subject to change based on market developments.
Two catalysts, one stalemate: where the NZD/USD goes from here
The pair is not directionless by accident. It is in a holding pattern defined by two-sided uncertainty, and the resolution depends on a sequence of catalysts rather than any single event.
The RBNZ’s expected October pause removes one potential near-term Kiwi catalyst entirely, which shifts the immediate directional weight onto US data. Resistance caps the pair at 0.5903 and support holds near 0.5872-0.5876. A recovery toward 0.5903-0.5938 is the near-term bull case threshold; BNZ’s 0.59 year-end target frames the bear case.
Rather than a general sense of caution, here is the concrete watchlist to carry into the coming weeks.
- US CPI release: the primary near-term directional trigger. A soft print relieves pressure; a hot print tests support.
- RBNZ December guidance: watch the language, not the rate. The committee’s tone on 2027 tightening will move the Kiwi more than the decision itself.
- China PMI and dairy markets: leading indicators for institutional positioning and the Kiwi’s risk-currency exposure.
- Global risk appetite: geopolitical developments and risk-off episodes that can override both technical support and RBNZ policy.
Work that list, and the paradox from the start makes sense. A hike weakened the currency because the market trades guidance, not rates, and the next real move waits on inflation.